
How do probability weighting models prevent pipeline inflation in forecast accuracy?

Probability Weighting Prevents Pipeline Inflation

Direct: Assign deal-stage win rates to opportunities, discount pipeline by actual conversion likelihood rather than counting all deals equally.
Operator Detail
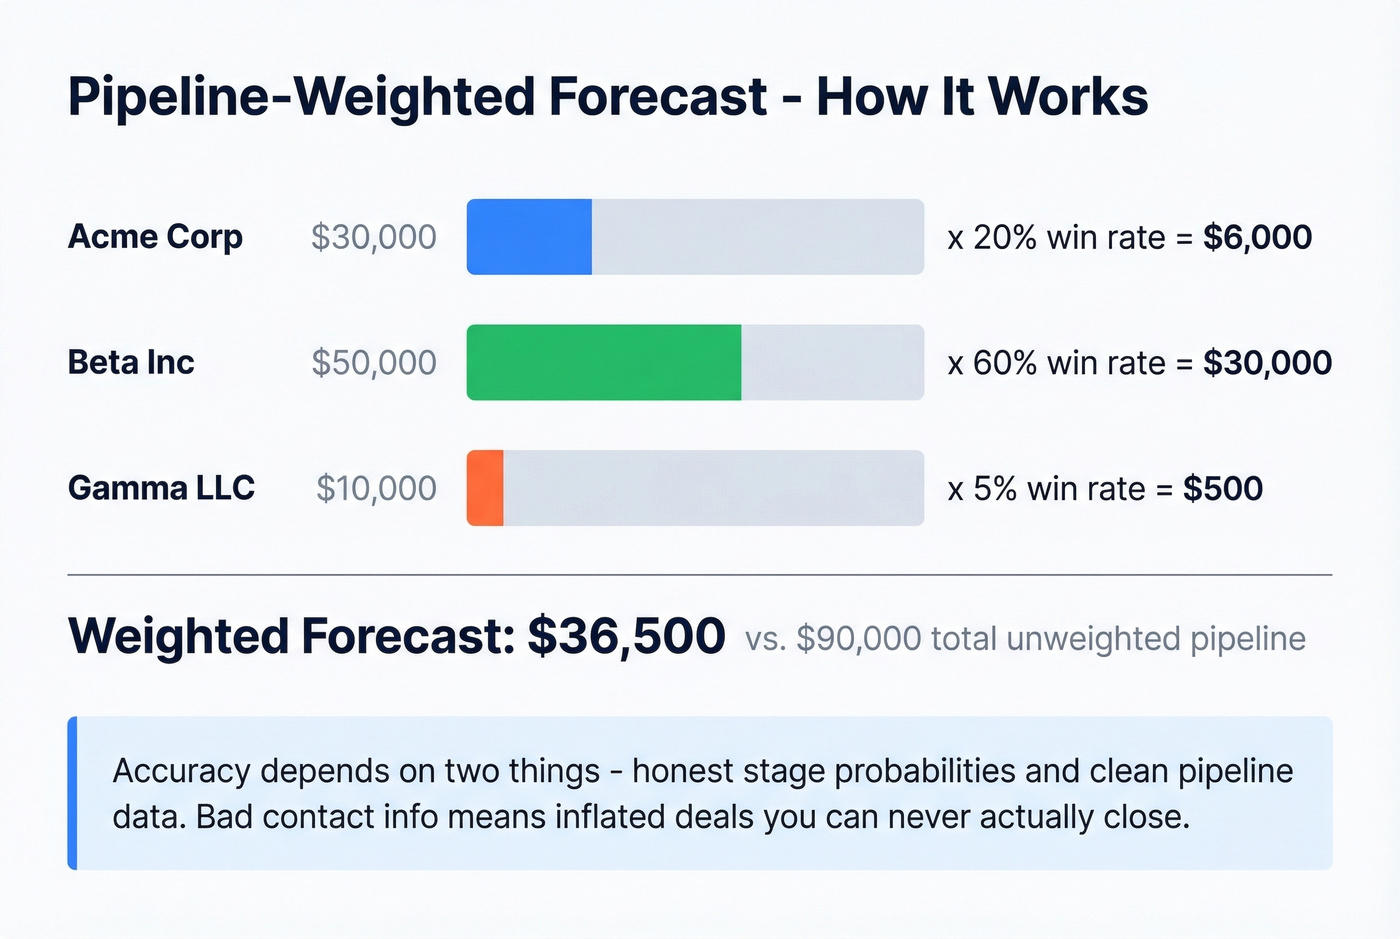
Probability weighting fixes the "assume everything closes" problem that inflates forecasts. Instead of counting a $100K deal in early stage the same as a $100K deal in final negotiation, weight each deal by stage-specific historical win rate.
How it works:
- Assign win rates by stage: Prospecting 10%, Qualification 25%, Proposal 60%, Negotiation 85%, Commitment 95%
- Calculate true value: ($100K deal in Qualification) × 0.25 = $25K weighted value
- Aggregate by confidence level: Build commit, best-case, and pipeline forecasts from individual deal weights
- Validate against historical close rates: Pavilion and Bridge Group research shows reps who weight deals by stage cut forecast error by 30-40%
Why Traditional Counting Fails
Without weighting, a pipeline of 10 early-stage deals ($100K each) = $1M forecast. Reality: at 10% win rate, only $100K closes. Probability weighting reveals the true $100K capacity.
The CRO Win
OpenView data shows companies adopting per-stage weighting reduce forecast miss variance by $200K-$500K per quarter on million-dollar pipelines. Board reporting becomes credible, not optimistic fiction.
TAGS: forecast-accuracy,probability-weighting,pipeline-inflation,stage-win-rates,deal-hygiene,forecast-precision
FAQ
What win rates does the article assign to each deal stage for probability weighting? Prospecting 10%, Qualification 25%, Proposal 60%, Negotiation 85%, and Commitment 95%. Each open deal gets multiplied by its stage-specific historical win rate instead of being counted at full value.
How do you calculate the weighted value of a single deal? You multiply deal size by the stage win rate, so a $100K deal in Qualification becomes $100K times 0.25, or $25K weighted value. Aggregating those weighted figures by confidence level builds the commit, best-case, and pipeline forecasts.
Why does counting every deal equally inflate the forecast? Without weighting, ten early-stage $100K deals read as a $1M forecast, but at a 10% win rate only about $100K actually closes. Probability weighting reveals that true $100K capacity instead of the inflated $1M figure.
How much does per-stage weighting improve forecast accuracy? Pavilion and Bridge Group research cited in the article shows reps who weight deals by stage cut forecast error by 30-40%. OpenView data adds that companies adopting per-stage weighting reduce forecast miss variance by $200K-$500K per quarter on million-dollar pipelines.
What does probability weighting do for board reporting? By matching forecasts to actual stage conversion likelihood, it makes board reporting credible rather than optimistic fiction. The aggregated weighted forecast produces commit, best-case, and pipeline numbers that track actual close rates within roughly ±10%.