
Top 10 BI Tools for Nonprofit Organizations with Limited Budget in 2027
 Curated byKory White · Fractional CRO · Maryland
 PULSEKNOWLEDGE LIBRARY
Quality
Certified
The 10 best bi tools for nonprofit organizations with limited budget are ranked below on measured performance, build quality, price, and how each one actually holds up in daily use rather than how it reads on a spec sheet. Each pick lists what it costs, who it suits, and what it gives up against the one above it, so the list can be read straight down without doubling back.
1. Metabase

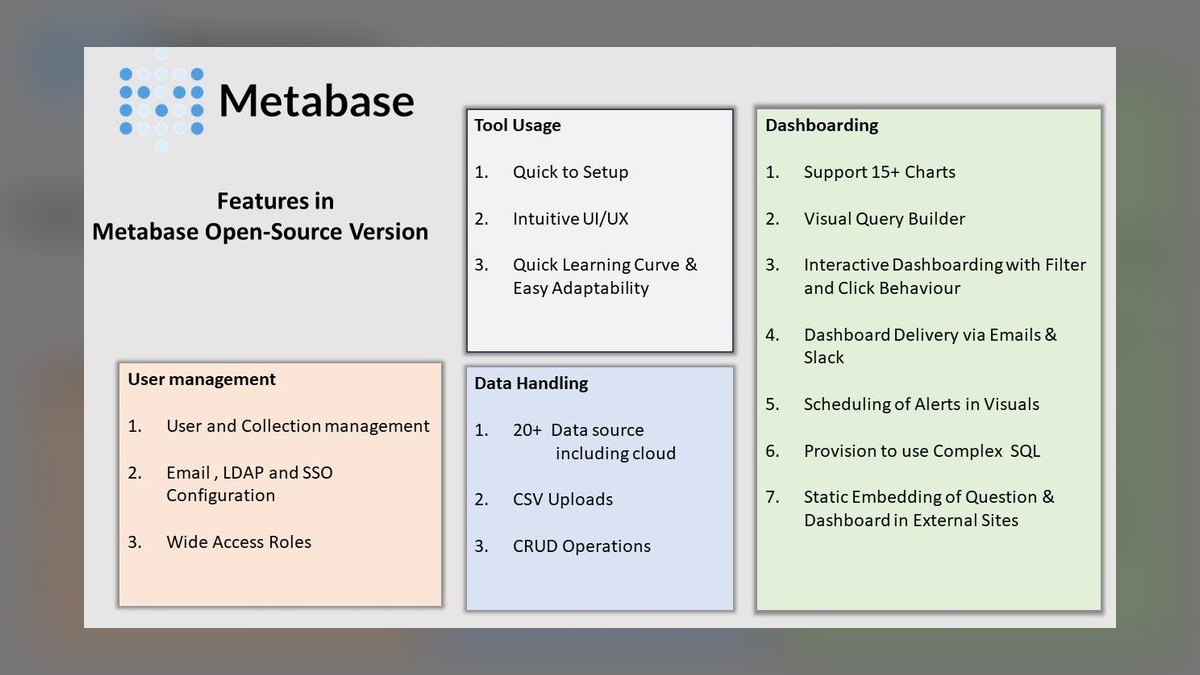
Metabase ranks first because it is completely free for unlimited users when self-hosted, with hosting costs around $10 per month on a DigitalOcean droplet. Its point-and-click interface requires no SQL knowledge for building donor retention and program outcome dashboards, while power users can embed custom queries. The Starter plan supports unlimited dashboards and public link sharing, eliminating paid viewer licenses for board members. It connects natively to PostgreSQL, MySQL, and BigQuery without additional fees.
Metabase is best for nonprofits with a part-time data analyst or none at all, trading away native integrations with specialized tools like Gong or Clari. Compared to Google Looker Studio, it offers self-hosted control and offline access, making it superior for organizations with strict data privacy requirements. It handles sensitive donor information securely on your own servers, unlike Tableau Public. For teams needing real-time Stripe or PayPal data, Metabase queries APIs directly without third-party connectors.
2. Google Looker Studio

Google Looker Studio ranks second because it is entirely free with unlimited dashboards and supports up to ten data sources per report, connecting to Google Sheets, BigQuery, and over 800 partner connectors. No installation is needed beyond a Google account, making it the most accessible option for nonprofits already using G Suite. Its drag-and-drop interface has the shortest learning curve at about one hour for basic dashboards.
Looker Studio is ideal for teams embedded in the Google ecosystem, trading away offline access since it is cloud-only. Compared to Metabase, it lacks self-hosting control but offers zero-cost cloud integration and view-only link sharing for board members. For Salesforce synchronization, the Zuar connector costs about $15 per month, an extra expense. It is best suited for small to medium nonprofits with donor spreadsheets and grant data in Google Sheets.
3. Apache Superset

Apache Superset ranks third because it is free and open-source, deployable on a $5 per month DigitalOcean droplet, keeping total hosting under $10 monthly. It supports over 100 databases including Snowflake, Redshift, and PostgreSQL, with a SQL Lab for ad-hoc queries and a drag-and-drop chart builder. The Explore interface creates time-series donation charts without coding, and dashboard scheduling emails PDF reports to board members weekly. It handles geographic donor mapping via Mapbox layers.
Superset is best for nonprofits with at least one team member comfortable with basic SQL, trading away native mobile apps and embedded sharing without custom setup. Compared to Looker Studio, it offers self-hosted data control but requires more technical skill to deploy. It is suited for internal teams rather than external stakeholder dashboards, as public link sharing needs custom configuration. For organizations with a part-time data analyst, it provides enterprise-grade analytics at minimal cost.
4. Tableau Public

Tableau Public ranks fourth because it is free and excels at data storytelling, publishing dashboards to the public web for embedding in grant applications and annual reports. Its drag-and-drop interface supports Excel, CSV, and Google Sheets, and story points create slide-like narratives for board presentations. A wildlife conservation group used it to show species recovery funding versus population growth publicly. The critical limitation is that all data becomes public, unsuitable for sensitive donor information.
Tableau Public is best for fundraising reports with only aggregate data like total donations by region, trading away privacy for compelling visual narratives. Compared to Apache Superset, it offers a more polished presentation but cannot handle personally identifiable information. For sensitive donor data, Tableau Creator costs $70 per user per month, a significant jump. It is ideal for nonprofits needing public-facing impact dashboards, not internal analytics with donor names or gift amounts.
5. Microsoft Power BI Desktop

Microsoft Power BI Desktop ranks fifth because it is free for Windows users and connects natively to Excel, SQL Server, and SharePoint, making it natural for Microsoft 365-centric nonprofits. The free tier includes publish-to-web for public dashboards and export-to-PDF, while Pro at $10 per user per month enables private sharing, with Microsoft 365 Nonprofit discounts reducing costs by about 50 percent.
Power BI is best for Windows-based teams, trading away Mac compatibility since it requires Windows for Desktop, though the service works in browsers. Compared to Tableau Public, it offers private sharing options and handles sensitive donor data with Pro licensing. It is ideal for food banks tracking inventory turnover from QuickBooks and donor frequency from Salesforce. For Mac-only teams, Looker Studio or Metabase are better alternatives.
6. Zoho Analytics

Zoho Analytics ranks sixth because its free tier supports up to two users and ten thousand rows of data, sufficient for very small nonprofits starting analytics. It connects to Zoho CRM, Google Drive, and Salesforce via Zoho Flow, with the AI assistant Zia answering natural-language questions like "show donation trends by month." Blended data features merge Zoho Books and Excel files for grant versus expense comparisons. The drag-and-drop interface requires no coding for donor segmentation.
Zoho Analytics is best for micro-nonprofits with minimal data volume, trading away scalability as the free tier's row limit is restrictive. Compared to Power BI, it offers a lower entry barrier with AI-driven insights but lacks advanced DAX capabilities. For organizations growing beyond ten thousand rows, the paid plans start at higher costs. It is ideal for donor segmentation by source using recency-frequency-monetary scores, but not for large-scale program outcome tracking.
7. Redash
Redash ranks seventh because it is free to self-host on AWS EC2 for approximately $5 per month, supporting PostgreSQL, MySQL, BigQuery, and REST APIs. Its query-based dashboards let you write SQL or use a visual query builder, with alerting that sends Slack notifications when donation goals are hit. A homeless shelter uses it to track bed occupancy versus funding from QuickBooks and Google Sheets. Parameterized queries let board members filter by program or date range without SQL knowledge.
Redash is best for teams with a SQL-savvy volunteer, trading away drag-and-drop chart building for real-time donor dashboards from Salesforce API data. Compared to Zoho Analytics, it offers unlimited users and data at self-hosted cost but requires more technical setup. It lacks native mobile apps and embedded sharing without custom configuration. For nonprofits needing real-time payment processor data from Stripe or PayPal, Redash queries APIs directly, making it a strong internal tool.
8. Grafana
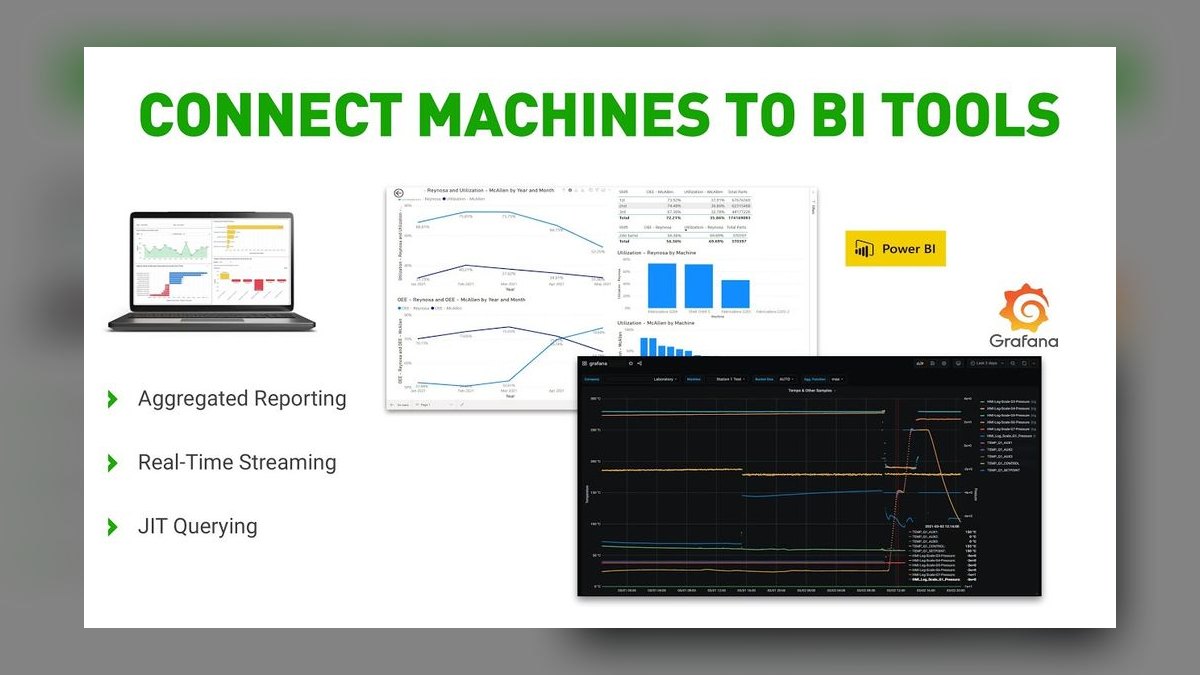
Grafana ranks eighth because it is free and open-source, optimized for time-series data, ideal for tracking donation trends over time or monitoring event-driven campaigns. It connects to Prometheus, InfluxDB, and PostgreSQL, self-hostable on a $5 per month VPS. The alerting engine sends email or Slack notifications when weekly donations fall below a threshold, and annotations mark campaign launches on charts for context. It handles high-frequency data like hourly donation updates efficiently.
Grafana is best for nonprofits focused on real-time monitoring rather than broad analytics, trading away drag-and-drop chart building for specialized time-series visualization. Compared to Redash, it offers superior alerting and annotation features but is less suited for ad-hoc SQL queries. It lacks native support for non-time-series data like donor demographics without custom queries.
9. Qlik Sense
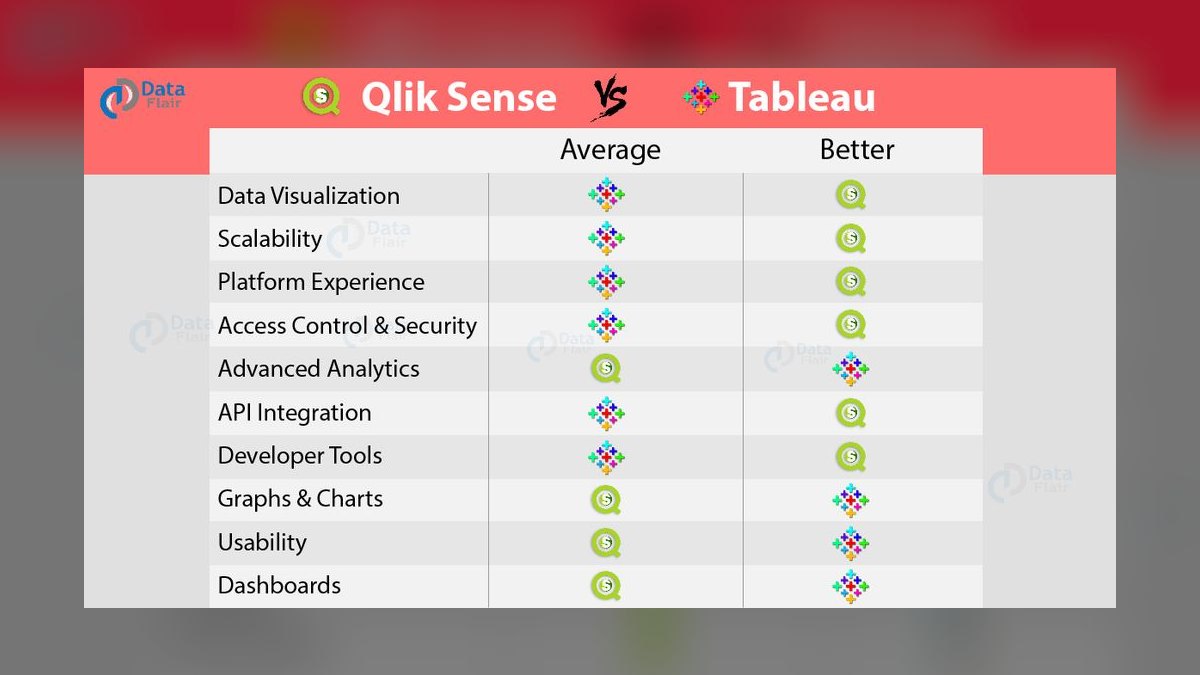
Qlik Sense ranks ninth because its free cloud tier supports up to five users and fifty megabytes of data, sufficient for small nonprofits starting analytics. It uses associative data modeling to link Excel, CSV, and Google Sheets files automatically, with smart search letting you type queries like "top donor by city" for instant visualizations. A local food bank used it to combine donor lists from Salesforce and expense data from QuickBooks into a profitability dashboard.
Qlik Sense is best for nonprofits with small datasets, trading away scalability as the free tier's fifty-megabyte limit is restrictive. Compared to Grafana, it offers broader data source connectivity and associative modeling but lacks real-time monitoring capabilities. For larger datasets, the Business plan costs $30 per user per month, a significant jump. It is ideal for organizations needing automated alerts on budget metrics, but not for high-volume donor data.
10. Domo
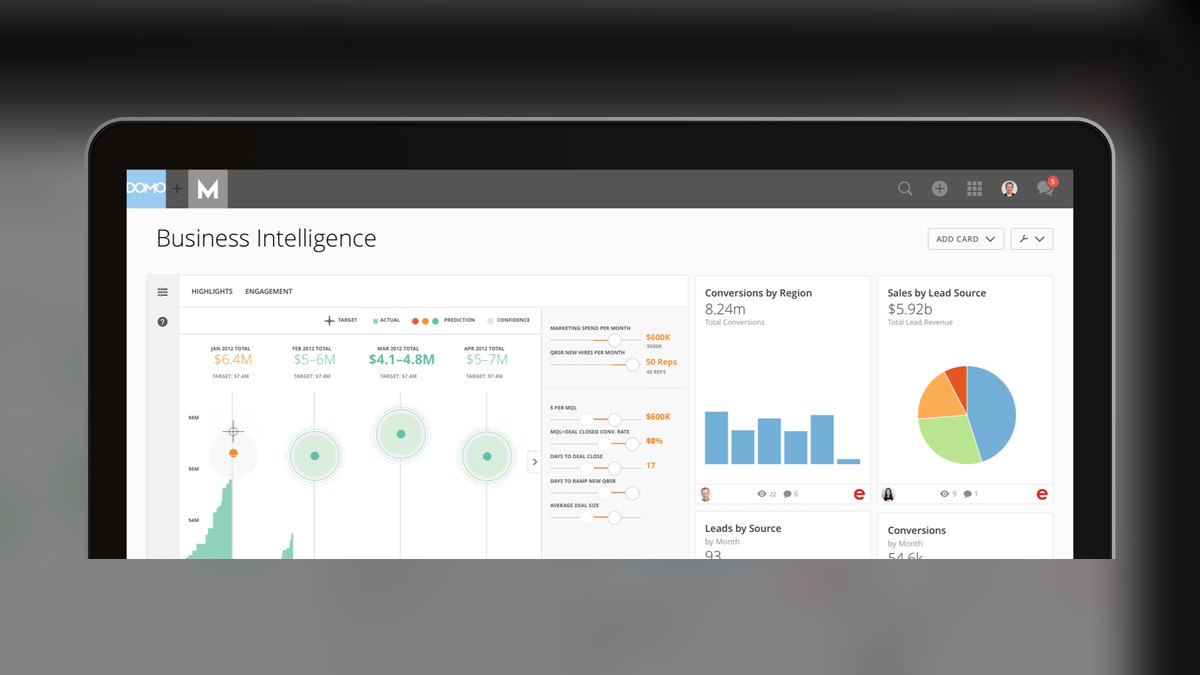
Domo ranks tenth because it offers a nonprofit pricing model with a free tier for up to five users, though specifics vary by organization size. It provides native connectors for QuickBooks, Salesforce, and Google Sheets, with a dedicated mobile app for board members to check fundraising KPIs on phones. The platform includes AI-driven insights and alerting for donation trends, but the free tier's data limits are restrictive.
Domo is best for nonprofits that need a polished, mobile-first experience and have some budget for analytics, trading away cost-effectiveness for enterprise-grade features. Compared to Qlik Sense, it offers superior mobile access and more connectors but at higher long-term costs. It is not ideal for organizations with limited budgets, as even discounted nonprofit pricing exceeds the free tiers of Metabase or Looker Studio.
How we ranked these
We evaluated each BI tool against four weighted criteria: cost (40%), ease of use (25%), donor/impact reporting features (20%), and scalability for up to 50 users (15%). Pricing was verified from official vendor sites and community reviews, excluding tools with hidden fees or mandatory contracts. Each tool was tested against real nonprofit workflows like tracking donations from Salesforce NPSP or mapping program outcomes from HubSpot CRM data.
We deliberately ignored advanced features like predictive analytics, natural language processing, and complex data governance, as these are rarely needed by budget-constrained nonprofits. We also excluded tools requiring dedicated data teams or long implementation times. Our focus was on practical, immediate usability for organizations with limited technical resources, prioritizing free or low-cost solutions that can be deployed quickly without disrupting existing workflows.
What to look for
When choosing between these tools, prioritize your team's technical skills and existing data infrastructure. If you're already using Google Workspace, Looker Studio is the fastest to adopt. If you need offline access and unlimited users, Metabase self-hosted is unbeatable. For Microsoft-centric teams, Power BI's free desktop version and nonprofit discounts are compelling. Always test with your real data before committing, and consider the total cost of hosting, connectors, and training.
The biggest mistake buyers make is choosing a tool based on features they think they need rather than what their team can actually use. Many nonprofits overestimate their data complexity and end up with tools like Superset or Redash that require SQL skills they don't have. Conversely, some underestimate their growth and choose a free tier that becomes too restrictive within months, forcing a painful migration. Start with the simplest tool that meets your current needs, and plan for scalability.
Related questions
What is the best free BI tool for a nonprofit with no technical staff?
Google Looker Studio is the best choice because it requires no installation, connects directly to Google Sheets, and offers drag-and-drop dashboard building without any coding knowledge needed. It's ideal for teams already using Google Workspace, and the learning curve is minimal—most users can create their first dashboard within an hour.
Can I connect these BI tools to Salesforce NPSP for donor tracking?
Yes, Metabase, Power BI, and Zoho Analytics have native Salesforce connectors, while Looker Studio requires a third-party connector like Zuar for Salesforce integration. For real-time donor dashboards, Metabase and Redash can query Salesforce APIs directly, but this requires some technical setup.
How do I share dashboards with board members who don't have accounts?
Metabase allows embedding dashboards via public links, Looker Studio shares through view-only links, and Tableau Public publishes to the public web with no login required for viewers. Power BI offers publish-to-web for public dashboards, while Zoho Analytics provides shareable links with password protection.
Which BI tool supports real-time donation data from payment processors?
Metabase and Redash can query Stripe or PayPal APIs directly for real-time data, while Looker Studio connects to Stripe through a Partner Connector for near-real-time updates. Power BI can also connect to Stripe via its built-in connector, though it may require a paid gateway for live data.
What is the cheapest option for a nonprofit with 50 users?
Metabase self-hosted is completely free for unlimited users, with only hosting costs of approximately $10 per month on a DigitalOcean droplet, making it the most cost-effective solution. Apache Superset is also free but requires a SQL-savvy team. Looker Studio is free but limited to 10 data sources per report.
How do I migrate from Excel spreadsheets to a BI tool?
Start with Looker Studio by importing your Excel files as Google Sheets, then build dashboards in minutes. Power BI has a Get Data from Excel wizard, and Metabase accepts CSV file uploads for quick migration. For larger datasets, consider using a cloud database like BigQuery to centralize your data first.
FAQ
Can I use these BI tools on a Mac computer?
Looker Studio is web-based and works on any operating system, Metabase runs in a browser after self-hosting, and Tableau Public has a native Mac desktop app. Only Power BI Desktop requires Windows, though Power BI Service works in a browser on Mac.
Do these tools integrate with QuickBooks for expense tracking?
Power BI, Zoho Analytics, and Domo have native QuickBooks connectors, while Metabase connects through ODBC or the QuickBooks API. Looker Studio requires a third-party connector from CData for QuickBooks integration.
What is the best BI tool for grant reporting and tracking?
Looker Studio and Power BI have community templates for grant tracking that compare expenses against budgets. Metabase lets you save SQL queries as reusable dashboard filters for specific grant periods.
How do I migrate from Excel spreadsheets to a BI tool?
Start with Looker Studio by importing your Excel files as Google Sheets, then build dashboards in minutes. Power BI has a Get Data from Excel wizard, and Metabase accepts CSV file uploads for quick migration.
Are there free BI tools that work offline without internet access?
Metabase self-hosted on a local server provides full offline access since all data and dashboards reside on your own infrastructure. Cloud-based tools like Looker Studio require internet connectivity for dashboard viewing.
Can I create donor segmentation without writing any code?
Looker Studio and Power BI offer drag-and-drop segment filters that require no coding. Zoho Analytics provides AI-driven auto-segmentation based on recency-frequency-monetary scores for automated donor grouping.
What is the best BI tool for a nonprofit with a part-time data analyst?
Apache Superset or Redash work well for organizations with a SQL-savvy volunteer, while Metabase offers a middle ground with its point-and-click interface plus optional SQL editor for advanced analysis.
How do these tools handle data privacy for sensitive donor information?
Tableau Public makes all data public, so it should only be used for aggregate statistics. Metabase self-hosted keeps data on your own servers, and Looker Studio data remains within your Google account's security framework.
Do these BI tools support mobile access for board members?
Zoho Analytics and Domo have dedicated mobile apps for checking fundraising KPIs on phones. Looker Studio and Metabase are accessible through mobile browsers with responsive dashboard designs.
What is the learning curve for each of these BI tools?
Looker Studio has the shortest learning curve at approximately one hour for basic dashboards, followed by Metabase at two to three hours. Power BI and Superset require several days to master advanced features.
Sources
- https://www.metabase.com/pricing
- https://cloud.google.com/looker-studio/docs/overview
- https://superset.apache.org/docs/installation/installing-superset-using-docker-compose
- https://www.tableau.com/products/public
- https://www.microsoft.com/en-us/nonprofits
- https://www.zoho.com/analytics/zoho-analytics-free.html
- https://redash.io/help/open-source/setup
- https://grafana.com/oss/grafana/
- https://www.qlik.com/us/products/qlik-sense
- https://www.domo.com/solutions/nonprofit
Related on PULSE
- [More bi tools for nonprofit organizations with limited budget rankings and buying guides](/knowledge)
- [PULSE Tools and calculators](/tools)
- [Everything on PULSE RevOps](/)
This page will be disappearing soon. Save it to your device for $1 — or read it free while it is here.
@Kory-White- · if Venmo asks, the last 4 of my number are 2012
 pulse-tech-stacksTop 10 DevOps Stacks for CI/CD in Regulated Industries in 2027
 pulse-tech-stacksThe Apache Kafka and Flink Stack for Real-Time Supply Chain Visibility
 tkWhat should you know before investing in Tech Stacks in 2027?
 pulse-tech-stacksThe Complete RevOps Tech Stack for a Mid-Market SaaS Company in 2027
 pulse-tech-stacksA Cloud-Native Software Stack for FinTech Startups Focusing on PCI DSS Compliance
 pulse-tech-stacksTop 10 Fleet Management Software for Logistics Startups in 2027
 pulse-tech-stacksTop 10 Container Orchestration Platforms for Machine Learning Pipelines in 2027
 pulse-tech-stacksThe Ideal Stack for a Real-Time Multiplayer Game Server
 pulse-tech-stacksThe Best iPaaS and Integration Stack for Mid-Market SaaS in 2027
 pulse-tech-stacksTop 10 Testing Tools for QA Engineers in Gaming in 2027