
How do you A/B test different LLMs in production in 2027?
 Curated byKory White · Fractional CRO · Maryland
 PULSEKNOWLEDGE LIBRARY
Quality
Certified

A/B testing LLMs in production means routing a controlled slice of live traffic — typically 5–10% per variant — to different models behind a stable interface, then comparing quality, latency, cost, and downstream business outcomes on the same requests. Hold the prompt constant, log every call with a variant tag, and wait for statistical significance before promoting a winner.
The outcome you should expect
Teams come to LLM A/B testing expecting a clean verdict: model X beats model Y, ship it. What you actually get is a trade surface. In nearly every honest production test, the more expensive model wins on quality by a margin smaller than the price gap, and the cheaper model wins on latency. The decision is rarely "which is better" — it is "how much quality am I willing to trade for a 3x cost reduction and a 400ms latency improvement on this specific route."
Expect the quality delta between frontier models on your task to be smaller than the benchmark leaderboards suggest. Public benchmarks measure hard reasoning problems; your production traffic is probably summarization, classification, extraction, or templated drafting, where the ceiling is lower and the models cluster. It is common for a mid-tier model to land within a few percentage points of a frontier model on a narrow production task while costing a fraction as much. That is the whole reason the test is worth running — you are hunting for the cases where the cheap model is good enough, not for a general ranking.
Expect the test to change your prompt, not just your model. The first run almost always reveals that your prompt was silently tuned to one model's quirks — its default verbosity, its formatting habits, its willingness to refuse. A prompt written iteratively against one model carries hidden dependencies: an output format the model happens to produce reliably, an instruction phrasing it responds to, a system-message structure it weights heavily. Swap the model and those dependencies surface as format errors and tone drift that look like quality regressions but are really portability bugs. Budget a prompt-neutralization pass before you trust any cross-model comparison.

Expect the operational finding to matter as much as the quality finding. Running two models in production for two weeks teaches you their failure signatures: which one degrades under provider load, which one has fatter tail latency, which one changes behavior after a silent version bump, which one rate-limits you at the worst moment. That knowledge is the real deliverable. Teams that skip the production phase and decide from offline evals routinely ship a model that scores well and then behaves badly at p99 on a Monday morning.
Finally, expect the result to be route-specific and perishable. The winner for your support-reply route is often not the winner for your data-extraction route, and both verdicts expire when either provider ships a new version. A production A/B harness is not a one-time project; it is standing infrastructure you re-run every time a model updates.
What drives that outcome
Four forces determine whether your test produces a trustworthy answer or an expensive coin flip.

Traffic assignment. Assignment must be deterministic and sticky. Hash a stable key — user ID, session ID, or account ID — into buckets, so the same user always lands on the same variant for the duration of the test. Random per-request assignment corrupts any multi-turn experience: a user gets a formal answer, then a chatty one, then a formal one again, and your feedback signal becomes noise. Sticky assignment also lets you attribute downstream conversion and revenue to a variant, which is the only way to connect a model choice to a number the business cares about.
Metric hierarchy. Pick one primary metric before you start and treat everything else as a guardrail. The primary metric should be the closest available proxy for user value — task completion, accepted-suggestion rate, escalation-avoided rate, resolution without human handoff. Guardrails are the things that must not get worse: p95 latency, cost per request, error rate, refusal rate, and safety violations. Without this hierarchy you will end up staring at twelve dashboards and picking the model that looks best on whichever chart you happen to like, which is how you launder a preference into a decision.
Judgment mechanism. Human labels are the gold standard and are too slow to run continuously. LLM-as-judge is fast and cheap and carries its own biases — notably a preference for longer, more verbose answers and a documented tendency to favor outputs from the same model family. The workable pattern is a layered one: automated judging on all traffic to detect movement, plus a human-labeled sample of a few hundred pairs per week to calibrate the judge. If the judge and the humans disagree on more than roughly a fifth of the sample, the judge rubric is broken and its verdicts should not be trusted.
Statistical discipline. LLM quality metrics are noisier than clickthrough rates, so effects that look large in the first hundred requests routinely evaporate. Fix your sample size in advance, or use a sequential testing method designed for continuous monitoring. Peeking at a fixed-horizon test and stopping when the p-value dips below 0.05 inflates your false-positive rate substantially — you will "discover" winners that are noise, ship them, and then be confused when the metric reverts.

Benchmarks and realistic ranges
Concrete planning numbers, with the caveat that everything here is a starting range to instrument against, not a promise.
Sample size. For a binary quality metric sitting near 80% — "was this answer acceptable" — detecting a 5-percentage-point absolute improvement at 95% confidence and 80% power needs roughly a thousand observations per variant. Detecting 2 points needs several thousand per variant. Detecting 1 point pushes you into the tens of thousands. This is the single most useful calculation to run before starting, because it tells you immediately whether your traffic volume can even answer the question you are asking. A route serving 200 requests a day cannot resolve a 2-point difference in under a month, and you should either widen the effect size you care about, pool related routes, or accept that the decision will be made on cost and latency instead.
Test duration. At 10% allocation per variant, a route doing 50,000 requests a day gives you 5,000 tagged requests per variant per day — enough for a 5-point effect within a day, though you should still run a full week to cover weekday and weekend traffic mix. At 5,000 requests a day, the same test takes one to two weeks. As a rule, never call a test on less than seven days regardless of volume, because traffic composition swings by day of week and you will otherwise measure the difference between Tuesday and Saturday.

Latency. Model latency varies by an order of magnitude across the tier spectrum. Small fast models commonly return short completions in a few hundred milliseconds; large reasoning models on long outputs can take many seconds, and extended-thinking modes longer still. What matters for production is the tail, not the mean. Track p50, p95, and p99 separately per variant, and treat p99 as a guardrail — the average can improve while your worst experiences get materially worse, and it is the worst experiences that generate support tickets. Time-to-first-token matters more than total latency for any streamed interface, so log both.
Cost. Per-token pricing spans roughly two orders of magnitude between the smallest and largest models across providers. The practical consequence is that token count is often a bigger lever than model choice: a verbose model on a cheap tier can cost more per task than a terse model on an expensive tier. Measure cost per completed task, not cost per token. Include retries, failed calls, judge calls, and any RAG-side embedding cost in the denominator, because a model that needs a retry 8% of the time is 8% more expensive than its sticker price suggests. Prompt caching changes this arithmetic significantly on routes with long stable system prompts — if your variants have different caching behavior, normalize for it or you are measuring cache hit rates rather than models.
Judge agreement. Well-constructed LLM judges typically land somewhere in the 70–85% agreement band with human raters on subjective quality tasks, and higher on objective ones like "did it produce valid JSON" or "did it cite the retrieved passage." Below about 70%, the judge is contributing more noise than signal. Improve it by narrowing the rubric to specific checkable criteria rather than asking for a holistic 1–10 score, by randomizing which variant is presented first to counter position bias, and by scoring pairwise rather than absolute.

Ramp schedule. A workable ladder is 5% for the first significance read, 25% once the primary metric holds and guardrails are clean, 50% for a few days to confirm at scale, then 100%. Each step should hold long enough to capture a full weekly cycle if traffic is seasonal. Keep the previous model routable for at least two weeks after full cutover.
Risks, edge cases, and failure modes
Silent version drift. Provider model aliases move. If you pin to a floating alias, the model underneath your control arm can change mid-test, which invalidates the comparison in a way that is nearly invisible in your dashboards. Pin to explicit dated model identifiers for every arm of every test, and log the exact identifier with each request so you can reconstruct what actually ran.
Prompt-model entanglement. Covered above as an expectation; it is also the most common source of a wrong verdict. The clean way to handle it is a two-phase test: first a portability pass where you neutralize the prompt and verify both models produce well-formed output, then the actual quality comparison. If you skip phase one you will conclude that model B is worse when you have actually measured that your prompt is model-A-shaped.

Judge contamination. Do not use a model from the same family as one of your variants as the judge. The bias toward self-similar outputs is well documented and will quietly tilt your result. If you must, use a third-party model as judge, or use two judges from different families and only trust results where they agree.
Multi-turn contamination. In a conversational product, a session that starts on one model and switches mid-thread produces incoherent context. Sticky assignment fixes assignment, but you also need to handle the case where a variant is killed mid-session — either drain existing sessions on the old model or accept a documented switch point.
Novelty and staleness effects. Users adapt. A more verbose model may score better in week one because it feels thorough, then worse in week three because it feels bloated. If your metric moves and then reverts within the test window, you are watching adaptation, not quality. This is why the seven-day floor exists.

Guardrail blindness. A model that improves your primary metric while doubling refusal rate on a sensitive category is not a winner. Instrument refusals, safety-filter triggers, and format failures as first-class guardrails with hard thresholds that auto-kill the variant, not as charts someone reviews at the end.
Cost blowups during the test. Running two or three models plus a judge model multiplies your inference spend for the test duration. A judge call on every request can cost more than the requests themselves if you judge with a frontier model. Sample the judge — score 10–20% of requests, not all of them — and set a hard spend cap on the experiment.
Traffic imbalance from failures. If one variant errors more and your fallback logic silently retries against the control model, the control arm absorbs the hard requests and looks better than it is. Log fallbacks explicitly and attribute them to the originating variant, or exclude fallen-back requests from both arms.

Weak outcome attribution. The most valuable metric — did this change revenue, retention, or resolution rate — is also the one with the longest lag and the most confounders. Instrument the join from request to outcome before you start the test, not after, or you will finish with quality data and no ability to say whether it mattered commercially.
Small-sample overreaction. The first fifty requests will show a dramatic difference in one direction. It means nothing. Establish the stopping rule in writing before the test starts and hold to it.
A practical rollout plan
Week zero — build the seam. Before any test, put a routing layer between your application and the providers. It needs three properties: one internal request/response shape that all models are adapted into, a variant tag on every log line, and the ability to change allocation without a deploy. Feature-flag services already do the allocation and stickiness well; you can also implement it with a hash of the user ID against a config value. Do not skip the unified envelope — if each provider's raw response shape leaks into your application, every future model swap is a code change instead of a config change.
Week zero — establish the offline baseline. Assemble a golden set of 100–300 real production requests, stratified across your actual traffic mix rather than cherry-picked hard cases, with human-written or human-approved reference answers. Run every candidate model against it. This is cheap, takes hours not weeks, and eliminates obviously unsuitable candidates before they touch a user. It also gives you the calibration set for your judge.

Week one — shadow mode. Send a copy of production traffic to the candidate model without serving its output to anyone. You get real-distribution quality data, real latency, and real cost with zero user risk. Shadow mode is where you catch format failures, timeout behavior, and rate-limit ceilings. Note it doubles your inference cost for its duration, so shadow a sample rather than all traffic.
Week two — 5% live. Turn on sticky assignment for a small slice. Watch guardrails hourly for the first day, then daily. Set auto-kill thresholds: error rate above a fixed multiple of control, p99 latency above an absolute ceiling, cost per request above a budget line. The point of 5% is that a bad model is a small, reversible incident.
Weeks two through three — accumulate to significance. Do not peek and decide. Let the pre-computed sample size fill, or use a sequential method that is valid under continuous monitoring. While waiting, run your weekly human-labeled calibration sample against the judge.

Week three — ramp or kill. If the primary metric moved and guardrails held, ramp to 25%, then 50%. If it did not, write down what you learned and kill it. A negative result that saves you from a bad migration is a successful test.
Week four — cut over and keep the escape hatch. Move to 100%, keep the old model routable behind a flag for at least two weeks, and keep logging the model identifier. Then write the whole thing down: which model, which prompt version, what the deltas were, what date. When the next model ships in eight weeks, that document is what lets you re-run the comparison in a day instead of a month.
The adjacent workflows are worth wiring in while you are here. The same routing seam supports cost-based routing — cheap model first, escalate to the expensive one only when a confidence check fails — which frequently delivers a larger cost reduction than picking the cheaper model outright. It supports canary deploys of prompt changes using the identical machinery. And on RAG routes, remember that retrieval quality dominates generation quality: if your retriever is returning the wrong passages, no amount of model swapping fixes it, and an A/B test between two models on a broken retriever will show no difference for the entirely uninteresting reason that both are working from the same bad context.
Related questions
Should I A/B test the model or the prompt first?
Prompt first, almost always. Prompt changes are free, fast, and often produce larger quality swings than a model upgrade. Establish a strong prompt on your current model, then test whether a different model beats it — otherwise you are comparing a tuned prompt against an untuned one.
Can I run a model A/B test without a feature-flag platform?
Yes. Hash a stable user ID modulo 100 and compare against a threshold stored in config. That gives deterministic, sticky assignment with no vendor. You lose the audit trail and instant kill switch a flag platform provides, so add explicit logging and a config value you can change without a deploy.
How do I compare a fine-tuned small model against a frontier model?
Same harness, different expectation. Judge it on your narrow task only, and weigh the cost delta heavily — a fine-tuned small model that reaches most of the frontier model's quality on one specific task at a fraction of the cost is usually the correct production choice, even at a measurable quality loss.
What if my traffic is too low for statistical significance?
Widen the effect size you care about, pool similar routes into one test, extend the window, or decide on cost and latency instead — both are measurable at low volume. Alternatively, lean harder on an offline golden set with human labels, where 200 careful comparisons beat 200 noisy production requests.
Do I need a separate test for streaming versus non-streaming routes?
Usually yes for latency, no for quality. Time-to-first-token behaves very differently from total completion time across models, and streaming routes live or die on the former. Quality findings generally transfer between the two, since the underlying generation is the same.
FAQ
How much production traffic should each variant get?
Start at 5% per variant against a 90% control. That is enough to accumulate meaningful data on a moderately trafficked route within days while capping blast radius if the variant misbehaves. Ramp to 25% once guardrails hold clean for a few days, then 50%, then full. If your traffic is genuinely low, a 50/50 split is defensible because the alternative is never reaching significance — just accept the larger risk exposure and watch guardrails more closely.
Should the judge model be the same model as one of the variants?
No. Judges show a measurable preference for outputs that resemble their own generation style, which biases the result toward whichever variant shares its family. Use a model from a third family as judge, or run two judges from different families and only act on results where both agree. Calibrate whichever judge you use against a few hundred human labels before trusting it.
What is the difference between shadow mode and a true A/B test?
Shadow mode sends a copy of real traffic to the candidate model but discards its output — nobody sees it. That gives you quality, latency, and cost data at zero user risk, but no behavioral signal, since users never react to the candidate's answers. A true A/B test serves the candidate's output to a real slice of users, which is the only way to measure downstream effects like task completion, retention, or revenue.
How do I stop a bad variant automatically?
Define numeric kill thresholds before launch and wire them to the allocation config: error rate above a fixed multiple of control, p99 latency above an absolute ceiling, cost per request above budget, or any safety-filter trigger. The kill path must be a config change, not a deploy — if reverting requires shipping code, your rollback time is measured in hours instead of seconds.
How often should I re-run these tests?
Whenever a provider ships a new model version on a route you care about, and at minimum quarterly. Model quality, pricing, and latency all move independently, and a verdict from six months ago is a historical artifact. This is why the routing seam and the golden set matter more than any individual test result — they turn a re-test from a project into an afternoon.
Can the same harness test other things besides models?
Yes, and it should. The identical machinery — sticky assignment, variant tagging, guardrails, significance testing — works for prompt versions, temperature settings, retrieval configurations, chunk sizes, and system-prompt structure. Building it once for a model comparison and then reusing it for prompt canaries is the highest-leverage version of this work.
Sources
- Anthropic — Claude Documentation
- Anthropic — Reduce Latency Guide
- OpenAI — Evals and Production Best Practices
- Google Cloud — Vertex AI Generative AI Evaluation
- Microsoft Azure — Evaluation of Generative AI Applications
- LangSmith — Evaluation Documentation
- MLflow — LLM Evaluation
- Evan Miller — Sample Size Calculator
- Evan Miller — How Not To Run An A/B Test
- Optimizely — Stats Engine and Sequential Testing
Related on PULSE
This page will be disappearing soon. Save it to your device for $1 — or read it free while it is here.
@Kory-White- · if Venmo asks, the last 4 of my number are 2012
This page is gone.
This one is off the shelf now. $1 keeps it on your phone for good — the whole page, pictures and diagrams included.
 pulse-ai-infrastructureThe 10 Best AI Tools for Negotiation Prep in 2027
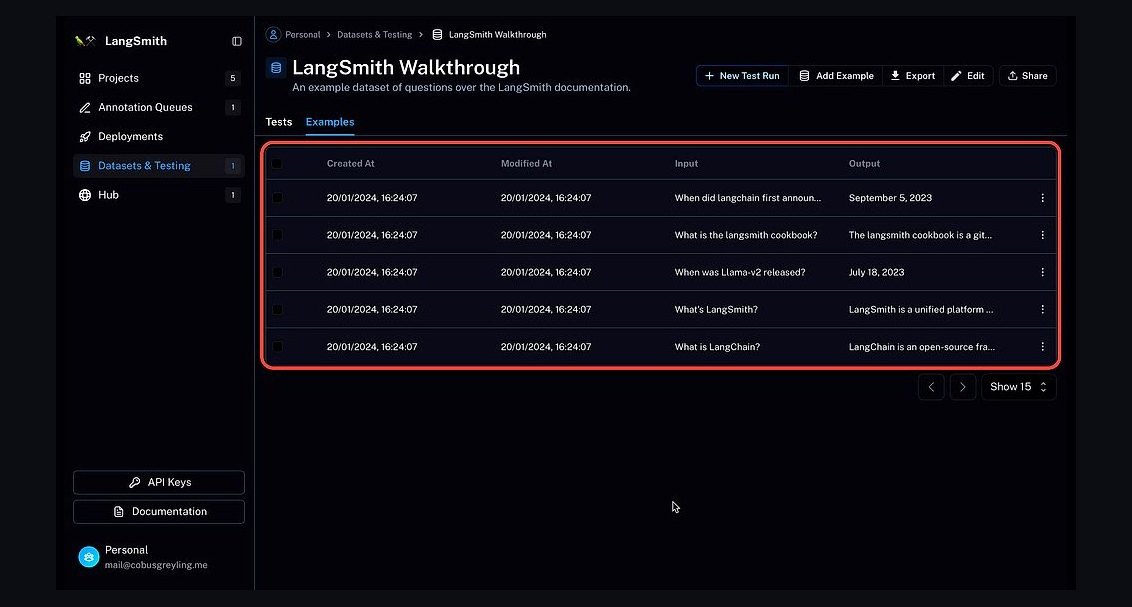 pulse-ai-infrastructureThe 10 Best AI Observability Tools for RAG Pipelines in 2027
 pulse-ai-infrastructureThe 10 Best AI Tools for Drupal Development in 2027
 pulse-ai-infrastructureThe 10 Best AI Tools for Language Learning in 2027
 pulse-ai-infrastructureThe 10 Best AI Tools for Color Grading in 2027
 pulse-ai-infrastructureThe 10 Best AI Tools for Home Organization in 2027
 pulse-ai-infrastructureThe 10 Best AI Tools for Vocal Removal in 2027
 pulse-ai-infrastructureThe 10 Best AI Tools for Brand Naming in 2027
 pulse-ai-infrastructureThe 10 Best AI Tools for Public Speaking Practice in 2027
 pulse-ai-infrastructureThe 10 Best AI Tools for Vocabulary Building in 2027