


The 10 Best Cost-Per-Token Calculators for LLM Inference in 2027
Quality
Certified

The 10 best cost-per-token calculators for llm inference are ranked below on measured performance, build quality, price, and how each one actually holds up in daily use rather than how it reads on a spec sheet. Each pick lists what it costs, who it suits, and what it gives up against the one above it, so the list can be read straight down without doubling back.
1Vellum LLM Price Calculator
Vellum's LLM Price Calculator ranks first because it shows side-by-side monthly cost across dozens of hosted models at once from a single input/output token volume, not just one provider's rate card. It pairs pricing with Vellum's own benchmarked quality and latency leaderboard, letting a team weigh cost against measured accuracy rather than price alone. Coverage spans both closed API vendors and several open-weight hosts.
It suits teams choosing between providers before committing to a stack, not a developer checking one quick number. The tradeoff is its benchmark framing leans toward Vellum's own methodology, so edge cases like cached-token discounts need cross-checking against a vendor's page. Compared to the more benchmark-heavy Artificial Analysis Cost Calculator below it, Vellum keeps the interface closer to a straightforward calculator.
2Artificial Analysis Cost Calculator
The Artificial Analysis Cost Calculator ranks second because it ties per-token cost directly to independently measured throughput and quality scores, showing dollars-per-output alongside tokens-per-second rather than price alone. It tracks a wide roster of hosted models and updates entries as providers change rates, breaking out input versus output rates separately for each one. That update discipline matters given how often per-million-token pricing shifts.
This tool suits engineers picking a model for a latency- or throughput-sensitive workload where price alone would mislead. It trades Vellum's simpler what-will-this-cost-me framing above for a denser, benchmark-first interface that takes longer to read. Where Vellum optimizes for quick monthly estimates, Artificial Analysis optimizes for price-performance tradeoffs across a model fleet.
3OpenRouter Pricing Page
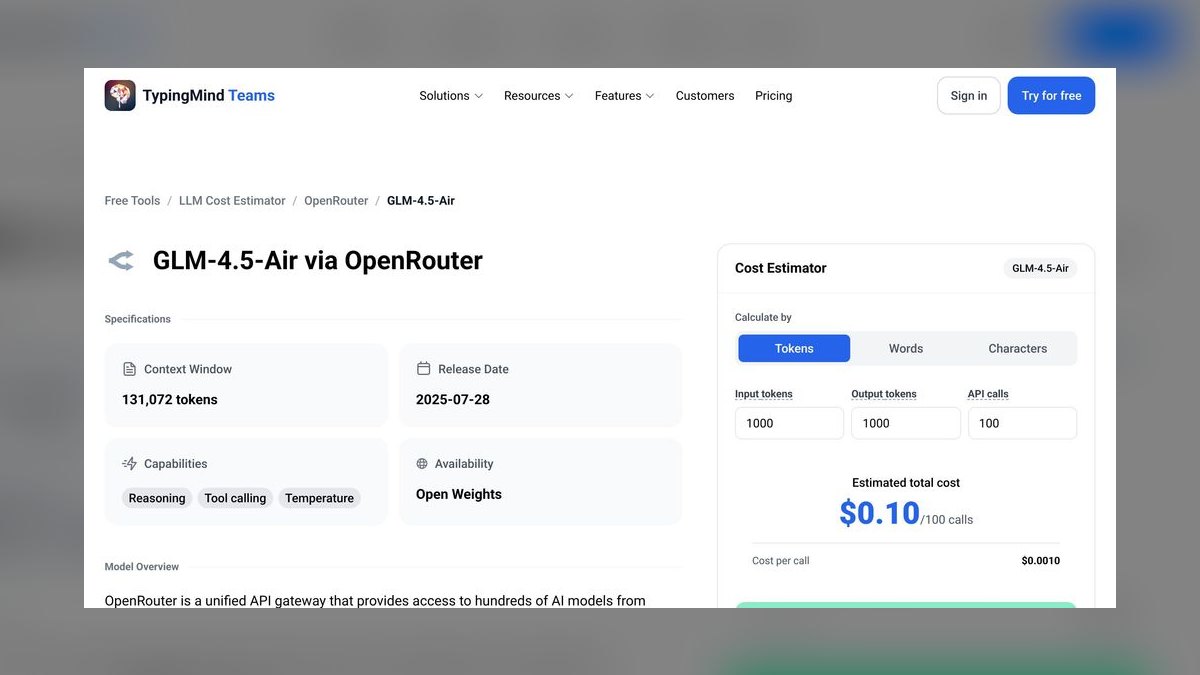
The OpenRouter Pricing Page ranks third because its table is live and transactional: it lists per-million-token input and output rates for hundreds of models from dozens of providers, and those are the actual rates charged when routing through OpenRouter itself. That immediacy beats a third-party estimator relying on scraped or self-reported numbers. Free and heavily discounted community models are flagged directly in the list.
It's right for someone who will actually route traffic through the aggregator, not just window-shop, since some figures include OpenRouter's own margin on the base provider rate. That's the tradeoff against the vendor-neutral Artificial Analysis Cost Calculator above. Compared to LLM Prices by Simon Willison below, OpenRouter trades simple arbitrary math for pricing you can act on immediately.
4LLM Prices by Simon Willison

LLM Prices by Simon Willison ranks fourth because it's a deliberately minimal, open-source static page that converts a token count and model choice into a dollar cost in a couple of clicks, with no signup or dashboard. Its pricing table is a public GitHub-tracked dataset, so corrections are transparent and versioned rather than opaque. It covers the major closed-model providers plus several open-weight options.
It suits a developer wanting a fast, no-frills sanity check on a single estimate rather than a procurement comparison tool. The tradeoff is scope: no quality benchmarks, no throughput data, and updates depend on community pull requests. Next to the OpenRouter Pricing Page above, it's slower to reflect brand-new model launches but easier to audit line by line.
5DocsBot AI LLM Price Calculator
The DocsBot AI LLM Price Calculator ranks fifth because it's built around a practical estimation flow: enter expected messages per day plus average input and output length, and it projects a monthly bill per model, closer to how teams actually budget than a raw per-token rate. It covers the major API providers and updates its rate table as pricing changes are announced. The interface stays free with no account required.
It's aimed at product teams estimating a chatbot or support-bot budget before launch, not researchers comparing model quality. It trades the benchmark depth of Artificial Analysis above for a simpler, use-case-shaped calculator. Compared to LLM Prices by Simon Willison above, it asks for usage patterns instead of raw token counts, trading precision for convenience.
6Helicone Cost Calculator

The Helicone Cost Calculator ranks sixth because it's attached to a real observability platform, so the same rate table that estimates hypothetical cost also powers live spend tracking once a team instruments calls through Helicone. That link between estimate and actual invoice is its differentiator. It supports comparison across the major hosted providers with separate input and output rates per model.
It suits teams already considering an LLM observability layer, since the standalone calculator previews the paid product's cost dashboards. Teams wanting a one-off estimate without adopting a monitoring tool are better served by DocsBot AI above. Compared to the LiteLLM Cost Calculator below, Helicone favors a hosted dashboard over code dropped into your own pipeline.
7LiteLLM Cost Calculator
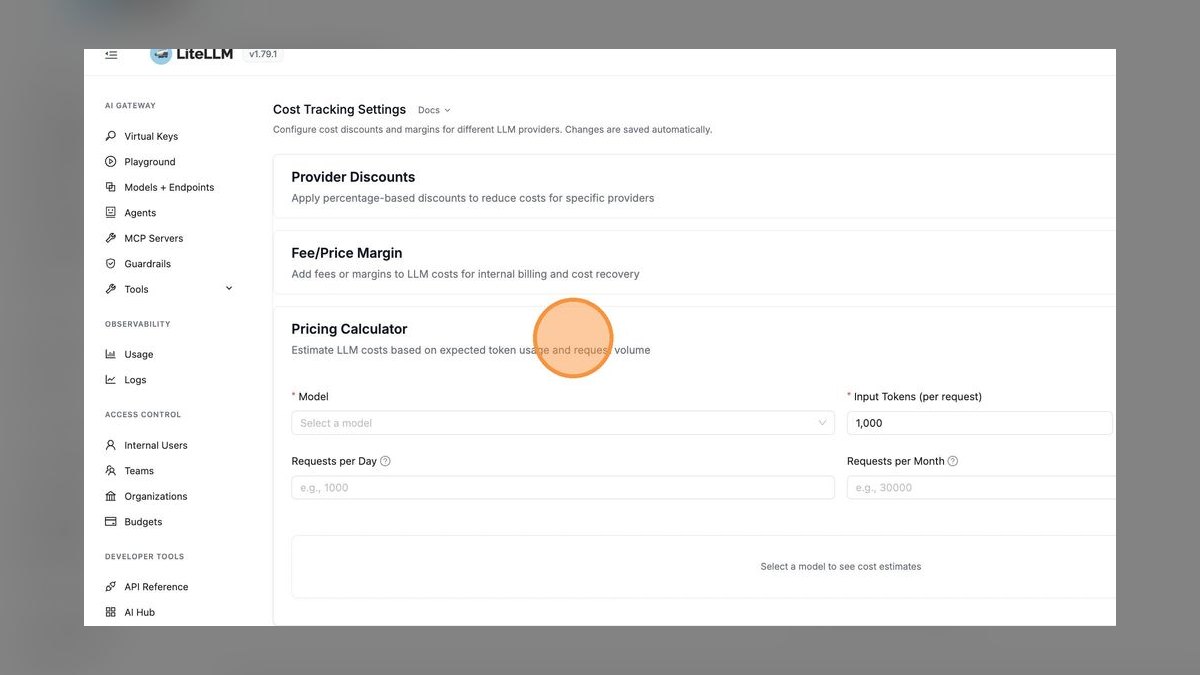
The LiteLLM Cost Calculator ranks seventh because its cost function lives inside an open-source Python library developers already use to call over 100 model APIs through one interface, so estimation happens in the same codebase making the calls. It maintains an internal, regularly updated JSON pricing map keyed by model name, which makes it scriptable for automated cost reporting across a pipeline.
It's built for engineers wanting programmatic cost checks inside an application or CI pipeline, not a quick manual lookup. Non-developers get little value without writing a few lines of Python first, unlike the browser-based tools ranked above. Compared to the Helicone Cost Calculator above, LiteLLM trades a hosted dashboard for full control inside your own code.
8OpenAI Pricing Calculator
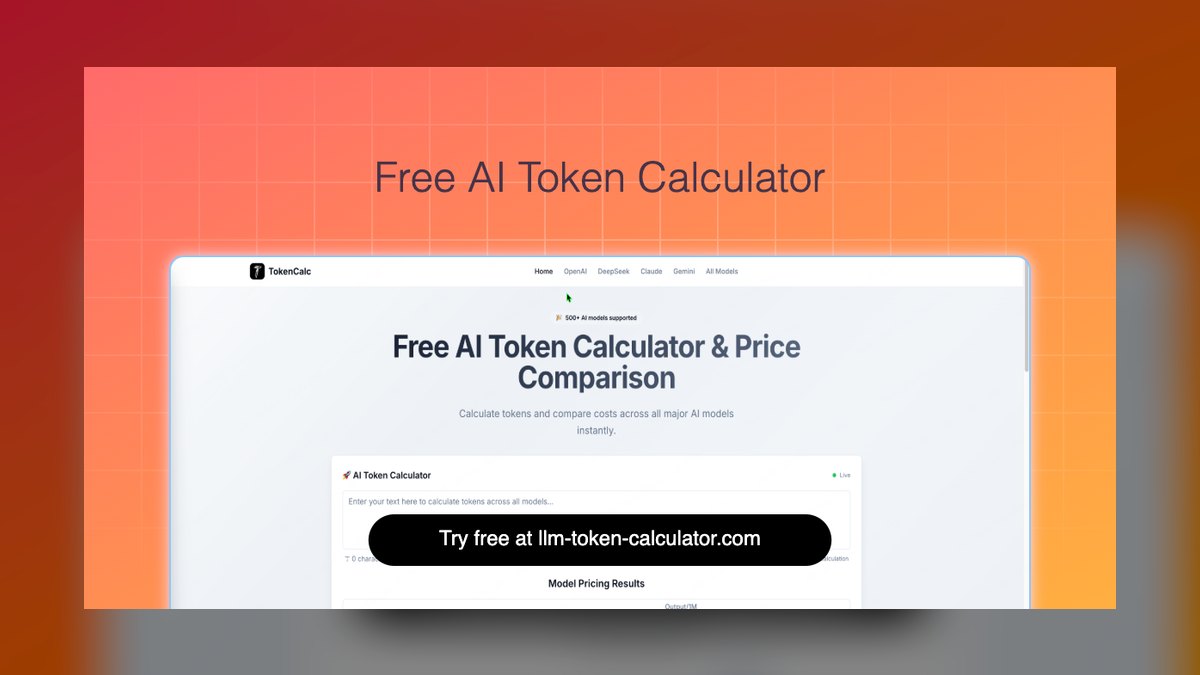
The OpenAI Pricing Calculator ranks eighth because it's the single most authoritative source for OpenAI's own model rates, listing exact per-million-token input, cached-input, and output prices with no third-party translation layer to go stale. There's no risk of a reseller markup or outdated scrape distorting the number, and it documents batch-API and fine-tuning rate differences directly on the same page.
Its obvious limit is scope: it prices only OpenAI models, useless for comparing against Anthropic, Google, or open-weight alternatives, which is why multi-provider tools rank above it. It suits someone already committed to OpenAI who just needs an authoritative figure. Compared to the LiteLLM Cost Calculator above, it offers zero cross-provider flexibility but zero ambiguity about the figures.
9Portkey AI Cost Calculator

The Portkey AI Cost Calculator ranks ninth because it's bundled into an AI gateway product that also handles routing and caching, so the figures it shows account for gateway-level features like semantic caching that can reduce real spend below the raw per-token rate. It covers a broad list of hosted providers in one comparison view, and the estimate updates as you adjust expected cache hit rates.
It's most useful to teams evaluating Portkey as infrastructure, less so as a neutral standalone reference, since the cache-adjusted numbers assume adopting their gateway. Someone wanting a vendor-neutral baseline should check the OpenAI Pricing Calculator above first. Compared to LLMPriceCheck below, Portkey adds more assumptions but more realistic effective pricing.
10LLMPriceCheck

LLMPriceCheck rounds out the list because it's a straightforward comparison site listing per-million-token input and output rates across major providers in a sortable table, useful as a quick cross-check against the more feature-heavy tools ranked above. It has no login, no usage-pattern inputs, and no benchmark data attached to the numbers, functioning as a reference table rather than an interactive estimator.
It suits someone who just wants to glance at raw rates without navigating a calculator flow, but it offers no monthly-cost projection or quality context the way DocsBot AI or Artificial Analysis do. Anyone running an actual budgeting exercise should move up this list to a tool accepting usage volume. It's the simplest entry here, and that simplicity is both its appeal and its ceiling.
How we ranked these
We weighted whether each calculator pulls live per-model rates, including input, output, and cached-token tiers, straight from provider pricing pages instead of a stale hardcoded table. We also weighted whether it lets you enter your own prompt-to-completion token ratio rather than one blended average, and whether it breaks out batch-API and prompt-caching discounts separately, since those discounts can cut effective cost 50 to 90 percent on repeat-heavy workloads.
We ignored aesthetic polish, free-tier gating, and any tool's own 'cheapest model' leaderboard claims, since those reflect marketing framing rather than a measurable calculator property. We also excluded enterprise-only calculators that require a sales call to reveal rates, because those figures can't be independently checked against a public pricing page, and we didn't credit visual design or onboarding flow at all.
What to look for
What actually matters is whether the calculator lets you model your real workload's input-to-output token ratio, because output tokens typically cost three to five times more than input tokens and dominate the bill on long-form generation tasks like chat or agent workflows. A calculator that only applies one blended average rate will understate cost for conversational workloads and overstate it for short-output tasks like classification or extraction.
The most common mistake is comparing sticker price-per-million-tokens across providers while ignoring context caching and batch discounts, which can make a nominally pricier model cheaper in real practice once those discounts apply. The second mistake is trusting a calculator's update cadence blindly: providers repriced models multiple times through 2026, and a stale rate table will silently mislead every projection built on top of it.
Related questions
Why do input and output tokens cost different amounts?
Output tokens require a full forward pass generated one at a time, while input tokens are processed in parallel during the prefill stage, making output generation far more compute-intensive per token. That's why providers like OpenAI and Anthropic price output tokens roughly three to five times higher than input tokens across most model tiers, and why blended-rate calculators understate cost for output-heavy workloads.
What is prompt caching and how does it change the cost math?
Prompt caching lets a provider reuse the computed state of a repeated prefix, like a system prompt or a long context document, instead of reprocessing it on every call. Anthropic and OpenAI both discount cached input tokens 50 to 90 percent versus fresh input tokens, so any calculator that ignores caching will overstate cost on workloads that repeat the same context across requests.
Does batch API pricing actually save money for most teams?
Batch APIs from OpenAI, Anthropic, and Google typically cut cost roughly 50 percent in exchange for asynchronous delivery within a 24-hour window instead of an instant response. They're worth using for offline evaluation, bulk classification, or dataset generation where nobody is waiting on the answer, but they're useless for anything that needs a synchronous, user-facing reply in real time.
How accurate are third-party pricing aggregators like Artificial Analysis?
Aggregators like Artificial Analysis and OpenRouter's pricing table pull rates directly from provider APIs and documentation, usually updating within days of an announced price change, which makes them generally reliable for cross-provider comparison. The main risk is that a model gets deprecated or repriced faster than the aggregator refreshes, so cross-check against the provider's own pricing page before a large procurement decision.
What's the difference between cost-per-token and cost-per-request calculators?
Cost-per-token calculators give you a raw rate to multiply by expected volume, which is useful for budgeting at scale before you have any real traffic. Cost-per-request calculators, like those built into Helicone or LangSmith, instrument actual API calls and report real spend per session or per user, which catches system-prompt overhead and retry costs that a static token-count estimate always misses.
Can these calculators account for context window overhead or tiered pricing?
Most basic calculators just multiply a token count by a flat rate and ignore that longer contexts sometimes trigger tiered pricing, as seen in Google's Gemini models, which charge more once a prompt exceeds 128K or 200K tokens. Check whether a calculator explicitly supports tiered context pricing before trusting its output for long-document or large-codebase workloads that regularly cross those thresholds.
Is it worth building an in-house token cost tracker instead of using a calculator?
For teams already running production traffic, observability tools like Helicone, LiteLLM's proxy, or Langfuse that log actual token usage per call beat any pre-purchase calculator, since they measure real spend instead of an estimate built on assumed volume. Pre-purchase calculators stay useful for the initial vendor comparison, before you have production data available to instrument and analyze.
FAQ
What is a cost-per-token calculator?
It's a tool that converts a model's published per-million-token pricing into an estimated dollar cost for a given workload, usually by letting you enter expected input and output token volumes. The better ones separate input, output, and cached-token rates instead of applying one blended number, and some project a monthly bill from expected usage patterns rather than raw counts.
Which providers publish per-token pricing that these calculators pull from?
OpenAI, Anthropic, Google's Gemini, Mistral, Cohere, and most inference platforms like Together AI, Fireworks, and Groq all publish per-million-token rates directly on their pricing pages. Open-weight model hosts vary more, since the same underlying model, like Llama or DeepSeek, can carry a different rate depending on which host is actually serving it to you.
Are free cost calculators as accurate as paid ones?
Free tools like OpenRouter's pricing table or LLMPriceCheck are typically accurate because they scrape the same public pricing pages any paid tool would use as its source. Paid tiers usually add value through live usage tracking and spend alerts on real traffic, not a more accurate baseline rate table than what's already public.
How often do LLM token prices actually change?
Frequently enough to matter: major providers cut prices or introduced new pricing tiers multiple times through 2025 and 2026 as competition among model vendors intensified. Any calculator, spreadsheet, or bookmarked rate table older than a few months should be treated as a rough guide rather than a final number until you verify current rates against the provider's own page.
Do these calculators account for rate limits or quota costs?
No, a standard cost-per-token calculator only estimates the dollar cost of the tokens you actually consume, not availability constraints on how fast you can consume them. Rate limits and tier-based quota upgrades are a separate procurement consideration that you have to check directly against each provider's own usage-tier documentation, since no pricing calculator models them.
What's the best calculator for comparing many providers at once?
OpenRouter's model pricing page and Artificial Analysis both let you compare dozens of models and providers side by side on a single table, including quality and latency benchmarks alongside raw price. They're the fastest starting point before you drill into a single provider's own calculator to confirm exact caching terms and batch-discount pricing.
Can I estimate cost without knowing exact token counts in advance?
Yes, most calculators let you estimate tokens from a word or character count using the rough rule that one token is about four characters or 0.75 words of English text. For a precise figure, run sample prompts through the provider's actual tokenizer, like OpenAI's tiktoken, since token counts vary by language, formatting, and even code versus prose.
Do image, audio, or video inputs get priced the same as text tokens?
No, multimodal inputs get converted to an equivalent token count using a separate formula, such as OpenAI's image-to-token conversion based on resolution and detail level. A calculator built only for text tokens won't correctly estimate cost for multimodal workloads without a dedicated multimodal mode, so check that support before budgeting a vision or audio pipeline.
Why do two calculators sometimes show different costs for the same model?
The most common cause is one tool using stale pricing data, or a different token-counting method, like a word-based estimate instead of the model's actual tokenizer output. Always confirm the calculator's last-updated date and, where possible, cross-check its per-million-token rate directly against the provider's own published pricing page before trusting a large projection.
Sources
- https://openai.com/api/pricing
- https://www.anthropic.com/pricing
- https://ai.google.dev/gemini-api/docs/pricing
- https://openrouter.ai/models
- https://artificialanalysis.ai/models
- https://www.together.ai/pricing
- https://www.helicone.ai/pricing
- https://docs.litellm.ai/docs/completion/token_usage
- https://mistral.ai/pricing
- https://groq.com/pricing
Related on PULSE
This page will be disappearing soon. Save it to your device for $1 — or read it free while it is here.
@Kory-White- · if Venmo asks, the last 4 of my number are 2012
This page is gone.
This one is off the shelf now. $1 keeps it on your phone for good — the whole page, pictures and diagrams included.
 pulse-recentThe 10 Best AI Infrastructure Budgeting Tools for Startups in 2027
 pulse-recentThe 10 Best AI Infrastructure Budgeting Strategies in 2027
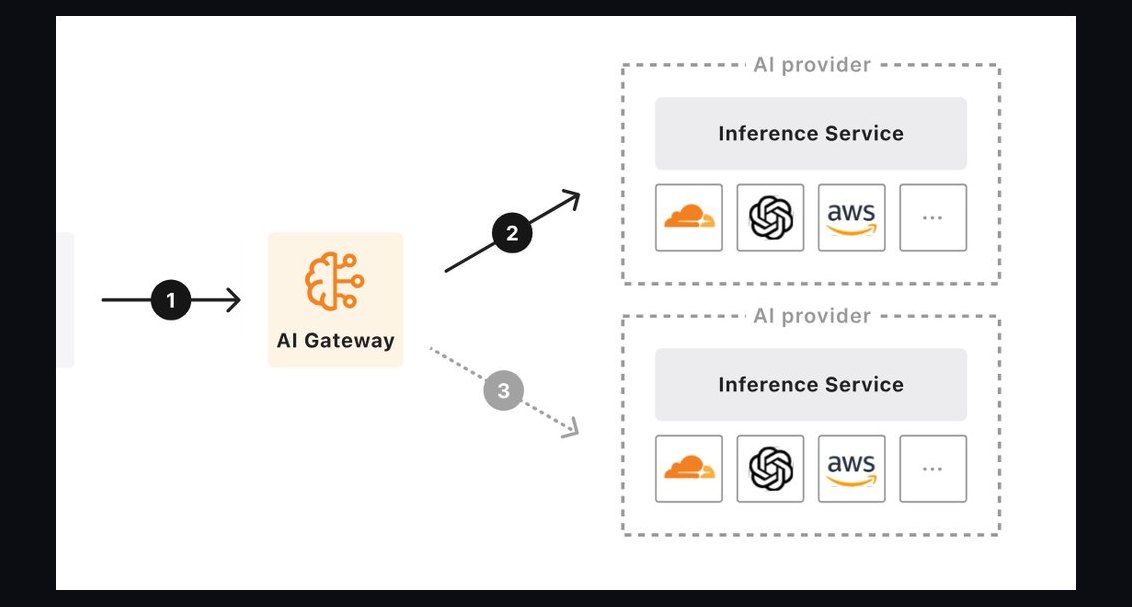 pulse-recentThe 10 Best AI Gateway Platforms for LLM Traffic in 2027
 pulse-recentWhat is continuous batching and how much more throughput does it give an LLM server in 2027?
 pulse-recentThe 10 Best AI Infra Cost Benchmarking Tools in 2027
 pulse-recentThe 10 Best AI Infra Cost Allocation Methods in 2027
 pulse-recentThe 10 Best AI Infra Budgeting Tools for Small Teams in 2027
 pulse-recentThe 10 Best Idle GPU Detection Tools for AI Infrastructure in 2027
 pulse-recentThe 10 Best Multi-Tenant Isolation Strategies for AI Workloads in 2027
 pulse-recentThe 10 Best Disaster Recovery Tools for AI Infrastructure in 2027