


Top 10 Sales KPIs for Marine Antifouling & Hull Coatings Services in 2027
Quality
Certified
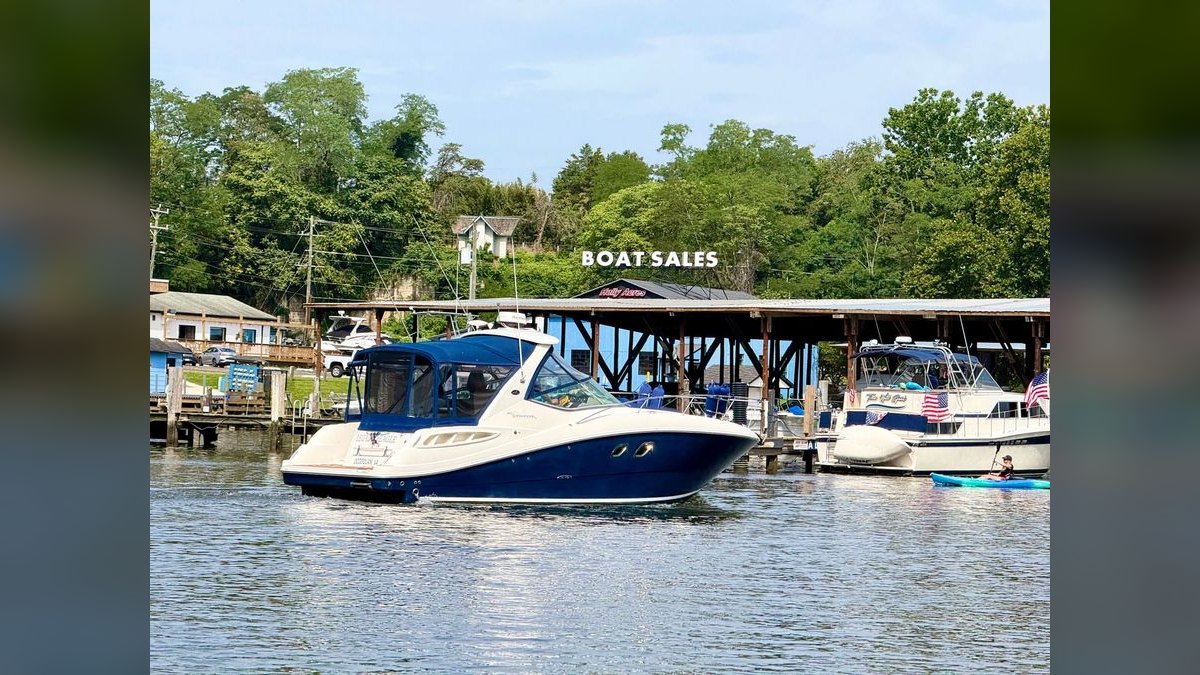
The key sales KPIs for the Marine Antifouling & Hull Coatings Services industry in 2027 are Haul-Out Slot Utilization, Revenue per Haul-Out Day, Recurring Maintenance-Plan Revenue, Repeat Vessel Booking Rate, Quote-to-Booking Conversion Rate, Average Job Cycle Time, Coating Material Cost Ratio, Advance Booking Coverage, and Commercial and Yacht Revenue Mix. These nine metrics together measure how effectively a yard converts its limited physical capacity—haul-out slots and weather windows—into recurring, profitable revenue. Tracking them as an integrated set allows leaders to forecast accurately, optimize pricing, and grow profitably despite the industry's inherent seasonality and capacity constraints.
The Marine Antifouling & Hull Coatings Services industry operates on a fundamentally different revenue model than most service businesses. Revenue is not driven by unlimited demand but by the hard physical constraint of yard slots, lift cradles, and weather-suitable coating days. A vessel must be hauled out of the water, prepared, coated, and cured before it can return, meaning each slot can only process one vessel at a time. Demand is recurring and predictable at the vessel level—antifouling coatings degrade on a known cycle of 12 to 36 months—but it concentrates into pre-season windows that overwhelm capacity if booking is not managed proactively. The nine KPIs below are designed to capture each lever of that equation, from capacity utilization to customer loyalty, and to give you a dashboard that predicts revenue health rather than just reporting it.
Why Haul-Out Slot Utilization Is the Most Critical KPI for Marine Coating Yards
Haul-Out Slot Utilization tracks the percentage of available yard slots and lift cradle days that are filled with revenue jobs. This is the single most important metric because slots are the hard capacity ceiling of the business—idle slots in peak season are unrecoverable lost revenue that no amount of marketing can recoup later. A single empty cradle on a Saturday in April can cost you thousands of dollars in lost revenue, and if utilization dips below 70% during the spring haul-out window, you are leaving significant money on the table. The 2027 benchmark target is 80–92% slot utilization through the haul-out season, with anything above 95% signaling that pricing is too low and you are leaving margin on the table.
To calculate this KPI, divide the number of slot-days filled with revenue jobs by the total available slot-days for the period. A slot-day is one cradle or dry-dock position occupied for one day. If you have three cradles operating six days a week during a 12-week spring season, you have 216 available slot-days. If you fill 180 of them, your utilization is 83%. The key is to track this weekly during the season, not just at the end, so you can adjust pricing or marketing spend immediately when coverage dips below the target threshold. Leading yards also track utilization by day of week to identify patterns—Saturdays often fill first, while midweek slots may need discounting to avoid going empty. For more on structuring your sales process around capacity optimization, see our guide on sales KPIs for commercial painting and coatings contracting.

How Revenue per Haul-Out Day Reveals Pricing and Job Scoping Efficiency
Revenue per Haul-Out Day normalizes revenue by the scarce resource—slot time—and shows whether jobs are scoped and priced to the full value of a limited slot. A 30-foot sailboat paying $2,000 over three days generates $667 per day, while a 60-foot sportfisher paying $8,000 over four days generates $2,000 per day. The latter is clearly a better use of the slot, and tracking this metric helps you prioritize higher-value work and optimize job scoping to minimize days in the slot. The 2027 benchmark target is $1,400–$5,000 per haul-out day, depending on the recreational vs. commercial mix.
To improve this KPI, focus on three levers: upselling premium coating tiers, adding ancillary services like prop polishing or zinc replacement, and reducing cycle time through better scheduling. Yards that consistently hit the high end of this range typically offer detailed coating recommendations with transparent pricing, train their sales teams to upsell during the quoting process, and use pre-application inspections to catch hull damage or old coating adhesion issues before the vessel hits the slot. Tracking this KPI by vessel type also reveals which segments are most profitable per slot-day, enabling you to target marketing efforts accordingly.
The Role of Recurring Maintenance-Plan Revenue in Stabilizing Cash Flow
Recurring Maintenance-Plan Revenue tracks the share of revenue from vessels on scheduled multi-year antifouling and coating service plans. This KPI is a leading indicator of business stability because maintenance plans convert a one-time job into a predictable recurring cycle and lock the vessel out of competitor yards. A vessel on a three-year plan is essentially off the market for rival yards, creating a moat that compounds over time. The 2027 benchmark target is 40–55% of revenue from recurring maintenance plans, with yards below 30% being too dependent on one-off walk-in business and suffering severe revenue volatility during economic downturns or weather disruptions.
To build recurring maintenance revenue, start by offering tiered service plans that align with coating durability. A standard plan might include annual inspection and touch-up for smaller vessels, while a premium plan covers full re-coating every 24 months with a discount on materials. Use your CRM to track plan expiration dates and trigger automated renewal reminders 90 days before the next coating cycle is due. Yards that actively market maintenance plans to existing customers see repeat vessel booking rates climb by 15–25% within the first year, as the plan creates a contractual obligation that reduces the chance of the vessel going to a competitor. This metric also smooths cash flow by shifting revenue from lump-sum seasonal spikes to predictable monthly or quarterly payments.

This diagram illustrates the vicious cycle that occurs when Advance Booking Coverage is low. Idle slots lead to low utilization, which forces yards to discount pricing to fill remaining slots, lowering revenue per day. Discounted pricing attracts price-sensitive customers who are less likely to convert quotes to bookings or sign maintenance plans, further reducing repeat rates and driving up acquisition costs. The result is a downward spiral that can take years to reverse. Breaking this cycle requires starting with proactive booking management—opening booking windows early and using incentives to secure deposits before the season begins.
How Advance Booking Coverage Prevents Seasonal Revenue Spikes and Slumps
Advance Booking Coverage tracks the share of next season's peak haul-out slots already reserved with deposits. This KPI smooths the seasonal spike and prevents both turn-aways and idle slots. Yards that wait until spring to fill their calendars are gambling on weather and walk-in demand—and often lose. The 2027 benchmark target is 50–65% of peak-season slots reserved 60–90 days ahead, with leading yards achieving this by opening booking windows in January for the spring season and offering incentives like discounts on material costs for deposits received before February 1.
To track this effectively, configure your CRM to calculate coverage automatically from deposit dates and slot availability. Set an alert that fires when coverage drops below 40% for any given month, triggering a flash promotion or targeted email campaign to past customers. The goal is to have enough booked work to plan labor and material purchases confidently, without over-discounting and leaving margin on the table. For more on building a CRM that supports this kind of proactive booking management, see our guide on sales KPIs for marine fuel dock and bunkering services.
The Interplay Between Quote-to-Booking Conversion Rate and Average Job Cycle Time
Quote-to-Booking Conversion Rate tracks the percentage of coating estimates that convert into a confirmed, deposit-secured haul-out booking. Average Job Cycle Time tracks the average elapsed days a vessel occupies a slot from haul-out to splash. These two KPIs are deeply connected: a low conversion rate often means your cycle time is too long, making your quotes less competitive than yards that can turn vessels faster. The 2027 benchmark for conversion rate is 45–60%, while cycle time should be 2–3 days for standard biocidal antifouling and 4–6 days for advanced foul-release coatings.
To improve both metrics simultaneously, focus on the quoting process itself. Provide detailed coating recommendations with transparent pricing, include a clear timeline for the job, and follow up within 48 hours of quote delivery. On the operations side, reduce cycle time by pre-scheduling weather windows using marine forecasts, implementing a preventive maintenance program for blasting and spraying equipment, and investing in pre-application inspection to catch hull damage before the vessel hits the slot. Even a one-day reduction in cycle time can increase annual throughput by 20–30% in a busy yard, which directly boosts both conversion rate and revenue per haul-out day.
How to Build a KPI Dashboard That Actually Drives Decisions

You do not need a specialized analytics platform to manage these nine KPIs—a well-configured CRM and a disciplined monthly review will do the job. Start by building the right fields and stages so the data is captured at the source rather than reconstructed later. Configure custom fields for each KPI input so every deal and account carries the raw numbers—values, dates, volumes, and cost figures—needed to calculate the metric without manual hunting. For example, add fields for "Vessel LOA (length overall)," "Coating Tier," "Haul-Out Start Date," "Splash Date," and "Material Cost" to every opportunity record.
Map your pipeline stages to the real revenue motion of the business so conversion-rate and cycle-time KPIs calculate automatically from stage history. Typical stages might include: Inquiry Received → On-Site Inspection Completed → Quote Delivered → Deposit Received → Haul-Out Scheduled → Job In Progress → Billed → Closed. Each stage timestamp feeds the cycle time calculation. Build a single KPI dashboard with all nine metrics visible at once, each against its benchmark target, so the team sees the full picture rather than one number at a time. Use color coding: green for on target, yellow for within 10% of target, red for more than 10% off.
Set automated alerts for the leading indicators—coverage ratios, utilization, turnaround, and reject or defect rates—so a metric drifting out of band triggers action before it shows up in revenue. For example, if Advance Booking Coverage drops below 40% on March 1, the system should ping the sales manager to launch a flash promotion. Finally, run a fixed monthly KPI review where the team reads every metric against target, names the cause of any miss, and assigns a specific owner and corrective action. The review should take no more than 30 minutes—if it runs longer, your dashboard is too complex.
The Hidden Lever: Commercial and Yacht Revenue Mix
Commercial and Yacht Revenue Mix tracks the share of revenue from commercial vessels and large yachts versus recreational hulls. This KPI is often overlooked but has a massive impact on profitability because larger vessels carry higher per-job value and longer recurring cycles. A yard that shifts from 70% recreational to 50% commercial/yacht will see average revenue per slot nearly double without any change in capacity. The 2027 benchmark target is 35–50% of revenue from commercial and yacht work, with yards below 20% being vulnerable to seasonal swings in recreational boating.
To shift the mix, actively pursue commercial fleet contracts and superyacht referrals. Commercial vessels operate on 24–36 month coating cycles and are less price-sensitive than recreational boat owners because downtime is a direct cost to their business. Superyacht clients, while requiring more bespoke specifications and longer sales cycles, often pay 2–3 times more per job and are more likely to sign multi-year maintenance plans. Track this KPI monthly and set a specific target for the number of commercial or yacht quotes issued each quarter. For more on structuring your sales team to target these higher-value segments, see our guide on sales KPIs for marine yacht detailing and brightwork restoration.

This diagram visualizes how different vessel segments contribute to overall revenue per slot-day. Recreational hulls generate lower revenue and are more volatile, while commercial vessels and superyachts offer higher value and more predictable demand. The optimal mix depends on your yard's location, infrastructure, and expertise, but the goal is always to increase the share of higher-value segments without overextending your capacity to serve them. A yard that can handle both recreational and commercial work effectively will have a natural hedge against seasonal fluctuations in either segment.
The Impact of Coating Material Cost Ratio on Job Profitability
Coating Material Cost Ratio tracks the total cost of antifouling paint, primer, blast media, and specialized application tools divided by the total revenue from that job. This KPI is critical because material costs can vary dramatically between job types—a standard biocidal antifouling job may have a material cost ratio of 20–25%, while a premium foul-release coating job with specialized primers can exceed 35% if not priced correctly. The 2027 benchmark target is 20–30% for standard jobs and 30–40% for advanced coating systems, with the key being to track this ratio by coating tier rather than as a blended average.
To manage this ratio effectively, negotiate bulk pricing with coating manufacturers based on your annual volume commitments, and standardize job scoping to minimize waste. Use your CRM to flag any job where the material cost ratio exceeds 40% for standard coatings or 50% for premium coatings, triggering a review of both the pricing and the material usage. Leading yards also track material cost ratio by vessel type to identify which segments are eating into margins—a high ratio on small recreational hulls often indicates that the pricing structure does not account for minimum material purchase requirements.
Related questions
What are the key sales KPIs for the Commercial Industrial Coatings industry in 2027?
The key sales KPIs include Contract Win Rate, Average Job Value, Recurring Maintenance Contract Revenue, and Safety Incident Rate. These metrics focus on large-scale, project-based work with multi-year contracts and strict safety compliance requirements.
What are the key sales KPIs for the Commercial Painting & Coatings Contracting industry in 2027?
Key sales KPIs include Bid-to-Award Ratio, Average Project Size, Customer Retention Rate, and Labor Efficiency Ratio. These metrics emphasize competitive bidding, project profitability, and maintaining a steady pipeline of commercial contracts.
What are the key sales KPIs for the Marine Sail & Rigging Loft Services industry in 2027?

Key sales KPIs include Custom Rigging Project Value, Sail Repair Turnaround Time, Recurring Maintenance Plan Revenue, and Customer Referral Rate. These metrics focus on specialized craftsmanship, quick turnaround for repairs, and building long-term relationships with yacht owners.
What are the key sales KPIs for the Marine Fuel Dock & Bunkering Services industry in 2027?
Key sales KPIs include Fuel Volume per Customer, Customer Visit Frequency, On-Time Delivery Rate, and Average Margin per Gallon. These metrics emphasize volume-based revenue, operational reliability, and margin management in a commodity-driven market.
What are the key sales KPIs for the Specialty Marine Engine & Propulsion Distribution industry in 2027?
Key sales KPIs include Parts Availability Rate, Average Order Value, Service Contract Attachment Rate, and Customer Lifetime Value. These metrics focus on inventory management, upselling service contracts, and maximizing long-term customer relationships.
FAQ
What exactly is Haul-Out Slot Utilization and why does it matter? It measures the percentage of available dry-dock or haul-out slots that are filled with paying jobs. In a yard-slot-constrained business, this KPI directly shows whether you're maximizing your most limited asset. A healthy range is typically 80–92% during peak season, but anything above 95% often means you're turning away profitable work. Below 70% suggests you have excess capacity or poor booking management, both of which eat into margins.
How is Revenue per Haul-Out Day calculated, and what's a realistic target? You divide total revenue from a haul-out by the number of days the vessel occupies the slot. This tells you how efficiently you're monetizing each day of yard time. A reasonable 2027 benchmark is between $1,400 and $5,000 per day depending on the recreational vs. commercial mix. The key is to compare your number against the cost per slot-day to ensure you're covering costs and generating profit.
Why is Recurring Maintenance-Plan Revenue considered a leading KPI? It tracks the portion of revenue tied to multi-year or annual coating service agreements, not one-off jobs. High recurring revenue—ideally 40–55% of total—signals stable, predictable cash flow and strong customer retention. Without it, you're entirely dependent on seasonal haul-out demand. A yard with 45% recurring revenue can weather a bad weather season much better than one at 15%.
What does the Repeat Vessel Booking Rate tell you about customer loyalty? It measures the percentage of vessels that return for another haul-out or coating service within a 12- to 24-month cycle. A rate above 65% suggests your service quality and pricing are competitive. Lower rates may indicate dissatisfaction or that competitors are capturing your customers. Segment this rate by vessel type to identify specific problems with your commercial or recreational service offering.

How does Quote-to-Booking Conversion Rate differ from a typical sales metric? It specifically tracks the percentage of formal quotes that turn into booked haul-out slots, not just leads or inquiries. In this industry, a conversion rate of 45–60% is common, because many quotes are for future seasons or are price-comparison checks. Monitoring this helps you spot pricing or communication issues early. If your conversion rate drops from 55% to 40% in a month, something changed.
What is Advance Booking Coverage and how far out should you look? It measures the percentage of available slots already booked for a future period—typically 60 to 90 days ahead. In 2027, a healthy coverage rate is 50–65% for the next 60 days, giving you confidence to plan labor and material purchases. Below 40% may indicate weak demand or overly aggressive pricing. Leading yards track this daily during the booking season.
How do you calculate Coating Material Cost Ratio accurately across different job types? You divide the total cost of antifouling paint, primer, blast media, and any specialized application tools by the total revenue from that job. For accuracy, track material costs at the job level rather than using averages. The ratio should be calculated separately by coating tier to avoid masking problems—a high ratio on standard jobs is a bigger concern than the same ratio on premium jobs.
What is the best way to improve Average Job Cycle Time without sacrificing quality? Focus on the three biggest time-wasters: weather delays, equipment breakdowns, and rework. Pre-schedule weather windows using marine forecasts, implement a preventive maintenance program for blasting and spraying equipment, and invest in pre-application inspection to catch hull damage before the vessel hits the slot. Even a one-day reduction in cycle time can increase annual throughput by 20–30%.
How does Commercial and Yacht Revenue Mix affect profitability? It tracks the share of revenue from commercial vessels and large yachts versus recreational hulls. Larger vessels carry higher per-job value and longer recurring cycles. A yard that shifts from 70% recreational to 50% commercial/yacht will see average revenue per slot nearly double. Target 35–50% of revenue from commercial and yacht work to stabilize revenue and improve margins.
What is a realistic Coating Material Cost Ratio for premium foul-release coatings? For advanced foul-release coating systems with specialized primers, a material cost ratio of 30–40% is typical. This is higher than the 20–25% range for standard biocidal antifouling, but the higher revenue per job often offsets the increased material cost. Track this ratio by coating tier to ensure you are pricing premium jobs with adequate margin.
Sources
- International Marine Coatings Association (IMCA)
- Society of Naval Architects and Marine Engineers (SNAME)
- International Maritime Organization (IMO)
- Marine Industry News
- National Marine Manufacturers Association (NMMA)
- American Boat & Yacht Council (ABYC)
- Frost & Sullivan - Marine Coatings Market Research
- The World Bank - Shipping and Maritime Sector Data
Related on PULSE
- What are the key sales KPIs for the Marine Sail & Rigging Loft Services industry in 2027?
- What are the key sales KPIs for the Marine Fuel Dock & Bunkering Services industry in 2027?
- What are the key sales KPIs for the Commercial Building Envelope Air-Barrier Inspection Services industry in 2027?
- What are the key sales KPIs for the Trade Show and Exhibit Services industry in 2027?
- What are the key sales KPIs for the Telehealth Platform Services industry in 2027?
- What are the key sales KPIs for the Commercial Janitorial and Cleaning Services industry in 2027?
This page will be disappearing soon. Save it to your device for $1 — or read it free while it is here.
@Kory-White- · if Venmo asks, the last 4 of my number are 2012
This page is gone.
This one is off the shelf now. $1 keeps it on your phone for good — the whole page, pictures and diagrams included.
 pulse-industry-kpisTop 10 Sales KPIs for Commercial Paving Contracting in 2027
 pulse-industry-kpisTop 10 Sales KPIs for Commercial Insulation Contracting in 2027
 pulse-industry-kpisTop 10 Sales KPIs for Clinical Trial Site Network in 2027
 pulse-industry-kpisTop 10 Sales KPIs for AI Sales Coaching / Conversation Intelligence in 2027
 pulse-industry-kpisTop 10 Sales KPIs for Commercial Industrial Coatings in 2027
 pulse-industry-kpisTop 10 Sales KPIs for Commercial RV Dealership in 2027
 pulse-industry-kpisTop 10 Sales KPIs for Marine Sail & Rigging Loft Services in 2027
 pulse-industry-kpisTop 10 Sales KPIs for Architectural Door & Hardware Distribution in 2027
 pulse-industry-kpisTop 10 KPIs for Florists in 2027
 pulse-industry-kpisTop 10 Sales KPIs for Industrial Crane & Hoist Manufacturing in 2027