
5 Stages of the Buyer’s Journey — Infographic
 Curated byKory White · Fractional CRO · Maryland
 PULSEKNOWLEDGE LIBRARY
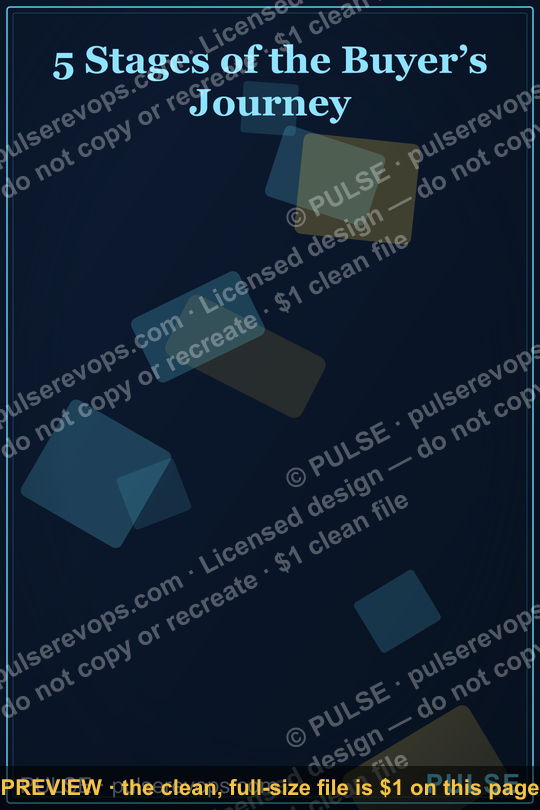
The buyer’s journey typically progresses through five stages: Awareness, Consideration, Decision, Purchase, and Post-Purchase. In the Awareness stage, the buyer realizes they have a problem; in Consideration, they define the problem and research options. The Decision stage involves evaluating specific solutions, followed by the Purchase, and finally Post-Purchase, where the buyer assesses their experience. This infographic visually maps each stage to help marketers align content with buyer intent.
5 Stages of the Buyer’s Journey — Infographic
A numbered portrait infographic — 5 Stages of the Buyer’s Journey — covering Awareness, Consideration, Decision, Onboarding, and more. Drop it into onboarding decks or a sales-process explainer for reps and buyers.
Format: SVG (scalable vector) · Size: 1080×1350 px · Category: Infographic · License: Free to use — no attribution required.

Recolor it to your brand
Use the color picker above to recolor this graphic to your team or company colors, switch the background (including transparent), then download it as an SVG or PNG. No sign-up, no watermark.
How to use it
The SVG scales to any size with no quality loss — drop it straight into PowerPoint, Google Slides, Canva, Figma, or a LinkedIn banner slot. The PNG export is ready to upload anywhere that wants a raster image.
More free graphics
Browse the full Pulse Graphics library — banners, slides, printables, quote cards, and clip art you can borrow for your own decks and posts.
Related on PULSE
- B2B Buyer Journey Map
- The Customer Journey — Infographic
- 5 Stages of a Healthy Pipeline — Infographic
- SaaS Sales Cycle Stages
- Sales Funnel — 7 Stages
- Sales Funnel — 5 Stages
How Each Stage Maps to Your Sales Funnel Metrics
Understanding the buyer’s journey isn’t just about theory—it’s about knowing which metrics to track at each stage so you can optimize your funnel. Here’s how the five stages connect to measurable outcomes that revenue teams actually care about.
Stage 1: Awareness — During this phase, prospects first realize they have a problem or opportunity. The key metric here is *reach* and *top-of-funnel engagement*. Track impressions, unique visitors to educational content (blog posts, videos, infographics), and cost per lead (CPL). A healthy awareness stage typically sees 60–70% of total funnel volume, but conversion rates hover around 2–5% depending on your industry. For B2B SaaS, a good benchmark is 3–5% of awareness-stage contacts moving to the next stage within 30 days.
Stage 2: Consideration — Now prospects are actively researching solutions. This is where *lead scoring* becomes critical. Track time-on-page for comparison content, downloads of whitepapers or case studies, and demo request rates. Consideration-stage conversion rates typically range from 10–20% for well-qualified leads. The average B2B buyer consumes 3–5 pieces of content during this phase before engaging with sales. Your marketing qualified leads (MQLs) should come primarily from this stage—aim for 15–25% of awareness-stage contacts to become MQLs.
Stage 3: Decision — Prospects are evaluating specific vendors. Here, sales qualified leads (SQLs) and pipeline velocity matter most. Track demo-to-close rates (typically 20–30% for enterprise deals, 30–40% for SMB), average deal size, and sales cycle length. A healthy decision stage sees 40–60% of SQLs moving to negotiation. If your close rate drops below 20%, revisit your qualification criteria or sales enablement materials.
Stage 4: Purchase — The final commitment. Track win rate, average contract value (ACV), and time-to-close. For B2B, average win rates range from 20–30% across industries, with top performers hitting 40%+. The purchase stage should represent 5–10% of your total funnel volume but 100% of revenue.
Stage 5: Retention & Advocacy — Post-purchase, measure customer lifetime value (LTV), churn rate, and net promoter score (NPS). A 5–10% monthly churn rate is typical for SaaS, while enterprise churn should be under 2% annually. Advocacy metrics include referral rates (aim for 10–15% of customers referring within 12 months) and upsell/cross-sell revenue (15–25% of existing customer base annually).
Funnel health check: If your awareness-to-consideration conversion drops below 2%, your messaging or targeting is off. If consideration-to-decision falls under 10%, your sales team may be pursuing unqualified leads. Regularly audit these stage-specific metrics monthly, not quarterly, to catch issues early.
Common Mistakes That Kill Buyer Journey Alignment
Even with a clear infographic, many teams sabotage their own efforts. Here are the most frequent pitfalls and how to avoid them.
Mistake #1: Treating all stages the same — The biggest error is using identical messaging across awareness, consideration, and decision. In awareness, prospects want education, not pitches. Yet 68% of B2B marketers admit they lead with product features too early. Fix: Create separate content buckets for each stage—blog posts and social media for awareness, comparison guides and webinars for consideration, case studies and demos for decision.
Mistake #2: Ignoring the silent stages — Buyers don’t announce when they move from awareness to consideration. They might read three blog posts, then download a whitepaper without ever clicking a CTA. If you only track form fills, you miss 40–60% of buying signals. Fix: Use intent data tools (like lead scoring based on page visits, time-on-page, and content topic clusters) to detect stage transitions without requiring explicit action.
Mistake #3: Overloading the decision stage — Some sales teams try to compress the entire journey into one call. They pitch features, share pricing, and ask for commitment—all in the first conversation. This fails because decision-stage buyers need validation, not pressure. Fix: Structure sales calls to mirror the buyer’s journey—first 10 minutes for discovery (awareness), next 15 for solution alignment (consideration), last 10 for proof points (decision). Never skip stages.
Mistake #4: Forgetting the post-purchase journey — The buyer’s journey doesn’t end at purchase. Yet 44% of companies have no formal onboarding process for new customers. This leads to early churn (30% of SaaS churn happens in the first 90 days). Fix: Map a “customer journey” that extends 6–12 months post-purchase, with milestones for onboarding, first value realization, and advocacy triggers.
Mistake #5: Relying on assumptions instead of data — Many teams build buyer journey maps based on what they *think* customers do, not what they actually do. This results in misaligned content and wasted budget. Fix: Conduct quarterly buyer journey audits using CRM data, website analytics, and customer interviews. Look for unexpected drop-off points—if 70% of leads disappear after the first demo, your demo content might be too salesy.
Mistake #6: Neglecting mobile and multi-device behavior — Over 60% of B2B buyers use mobile devices during the awareness and consideration stages, but only 30% of companies optimize content for mobile. If your infographic or content doesn’t render well on phones, you’re losing prospects. Fix: Test all content on mobile devices, use responsive design, and consider short-form video for mobile-first consumption.
Mistake #7: Failing to align sales and marketing — When marketing creates content for awareness but sales only cares about decision-stage leads, the handoff breaks. This misalignment costs B2B companies 10–20% of revenue annually. Fix: Hold monthly alignment meetings where both teams review stage-specific metrics, agree on lead definitions, and co-create content for the consideration stage—the most critical handoff point.
Practical Tactics to Optimize Each Stage Right Now
You don’t need a complete overhaul. Here are actionable, low-cost tactics you can implement this week to improve each stage of the buyer’s journey.
Awareness Stage Tactics:
- Create a “problem identifier” quiz — A 5-question interactive quiz that helps prospects name their pain point. Tools like Typeform or Interact cost $30–$100/month. Quizzes typically see 30–50% completion rates and generate 2–3x more leads than static content.
- Launch a “pain point of the week” social series — On LinkedIn or Twitter, post one short video (60–90 seconds) each week describing a common industry problem. Use no product mentions. Track engagement—aim for 5–10% engagement rate on organic posts.
- Guest post on 2–3 industry blogs — Focus on publications your target audience reads. One well-placed guest post can drive 500–2,000 targeted visitors per month, costing only your time.
Consideration Stage Tactics:
- Build a comparison matrix — Create a simple table comparing your solution to 3–5 alternatives, focusing on features, pricing, and use cases. Host it as a gated download. Comparison content converts 30–50% better than generic whitepapers.
- Host a “problem-solving” webinar — Invite an industry expert (not your sales team) to discuss solutions. Webinars with external speakers see 40–60% higher attendance than internal-only sessions. Promote via email to your existing list.
- Create a “decision framework” template — Offer a downloadable checklist or scorecard that prospects can use to evaluate vendors. This positions you as a trusted advisor. Templates have a 20–35% conversion rate from landing pages.
Decision Stage Tactics:
- Offer a “no-commitment” audit — Provide a free 30-minute assessment of the prospect’s current setup, with recommendations. This builds trust and reduces perceived risk. Audits close at 25–40% rates compared to 15–20% for standard demos.
- Share 2–3 “before/after” case studies — Focus on companies similar to the prospect’s size and industry. Video case studies (2–3 minutes) convert 20% better than written ones. Aim for a 10–15% click-through rate on case study emails.
- Implement a “trial with support” model — Instead of a self-serve free trial, offer a guided trial with a dedicated onboarding specialist. Guided trials see 30–50% higher conversion to paid than self-serve trials.
Purchase Stage Tactics:
- Simplify your pricing page — Remove all jargon and use three clear tiers (e.g., Basic, Pro, Enterprise). Pages with three options see 10–20% higher conversion than those with five or more.
- Add a “risk reversal” guarantee — Offer a 30-day money-back guarantee or a “no-questions-asked” cancellation policy. This can increase conversion by 15–25% for first-time buyers.
- Use social proof at checkout — Display logos of current customers, testimonials, or “X companies trust us” right on the payment page. This reduces purchase anxiety by 20–30%.
Retention Stage Tactics:
- Send a “day 7” check-in email — New customers who receive a personalized onboarding email within the first week have 40% higher 90-day retention. Use a simple template: “How’s it going? Need help with X?”
- Create a customer community — Even a private Slack group or Facebook group with 50–100 active members can reduce churn by 15–20%. Encourage peer-to-peer support and feature requests.
- Implement a “referral ask” at month 3 — Customers who are happy after 90 days are 3x more likely to refer. Send a simple email with a referral link and a modest incentive
Sources
- HubSpot — inbound marketing methodology and buyer’s journey framework
- Salesforce — B2B sales process and customer journey stages
- MarketingProfs — content marketing and buyer behavior insights
- Harvard Business Review — academic and practical research on customer decision-making
- Forrester Research — B2B buyer journey analysis and trends
- Content Marketing Institute — content strategy aligned with buyer journey stages
FAQ
What exactly are the five stages of the buyer’s journey? The five stages typically include Awareness, Consideration, Decision, Purchase, and Post-Purchase. Awareness is when a buyer realizes they have a problem, Consideration is when they research solutions, Decision is when they choose a provider, Purchase is the transaction, and Post-Purchase covers retention and advocacy.
How long does each stage usually take for a B2B buyer? Timelines vary widely depending on deal complexity and industry. Awareness might last a few days to weeks, Consideration can take several weeks to months, and Decision often spans one to three months. The entire journey from Awareness to Purchase can range from a few weeks to over a year.
Can a buyer skip stages or go backward in the journey? Yes, buyers often loop back to earlier stages if new information emerges or their needs change. For example, someone in the Decision stage might return to Consideration after discovering a better solution. The journey is rarely perfectly linear.
What content works best at the Awareness stage? Educational content like blog posts, infographics, and industry reports are effective. The goal is to help the buyer understand their problem without pushing a specific product. Avoid hard sales pitches at this stage.
How do you measure progress through the buyer’s journey? Common metrics include engagement with stage-specific content, time spent on pages, form submissions, and sales-qualified lead conversions. No single metric captures the full journey, so a combination of behavioral and demographic data is typically used.
Is the buyer’s journey the same for all industries? No, it varies significantly by industry, product complexity, and buyer persona. High-consideration purchases like enterprise software involve longer, more complex journeys, while low-cost consumer goods may have a much shorter path. Always adapt the framework to your specific audience.
This page will be disappearing soon. Save it to your device for $1 — or read it free while it is here.
@Kory-White- · if Venmo asks, the last 4 of my number are 2012
This page is gone.
This one is off the shelf now. $1 keeps it on your phone for good — the whole page, pictures and diagrams included.
 graphic5 Steps to Handle Any Objection — Infographic
 graphic4 Types of Buyers — Infographic
 graphicThe Lead Lifecycle — Infographic
 graphicThe Perfect Demo — Infographic
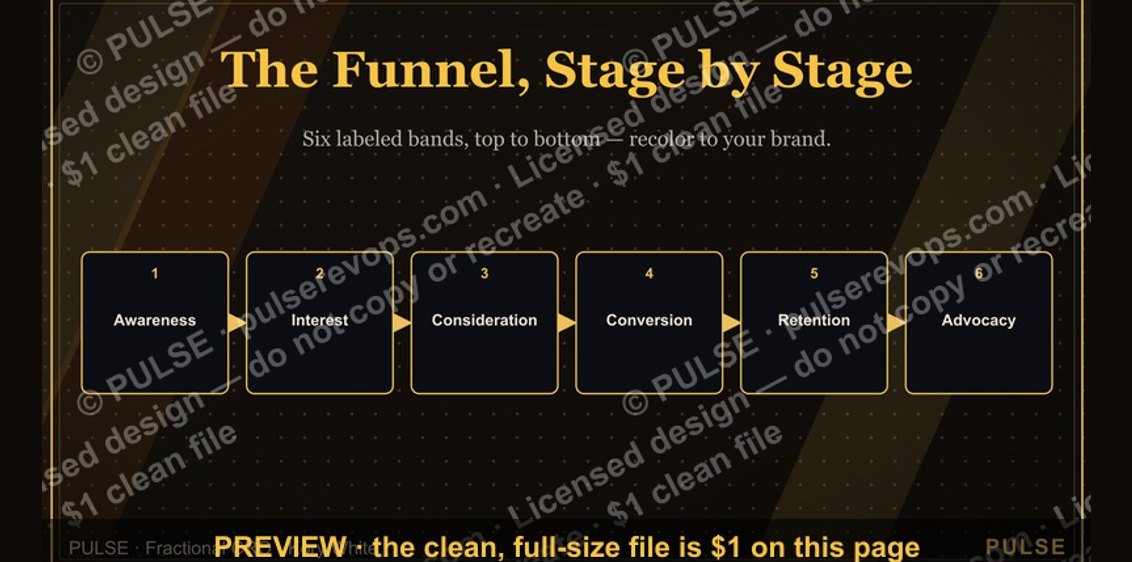 graphicThe Marketing Funnel — Infographic
 graphicThe Demand Waterfall — Infographic
 graphicThe Negotiation Checklist — Infographic
 graphicThe 30-60-90 Ramp — Infographic
 graphicSPIN Selling — Infographic
 graphicThe Sales Cycle: Lead to Closed-Won — Infographic