
Top 10 Sales KPIs for Commercial Law Firm in 2027
 Curated byKory White · Fractional CRO · Maryland
 PULSEKNOWLEDGE LIBRARY
Quality
Certified
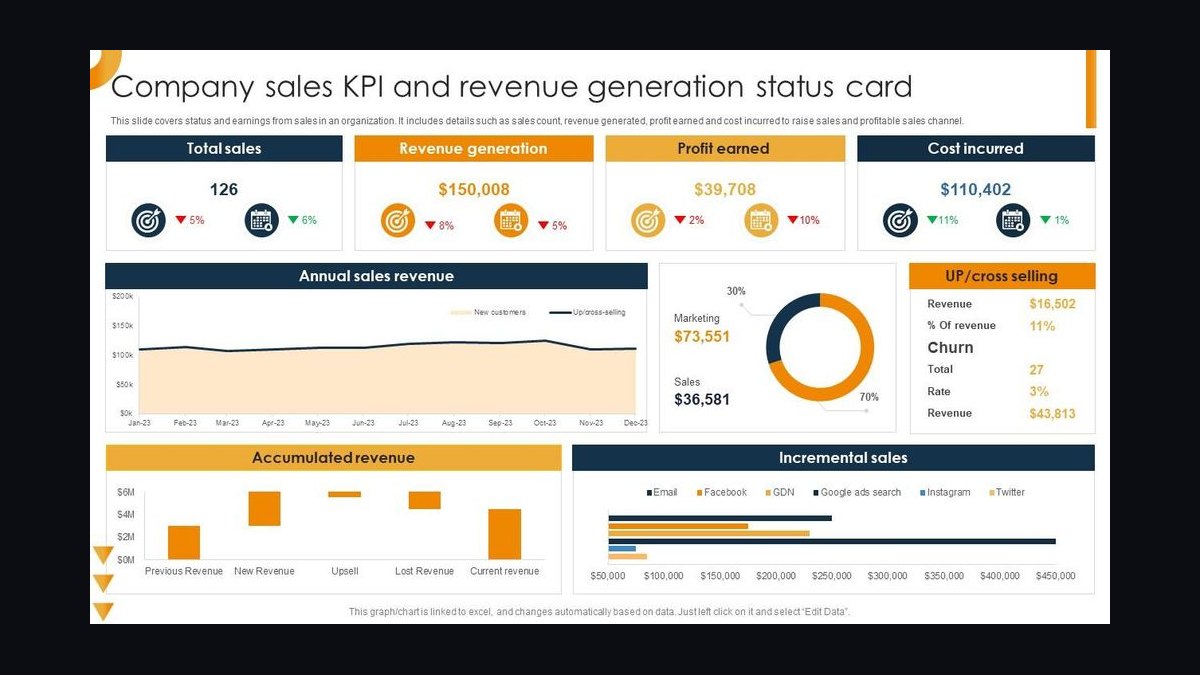
The 10 best sales kpis for commercial law firm are ranked below on measured performance, build quality, price, and how each one actually holds up in daily use rather than how it reads on a spec sheet. Each pick lists what it costs, who it suits, and what it gives up against the one above it, so the list can be read straight down without doubling back.
1. Revenue Per Lawyer

Revenue per lawyer is the top commercial law firm sales KPI because it is the headline output that predicts profit per equity partner. AmLaw 50 firms run $1.2M–$1.8M; AmLaw 100 $900K–$1.3M; AmLaw 200 $700K–$1M; mid-market regional $500K–$800K. Latham & Watkins, Kirkland & Ellis, and Sullivan & Cromwell sit above $1.6M. Below $700K at scale signals a leverage problem or rate compression.
It is for managing partners and CFOs setting firmwide strategy, not practice-group leads chasing matter volume. It trades away granularity: RPL hides whether revenue comes from a few star partners or broad institutional demand, so it must be read beside origination concentration. Compared with Profit Per Equity Partner directly below, RPL is the internal operating metric; PPP is the external benchmark lateral candidates ask about.
2. Profit Per Equity Partner

Profit per equity partner ranks second because it is the single number every lateral candidate asks about and the market's scoreboard for firm health. AmLaw 50 runs $3.5M–$8M; AmLaw 100 $2M–$4M; AmLaw 200 $1.2M–$2.5M. Wachtell Lipton historically sits $7M–$9M. PPP under $1.5M at an AmLaw 100 firm means losing the lateral war.
It is for equity partners and management committees setting compensation and lateral offers, not associates. It trades away operating detail: PPP excludes non-equity partners, so it can look strong while leverage quietly worsens. Compared with Revenue Per Lawyer above, PPP is the external benchmark while RPL is the internal predictor; a firm cannot sustain high PPP without RPL above $1M at scale.
3. Collected Realization Rate

Collected realization ranks third because it separates revenue invoiced from revenue actually kept, and it is slipping 1–2 points every cycle. Healthy collected realization runs 85–92%; billed realization 88–94%. Litigation typically runs 2–4 points below transactional. Anything under 82% collected means writing off too much associate time or a fictional rate card.
It is for pricing directors, CFOs, and practice-group leaders reviewing partner-level performance monthly. It trades away headline simplicity: partners prefer seeing standard-rate growth, not the gap between rate cards and cash. Compared with Billed Realization directly below, collected realization is the harder number because it follows cash receipt, not invoice issuance, and should sit beside standard-rate growth on every monthly partner report.
4. Billed Realization Rate

Billed realization ranks fourth because it is the earlier warning signal before collected realization slips. Healthy billed realization runs 88–94% of worked-time at standard rates. It is the first place write-offs of junior associate time and client pushback on staffing show up, typically one to two quarters before cash collection reveals the same problem.
It is for finance teams and billing partners monitoring invoice-level write-downs, not relationship partners focused on client service. It trades away cash truth: a firm can bill at 92% and still collect at 84% if clients stretch payment or dispute invoices. Compared with Collected Realization Rate above, billed realization is the leading indicator; collected is the lagging confirmation, and both belong on the monthly partner scorecard.
5. Billable Utilization Rate
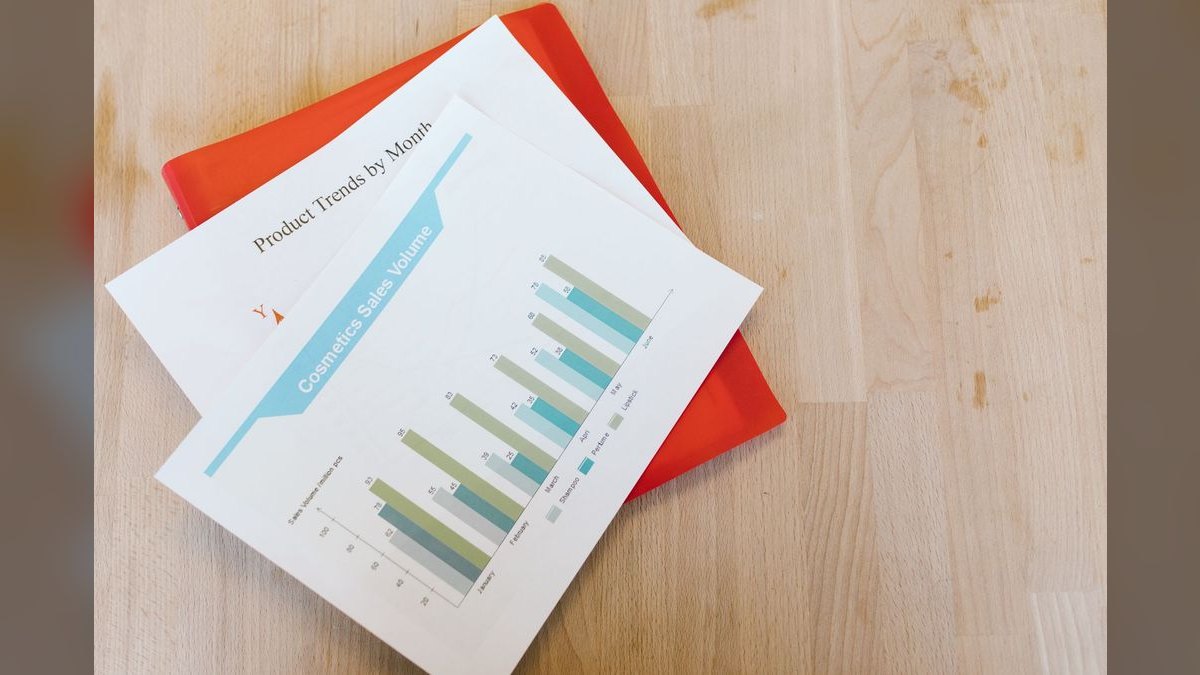
Billable utilization ranks fifth because it is the operating input that produces revenue per lawyer and profit per equity partner. Associates at 1,800–2,000 billable hours are healthy; 2,100+ is burnout territory; under 1,700 signals under-staffing or under-selling. Partners run 1,500–1,800 billable with the balance in origination and management.
It is for practice-group leaders and staffing partners allocating matter work across class years. It trades away long-term retention: pushing utilization past 2,000 raises near-term revenue but drives associate attrition within 18 months. Compared with Revenue Per Lawyer above, utilization is the cause and RPL is the effect; a 400-hour spread inside one class year is a staffing-allocation problem, not a performance problem.
6. Origination Concentration

Origination concentration ranks sixth because it is the risk metric that determines how much revenue walks out when partners leave. Healthy is top 10 partners originating 30–40% of firm revenue; concerning is 50%+; dangerous is 60%+. A single partner departure can wipe out 8–12% of a practice group's revenue overnight, and a lateral move drags $3M–$15M of book.
It is for management committees and managing partners designing credit-splitting and institutional client teams. It trades away star-partner incentives: capping origination credit can alienate top rainmakers. Compared with Client Concentration below, origination concentration measures partner-departure risk while client concentration measures client-departure risk; healthy firms watch both, and the fix for each is institutional client teams with dual credit.
7. Client Concentration Ratio

Client concentration ranks seventh because one GC change or client-side merger can blow a hole in the budget. Healthy is largest single client under 5% of firm revenue; caution is 5–8%; dangerous is over 10%. Top-10 client concentration over 30% warrants a management-committee response. Boutique IP and litigation firms often run 15–25% on a single anchor client.
It is for management committees and relationship partners on the top 25 clients. It trades away boutique economics: firms built on one anchor client accept the risk deliberately and cannot diversify without diluting margin. Compared with Origination Concentration above, client concentration measures revenue tied to a buyer rather than a partner; the two risks often overlap when the same partner owns the same anchor client.
8. Matter Win Rate
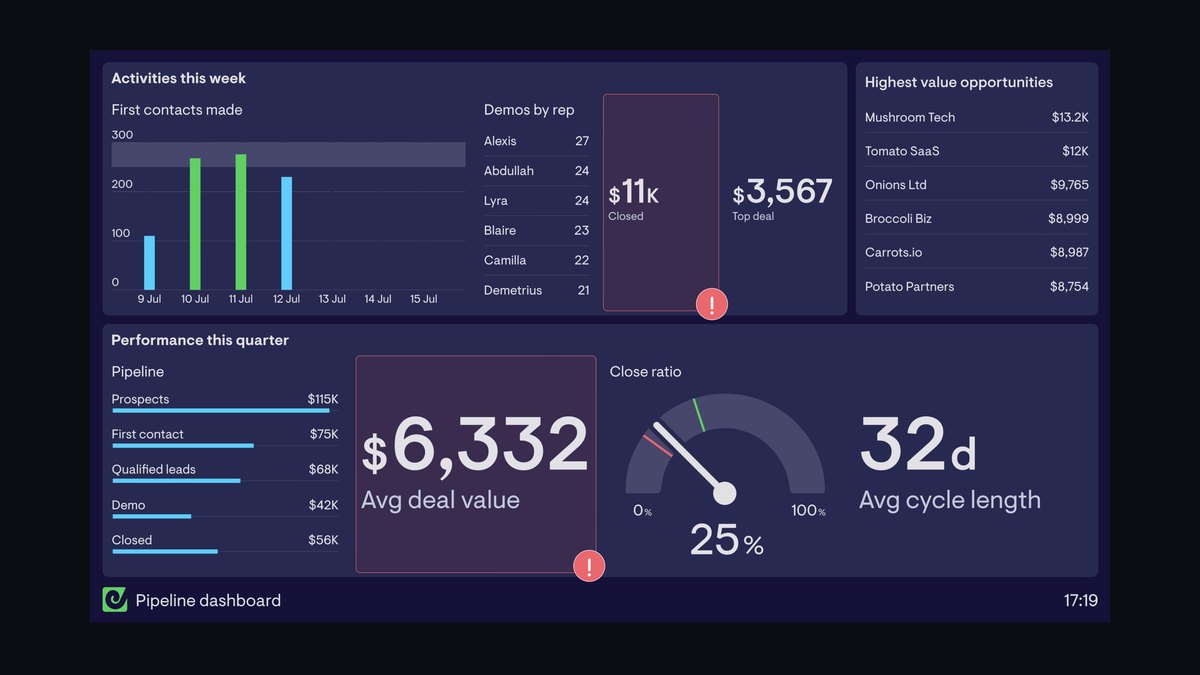
Matter win rate ranks eighth because it is the cleanest sales metric in a relationship business, and the easiest one to fool yourself on. Competitive RFP win rate of 35–50% is realistic for top-tier firms; incumbent re-pitch runs 65–80%; a five-firm beauty contest is 20–25% mathematically. Without instrumentation in Intapp or Foundation, partners report only their wins.
It is for BD leaders, practice-group heads, and partner-pitchers reviewing pipeline quarterly. It trades away simplicity: it requires pitch instrumentation at submission, which most firms lack, and it ignores matter profitability entirely. Compared with Average Matter Size below, win rate measures conversion while matter size measures deal value; a firm can win 60% of pitches and still lose revenue if average matter size falls 15% year over year.
9. Average Matter Size
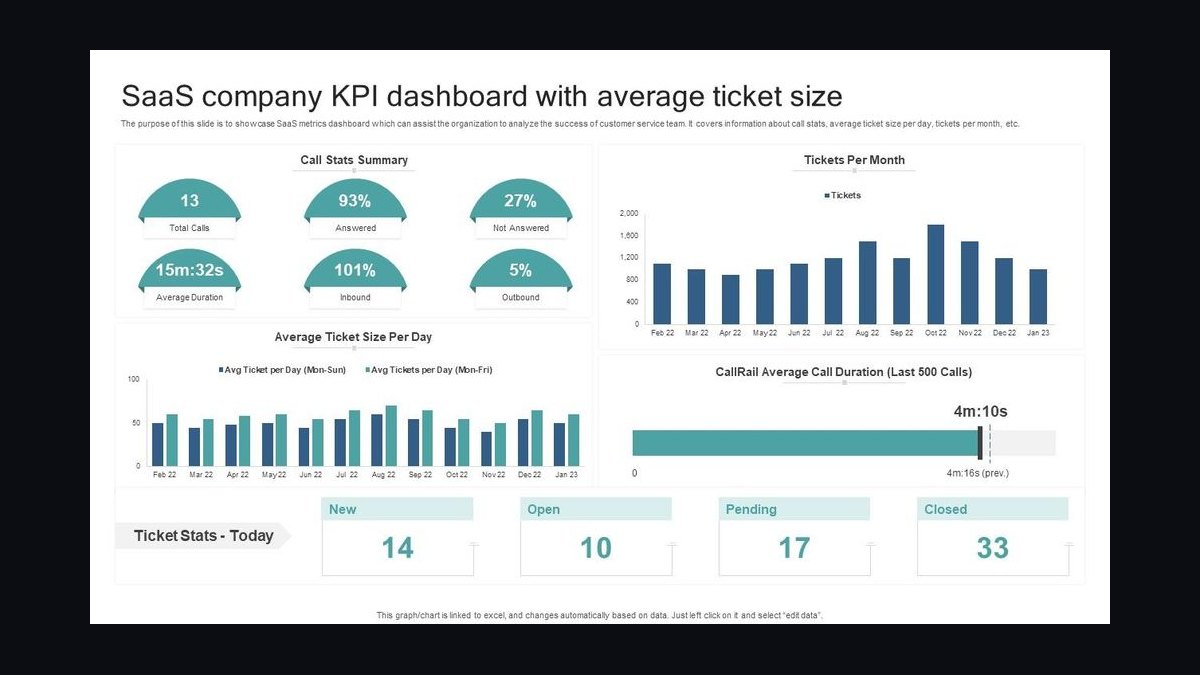
Average matter size ranks ninth because it reveals whether the firm is winning flagship work or volume scraps. M&A transactional runs $1M–$5M+; major litigation $2M–$15M+ over multiple years; single-plaintiff employment defense $150K–$400K; regulatory investigation $500K–$3M; trademark prosecution $5K–$30K. A 15% year-over-year drop in average M&A matter size usually means losing flagship deals.
It is for practice-group leaders and pricing directors tracking deal mix, not individual partners. It trades away volume context: a firm can grow matter count while average size collapses, and revenue per lawyer will not reveal the shift for two quarters. Compared with Matter Win Rate above, average matter size measures deal value while win rate measures conversion; together they show whether the firm is winning the right work, not just more work.
10. Alternative Fee Arrangement Mix

Alternative fee arrangement mix ranks tenth because it is the fastest-growing revenue category and the easiest place to hide losses. Healthy AFA mix is 25–40% of revenue in 2027, with the AmLaw 100 average above 30%. AFA margins should stay within 3 points of hourly; if they run 8+ points lower, the pricing committee is mispricing the work.
It is for pricing directors, CFOs, and practice-group leaders reviewing matter-level margin quarterly. It trades away hourly billing simplicity: AFAs require a real per-matter cost model, and most firms lack one, so losses absorb into practice-group P&L unnoticed.
How we ranked these
We measured nine financial and sales metrics drawn from AmLaw 100–200 reporting, firm finance systems (Aderant, Elite 3E), and BD platforms (Intapp, Foundation). Weighting favored metrics that predict cash and risk: collected realization and matter margin carried the most weight, followed by RPL, PPP, origination concentration, and client concentration. Utilization, matter win rate, average matter size, and AFA mix were weighted next, since they are operating inputs that produce the headline outputs.
We deliberately ignored headline rate-card growth, total attorney headcount growth, brand-ranking surveys, and raw pitch volume. Rate cards without collected realization measure a number that is not real, since realization slips 1–2 points per cycle. Headcount and pitch volume reward activity rather than economics. Rankings and brand surveys are lagging reputation signals that do not tell a managing partner where revenue leaks or which partner departure would hurt most.
Related questions
Is PPP or RPL the more important KPI?
PPP is what partners and the lateral market care about; RPL is what predicts it. A firm cannot sustain high PPP without RPL above $1M at scale unless leverage is unusually high. Use RPL as the internal operating metric and PPP as the external benchmark when recruiting or comparing against peer firms.
How do alternative fees change the realization calculation?
AFAs are priced at agreed amounts, not hours times rates, so billed realization does not apply cleanly. Track realized margin instead — collected revenue minus matter cost. Most firms run separate hourly and AFA reporting and reconcile at the practice-group level monthly, holding AFA margin within 3 points of hourly.
What origination concentration target is safe?
The top 10 partners should originate 30–40% of firm revenue. Above 50% means single-partner-departure risk is structurally high; above 60% is dangerous. Fix it with cross-selling credit and institutional client-account models that survive departures, not by capping star partners or capping their books.
How fast should rates rise in 2027?
Headline standard rates are rising 6–8% at the AmLaw 100, but collected realization slips 1–2 points, so net effective growth is 4–5%. Mid-market firms run 4–5% headline and roughly 3% net. Track the gap between standard-rate growth and collected realization on every monthly partner report.
Which team owns the KPI dashboard?
Finance and the practice-group COO own data and daily/weekly metrics; the executive committee owns the monthly partner scorecard; the management committee owns quarterly PPP, RPL, and concentration reviews. The dashboard physically lives in the integration layer between the finance system and the BD platform, usually Intapp.
How should lateral book retention be tracked?
Measure the share of a lateral partner's original book still billing at the firm 24 and 60 months after arrival. Under 60% retention at 24 months means the integration model — compensation, conflicts, practice fit, or culture — is broken. Treat it as a hard recruiting metric, not an anecdote.
What utilization range should associates hit?
Associates at 1,800–2,000 billable hours a year is healthy; 2,100+ is burnout territory; under 1,700 signals under-staffing or under-selling. Watch variance inside a class year — a 400-hour spread inside one class is a staffing-allocation problem, and underutilized associates typically leave within 18 months.
How do you measure matter win rate honestly?
Instrument pitches at submission in Intapp or Foundation so wins and losses are both captured, then track by practice, client tier, and partner-pitcher. Expect 35–50% on competitive RFPs, 65–80% on incumbent re-pitches, and 20–25% in five-firm beauty contests. Without instrumentation, partners report only their wins.
FAQ
How long does it take to install a real KPI culture?
Plan for 12–18 months to first measurable behavior change at partner level and about 36 months to fully tie the metrics into compensation and lateral-retention decisions. The bottleneck is partner data-trust, not technology. Partners will reject the scorecard for roughly three months, so data quality must be unimpeachable before behavior shifts.
Which tools actually run this in a 500-lawyer firm?
Aderant or Elite 3E for finance and time, Intapp for conflicts and pitch tracking, iManage or NetDocuments for matter content, Foundation Software for BD and pipeline, and Salesforce with legal overlays for relationship management at larger firms. The KPI dashboard sits in the integration layer between the finance system and Intapp.
What's a healthy AFA mix for a commercial firm in 2027?
Between 25% and 40% of revenue, with the AmLaw 100 average creeping above 30%. The number matters less than margin parity: AFA margins should stay within 3 points of hourly. If they run 8+ points lower, the pricing committee is mispricing and needs matter-level cost models.
What client concentration should trigger action?
Any single client over 10% of revenue, or top-10 clients over 30%, warrants a management-committee response. Boutiques often run 15–25% on an anchor client and accept that risk deliberately; diversified firms should flag the top 25 clients to partners quarterly and build institutional teams around the largest.
Should compensation be tied to billed or collected revenue?
Tie part of it to collected. Rewarding billed revenue lets rate-card fiction persist because partners are paid on invoices that get written down later. Putting collected realization on the scorecard next to standard-rate growth aligns partner incentives with the cash the firm actually keeps.
What RPL and PPP should a regional AmLaw 100/200 firm target?
Use RPL of $700K–$900K and PPP of $1.2M–$2M as the practical target band for most regional AmLaw 100/200 firms — the Bradley Arant, McGuireWoods, Womble Bond Dickinson tier — rather than chasing AmLaw 50 economics. Reserve RPL above $1.6M and PPP above $5M as ceiling references for calibration, not first-year goals.
How do you fix origination-credit hoarding?
Replace single-partner lifetime credit with split origination credit — originator plus relationship partner plus working partner — and add institutional client-account credit that survives departures. When one partner keeps 100% of credit for life, cross-sell rates fall under 20% even when the firm has world-class adjacent practices. Skadden's institutional client-team model is the reference fix.
How often should the executive committee review these KPIs?
Daily, the practice-group COO watches time-entry compliance, new matter opens, conflicts cleared, and invoices sent. Weekly, practice-group leaders review hours run-rate, top-25 client WIP, AR aging past 90 days, and pitches won. Monthly, the executive committee reviews realization, utilization variance, matter margin, and AFA performance. Quarterly, the management committee reviews PPP, RPL, and concentration.
What is the biggest mistake firms make with matter win rate?
Tracking only wins. Without instrumentation at pitch submission, partners report only their wins and the metric becomes self-flattering. Capture every RFP and beauty contest in Intapp or Foundation, log the outcome, and segment by practice, client tier, and partner-pitcher. A five-firm beauty contest is mathematically a 20–25% win rate, so calibrate expectations accordingly.
How do you stop AFA losses from hiding inside hourly margins?
Require matter-level realized-margin tracking on every AFA and review AFA performance quarterly at the pricing committee. A $500K fixed fee on a deal that runs 2,800 hours at a blended cost of $750K is a $250K loss absorbed into the practice-group P&L where nobody notices. Repeat across 40 matters and the firm leaks $10M a year.
Sources
- https://www.americanlawyer.com/
- https://www.thomsonreuters.com/en/institute/legal-institute.html
- https://www.wellsfargo.com/biz/professional-services/legal/
- https://www.altmanweil.com/
- https://www.intapp.com/
- https://www.aderant.com/
- https://www.bticonsulting.com/
- https://www.americanbar.org/news/profile-legal-profession/
Related on PULSE
- [More sales kpis for commercial law firm rankings and buying guides](/knowledge)
- [PULSE Tools and calculators](/tools)
- [Everything on PULSE RevOps](/)
This page will be disappearing soon. Save it to your device for $1 — or read it free while it is here.
@Kory-White- · if Venmo asks, the last 4 of my number are 2012
 pulse-industry-kpisTop 10 Sales KPIs for Medical Practice Staffing & Locum Tenens in 2027
 pulse-industry-kpisTop 10 Sales KPIs for Commercial Bus Dealership in 2027
 pulse-industry-kpisTop 10 KPIs for Dental Practices in 2027
 pulse-industry-kpisTop 10 Sales KPIs for Commercial Playground Equipment Installation in 2027
 pulse-industry-kpisTop 10 KPIs for Preschools in 2027
 pulse-industry-kpisTop 10 Sales KPIs for Specialty Chemicals Distribution in 2027
 pulse-industry-kpisTop 10 KPIs for HVAC Contractors in 2027
 pulse-industry-kpisTop 10 KPIs for Florists in 2027
 pulse-industry-kpisTop 10 Sales KPIs for Commercial Surgical Center and ASC in 2027
 pulse-industry-kpisTop 10 Sales KPIs for Commercial Pest Control and Vegetation Management in 2027