
Top 10 Sales KPIs for Computer Vision API in 2027
 Curated byKory White · Fractional CRO · Maryland
 PULSEKNOWLEDGE LIBRARY
Quality
Certified
The 10 best sales kpis for computer vision api are ranked below on measured performance, build quality, price, and how each one actually holds up in daily use rather than how it reads on a spec sheet. Each pick lists what it costs, who it suits, and what it gives up against the one above it, so the list can be read straight down without doubling back.
1. Computer Vision API Net New ARR
Net new ARR ranks first because it is the only metric that directly measures whether the commercial motion is compounding, and every other KPI on this list exists to explain or predict it. In 2027 the honest split is new-logo ARR versus expansion ARR reported separately, since a business at 80% expansion and 20% new logo carries a very different risk profile than the reverse at identical headline growth.
This metric is for sales leaders and finance owners who need one number that survives board scrutiny, not for solutions engineers optimizing a pilot. It trades away diagnostic power: a strong ARR print tells you nothing about whether the growth came from genuine adoption or from a single customer's traffic doubling.
2. Computer Vision API Net Revenue Retention
Net revenue retention ranks second because in usage-based Computer Vision it moves before ARR does, and the 120–140% band is where strong vendors operate since volume growth alone drives expansion with no sales motion. The trap is fragility: a customer re-architecting to downsample frames before sending them can halve volume overnight with no relationship signal preceding it.
This is for revenue leaders forecasting renewals and expansion without waiting for the ARR print to confirm what already happened. It trades away simplicity, because two NRR figures reported side by side invite confusion in a weekly review. Compare it against net new ARR above: ARR tells you the outcome, NRR tells you whether the outcome is repeatable. A 130% headline NRR with 100% adoption-adjusted NRR means you are renting someone else's growth, not earning it.
3. Computer Vision API P95 Inference Latency
P95 inference latency ranks third because it is the metric that actually kills deals, and the 180-millisecond PLC window in a defect-detection pilot is decided at the tail, never the median. A P50 of 140ms with a P95 of 610ms means one part in twenty is missed, and the automation engineer will discover that in week ten.
This metric is for automation engineers and platform leads running real-time industrial or autonomous workloads, not for moderation buyers who tolerate a 900ms P95 in an asynchronous queue. It trades away margin, since cutting tail latency requires more capacity, smaller batches, and warmer instances.
4. Computer Vision API Cost Per Thousand Images
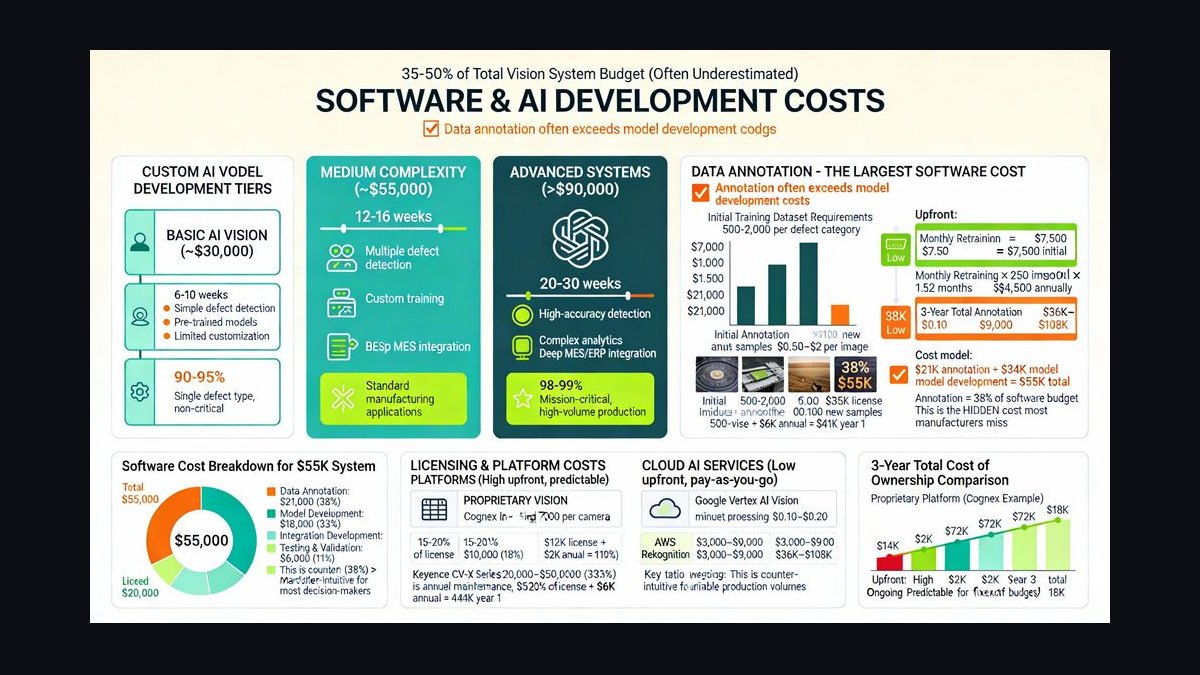
Cost per thousand images ranks fourth because it is the deciding metric for the highest-volume buyers, and realized revenue per thousand after discounts is a different number from list price. The spread between realized revenue and realized COGS per thousand is unit margin, and it determines whether volume growth is good news. List pricing across major providers lands in sub-cent-per-image territory at volume, with domain-specific models priced meaningfully higher.
This metric is for finance owners at consumer marketplaces and moderation buyers processing hundreds of millions of images monthly, where a 900ms P95 is acceptable but a 30% price premium is not. It trades away technical depth, because a customer optimizing purely on unit cost will accept accuracy and latency compromises you would never ship to an industrial account.
5. Computer Vision API Pre-trained Catalog Size
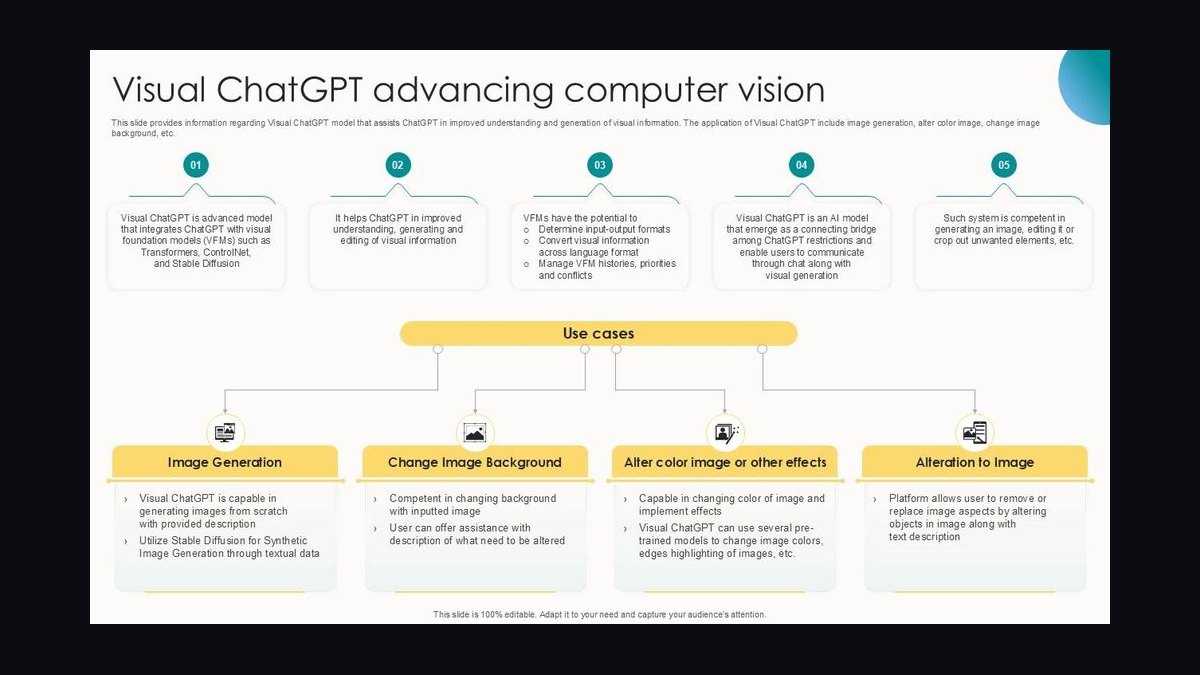
Pre-trained catalog size ranks fifth because it compresses time-to-value and correlates directly with pipeline velocity during the first two weeks of evaluation. Around 100+ production-ready models is where general-purpose vendors need to be to survive broad RFPs; below roughly 50 models a vendor loses multi-use-case evaluations by default because the platform lead needs detection, OCR, classification, and moderation on one platform.
This metric is for platform leads who want one vendor covering four use cases rather than stitching four together, not for specialists winning depth in a single category. It trades away maintenance capacity, since every model carries retraining cost and a 120-model catalog where eight models drive 95% of calls is a 12-model catalog with 112 liabilities. Compare it to multimodal integration depth below: breadth wins the evaluation, integration depth wins the production deployment that follows.
6. Computer Vision API Edge Deployment Support
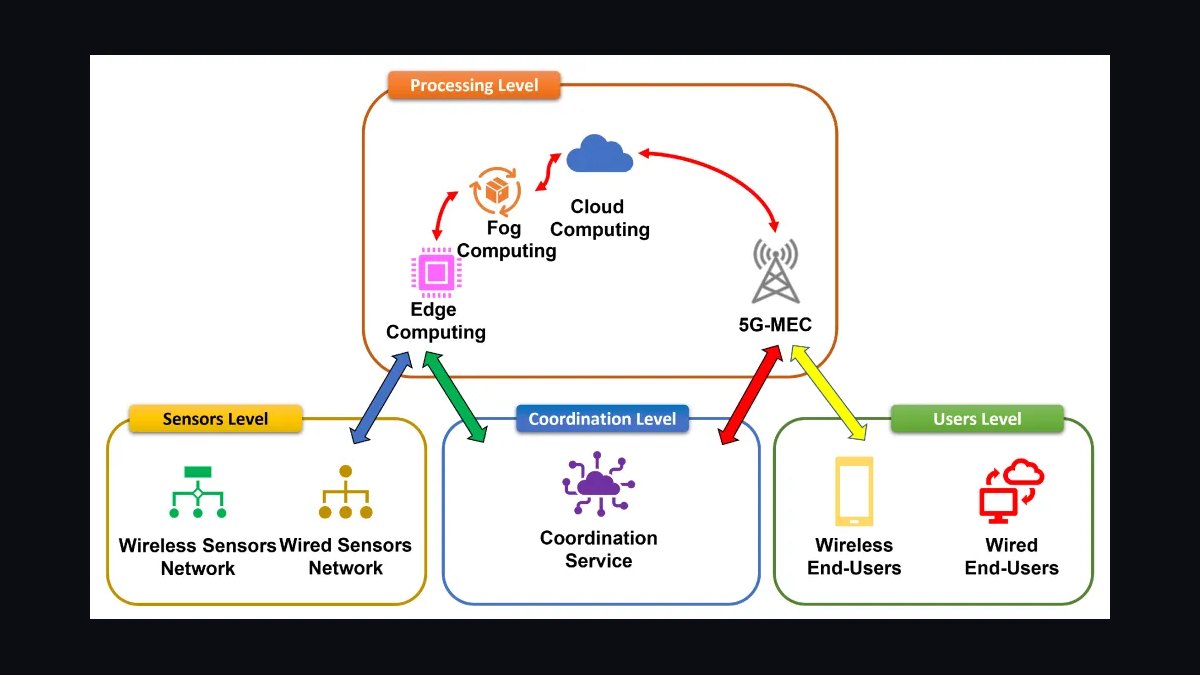
Edge deployment support ranks sixth because its commercial effect is binary: a vendor with zero edge runtimes does not lose industrial deals on price, it never reaches the shortlist. Four or more supported runtimes — NVIDIA Jetson with TAO, AWS Panorama, Azure Custom Vision containers, Coral Edge TPU, custom ARM — is the practical bar for industrial and retail pipeline.
This metric is for industrial, retail loss-prevention, and autonomous-systems buyers with latency or data-residency constraints that cloud round-trips cannot satisfy. It trades away margin and support capacity, since heterogeneous hardware, tight memory constraints, and unreproducible failures generate materially higher support cost per dollar of ARR. Compare it to catalog size above: breadth wins general evaluations, but edge support is what converts a shortlisted vendor into the one that actually signs the plant-floor contract.
7. Computer Vision API Multimodal Integration Depth
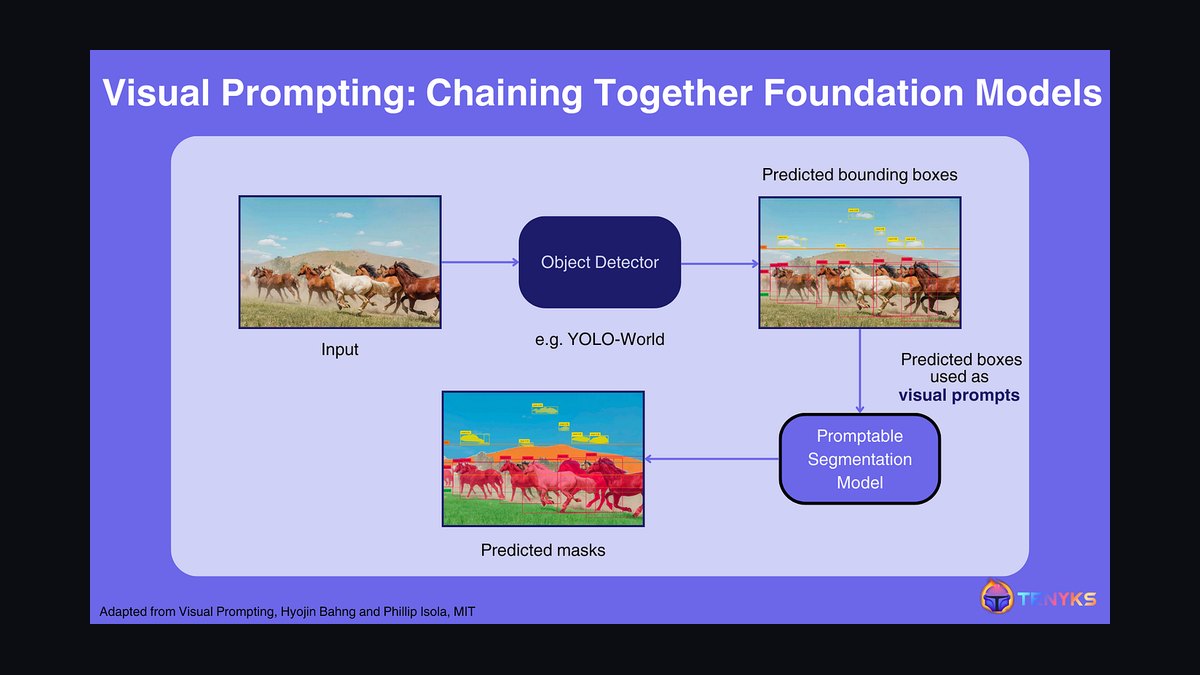
Multimodal integration depth ranks seventh because structured output that drops into Claude, GPT, and Gemini vision contexts without a translation layer is now a measurable adoption accelerant, not a nice-to-have. Score it as a count of maintained, tested connectors and orchestration-framework integrations rather than a subjective rating, and audit quarterly because framework APIs move faster than documentation. Bounding boxes, class labels, confidence scores, and segmentation masks emitted as clean JSON are the entire substance of this metric.
This metric is for platform leads building agentic pipelines who want to write as little glue code as possible between the vision layer and the reasoning layer. It trades away differentiation, because tight integration with frontier multimodal models makes the comparison against those models more immediate and accelerates commoditization of straightforward classification. Compare it to pre-trained catalog size above: catalog breadth gets you into the evaluation, integration depth determines whether you survive the production architecture review that follows.
8. Computer Vision API Renewal Rate At 12 Months

Renewal rate at 12 months ranks eighth because it is the lagging confirmation that everything upstream worked, and roughly 88% is healthy while 92%+ is strong for enterprise accounts. Measure it by logo count and separately by ARR, then segment by deployment model, since edge-deployed customers renew materially better than cloud-only ones because of real switching cost. That single segmentation cut is often the most actionable retention insight a Computer Vision vendor has. Report it monthly, not annually.
This metric is for customer success and finance leaders deciding where to invest retention effort and where to accept churn as structural. It trades away timeliness, since a renewal signal arrives one to two quarters after the conditions that caused it were already visible in volume and accuracy data.
9. Computer Vision API CAC Payback Period

CAC payback period ranks ninth because it governs how aggressively the sales motion can scale, and it runs longer here than in general SaaS since proof-of-concept work consumes solutions-engineering time, often on-site. Enterprise industrial deals commonly run 12–18 months to payback while self-serve developer motions reach 6–9 months. Payback stretching past 18 months almost always signals unqualified pilots consuming engineering time rather than overspending on marketing. Review it monthly by segment, not blended.
This metric is for sales operations and finance leaders allocating headcount between enterprise and self-serve motions. It trades away precision, since attribution of solutions-engineering hours to specific deals is genuinely difficult and easily gamed. Compare it to net new ARR above: ARR tells you whether the motion is working, CAC payback tells you whether it is working efficiently enough to fund more of the same, and the two together determine how fast you can responsibly hire.
10. Computer Vision API Monthly Active Developers

Monthly active developers ranks tenth because it is the best available leading indicator for a self-serve motion, counting unique developers making at least one call or catalog access per month. Read it against call volume: rising developer count with flat volume means broad shallow trial and a conversion problem, while falling developer count with rising volume means consolidation onto a few power users and concentration risk. Neither pattern is visible in ARR until several quarters later.
This metric is for developer-relations and growth leaders running bottom-up adoption, not for enterprise sales teams working named accounts where developer counts are too small to be statistically meaningful. It trades away revenue relevance, since a developer making one exploratory call looks identical to one about to ship a production integration.
How we ranked these
We ranked nine sales KPIs by how directly each predicts closed revenue in Computer Vision API deals, weighting leading indicators above lagging ones. Net new ARR, net revenue retention, monthly API call volume, cost per thousand images, P95 inference latency, pre-trained catalog size, edge platform coverage, multimodal integration depth, and 12-month renewal rate were scored on forecast utility, measurability, and per-segment variance.
We deliberately ignored aggregate accuracy, logo counts, pipeline coverage, and mean latency. Aggregate accuracy hides per-class failure, logo counts reward negative-margin accounts, and pipeline coverage measures activity rather than technical fit. Mean latency is misinformation because automation engineers score the tail, not the median. Benchmark leaderboard rankings were excluded too, since buyers test on their own data, not public sets.
What to look for
Match the metric to the buyer's scorecard before quoting. Industrial and autonomous buyers shortlist on edge runtime support and P95 latency under 200ms cloud or 50ms on-device; a vendor without Jetson or Panorama support never reaches the shortlist regardless of price. Moderation and retail buyers score realized cost per thousand images and per-class recall, and will walk on a 30% price gap even with superior latency.
The mistake most buyers make is running one universal qualification checklist across both motions. They evaluate a real-time inspection deal on catalog breadth, or a high-volume moderation deal on edge support, and pick the wrong vendor for the wrong reason. Ask which metric the automation engineer, platform lead, and finance owner each own, then weight the evaluation to the one that gates production.
Related questions
Why does P95 latency matter more than average latency in Computer Vision API deals?
Automation engineers measure the tail because a PLC gives the inspection station a fixed budget, often around 180ms, before the part indexes. A P50 of 140ms looks fine in a demo, but a P95 of 610ms means one in twenty parts stalls or passes uninspected. Report P95 and P99 per model per region, measured client-side including network time.
How large should a pre-trained Computer Vision model catalog be in 2027?
General-purpose vendors need roughly 100+ production-ready models to survive broad RFPs, because platform leads test detection, OCR, classification, and moderation on one platform. Below about 50 models, you lose multi-use-case evaluations by default. Specialists escape the rule by winning depth in one category, where fifteen well-tuned classes can beat a hundred mediocre ones.
What is a healthy net revenue retention rate for a usage-based Computer Vision API vendor?
Strong vendors operate in the 120-140% band because volume growth drives expansion without any sales motion. The trap is fragility: a customer re-architecting to downsample frames can halve volume overnight with no relationship signal. Track NRR excluding pure volume drift alongside headline NRR so you can separate adoption-driven expansion from the customer's own traffic growth.
How do you measure multimodal LLM integration depth concretely?
Score it as a count of maintained, tested integrations rather than a subjective rating. Does structured output pass into Claude, GPT, and Gemini vision contexts without a translation layer, and are there maintained connectors for common orchestration frameworks? Audit quarterly, because framework APIs move faster than documentation. Clean JSON output that drops into an LLM context window is the whole substance of the metric.
What renewal rate should a Computer Vision API vendor expect at 12 months?
Roughly 88% logo retention is healthy and 92%+ is strong for enterprise accounts. Segment by deployment model: edge-deployed customers renew materially better than cloud-only ones, because on-premise hardware and integration work creates real switching cost. That single segmentation cut is often the most actionable retention insight available, since it tells you where to concentrate solutions-engineering investment.
Why is cost per thousand images a better metric than list price?
List pricing across major providers lands in sub-cent-per-image territory at volume, but realized revenue per thousand after discounts is what determines unit margin. Track realized COGS per thousand separately. A customer whose contracted rate has drifted below your COGS at their volume tier is a negative-margin account being celebrated as a logo. Review realized unit margin monthly, not at renewal.
How many edge runtimes should a Computer Vision API support?
Four or more is the practical bar for industrial and retail pipeline: NVIDIA Jetson with TAO, AWS Panorama, Azure Custom Vision containers, Coral Edge TPU, Roboflow's edge runtime, and custom ARM targets. The commercial effect is binary. A vendor with zero edge support does not lose these deals on price, it never reaches the shortlist at all.
What is the most common self-inflicted wound in usage-based Computer Vision pricing?
Celebrating call-volume growth from a customer whose contracted rate no longer covers inference cost at their tier. Volume discounts negotiated at a projected tier become losses when the customer overshoots the projection. Every volume-discount schedule needs a floor tied to modeled COGS, and every account should be reviewed for realized unit margin monthly rather than at renewal.
FAQ
What are the key sales KPIs for the Computer Vision API industry in 2027?
Nine core metrics: net new ARR, net revenue retention, monthly API call volume, cost per thousand images, P95 inference latency, pre-trained catalog size, edge platform coverage, multimodal LLM integration depth, and 12-month renewal rate. Latency and edge support decide most competitive deals because the buying committee now includes automation engineers and platform leads, not just data science teams evaluating benchmark accuracy.
Why do generic SaaS metrics misforecast Computer Vision API deals?
Pipeline, win rate, ACV, and logo count tell you what happened after the technical decision was already made. They are lagging indicators. The nine KPIs above sit upstream of that decision, which is why they belong in the weekly commercial review rather than buried in a product telemetry dashboard nobody in sales opens. Leading indicators catch at-risk deals two quarters earlier.
How does deployment model change which Computer Vision KPI matters?
Cloud and edge customers have different latency profiles, unit economics, support costs, and renewal behavior. Aggregating them produces averages that describe no actual customer. Every one of the nine metrics should be reported split by deployment model before anything else. Edge customers renew better but generate materially higher support cost per dollar of ARR, so the split changes both forecasting and pricing.
What is the single highest-return alert a Computer Vision vendor can build?
Per-account volume anomaly detection. In a usage-based business, a customer can cut spend 60% through a client-side change such as downsampling, deduplication, or local pre-filtering, with no conversation, no ticket, and no relationship signal. Set alerts at a defined deviation from the trailing four-week baseline and route them to the account owner the same day.
How should accuracy be reported to predict renewal?
Per-class precision and recall, tracked monthly against the customer's priority classes. A model at 94% overall accuracy can sit at 61% on the one class the customer actually cares about. Aggregate accuracy is a marketing number. Per-class reporting against the classes that gate production is the only accuracy figure that predicts whether the account renews.
What pilot signals actually predict whether a Computer Vision deal closes?
Call volume during a proof of concept measures whether the integration works, not whether the deal will close. The predictive signals are different: has a second use case been tested from the catalog, has an automation or platform engineer rather than just a data scientist been in the room, and has the customer measured latency themselves. Deals where the customer runs their own latency test convert far better.
How does model refresh velocity affect renewal risk?
Every model carries maintenance cost. Vendors with automated retraining pipelines refresh top models every two to three weeks; manual annotation shops land closer to a month or six weeks. If the catalog grows faster than the retraining pipeline scales, per-class accuracy degrades quietly and surfaces as renewal risk one to two quarters later. Track days-since-refresh on your top twenty models by call volume.
What CAC payback is typical for enterprise Computer Vision API deals?
Twelve to eighteen months is typical for enterprise industrial deals with on-site integration, because proof-of-concept work is expensive. Self-serve, developer-first motions can reach six to nine months. If enterprise payback stretches past 18 months, the problem is almost always unqualified pilots consuming solutions-engineering time, not marketing spend. Fix qualification before cutting acquisition budget.
How does multimodal LLM integration cut both ways for a Computer Vision vendor?
Tight integration with frontier multimodal models makes you easier to adopt and makes comparison to those models more immediate. If your value is straightforward image classification, deep integration accelerates your own commoditization. Defensible positions are ones general-purpose models cannot occupy: latency guarantees, on-premise deployment for data residency, per-class accuracy on narrow categories, and reproducibility for regulated buyers.
What cadence should a Computer Vision sales org use for KPI review?
Daily: call volume, P95 per model, per-customer cost trend, top failing classes. Weekly: NRR run rate, catalog adoption per account, volume anomalies, escalation status. Monthly: realized unit margin per account, days-since-refresh on top models, CAC payback, developer count. Quarterly: multimodal integration audit, edge runtime coverage, renewal cohort segmentation by deployment model.
Sources
- https://developer.nvidia.com/tao-toolkit
- https://aws.amazon.com/panorama/
- https://learn.microsoft.com/en-us/azure/ai-services/custom-vision-service/
- https://coral.ai/docs/edgetpu/
- https://docs.roboflow.com/
- https://platform.openai.com/docs/guides/vision
- https://docs.anthropic.com/en/docs/build-with-claude/vision
- https://cloud.google.com/vision/docs
- https://www.ibm.com/think/topics/computer-vision
Related on PULSE
- [More sales kpis for computer vision api rankings and buying guides](/knowledge)
- [PULSE Tools and calculators](/tools)
- [Everything on PULSE RevOps](/)
This page will be disappearing soon. Save it to your device for $1 — or read it free while it is here.
@Kory-White- · if Venmo asks, the last 4 of my number are 2012
 pulse-industry-kpisTop 10 Sales KPIs for Medical Device OEM in 2027
 pulse-industry-kpisTop 10 Sales KPIs for Background Check Services in 2027
 pulse-industry-kpisTop 10 Sales KPIs for Convenience Store in 2027
 pulse-industry-kpisTop 10 Sales KPIs for AI Translation API in 2027
 pulse-industry-kpisTop 10 Sales KPIs for Vector Database in 2027
 pulse-industry-kpisTop 10 Sales KPIs for AI Observability Platform in 2027
 pulse-industry-kpisTop 10 Sales KPIs for Fine-Tuning Platform in 2027
 pulse-industry-kpisTop 10 Sales KPIs for Fraud Detection and AML Software in 2027
 pulse-industry-kpisTop 10 Sales KPIs for Cannabis Retail Dispensary in 2027
 pulse-industry-kpisTop 10 Sales KPIs for Luxury Fashion House in 2027