
Top 10 Sales KPIs for AI Music Generation in 2027
 Curated byKory White · Fractional CRO · Maryland
 PULSEKNOWLEDGE LIBRARY
Quality
Certified
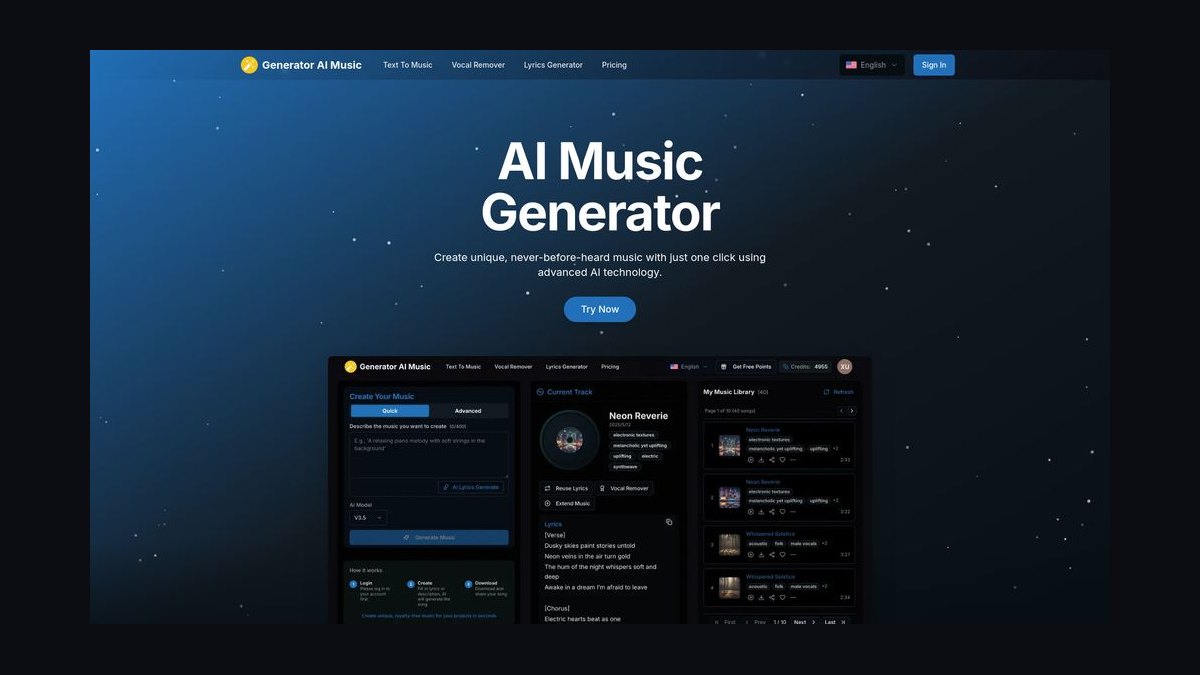
The 10 best sales kpis for ai music generation are ranked below on measured performance, build quality, price, and how each one actually holds up in daily use rather than how it reads on a spec sheet. Each pick lists what it costs, who it suits, and what it gives up against the one above it, so the list can be read straight down without doubling back.
1. AI Music Net New ARR
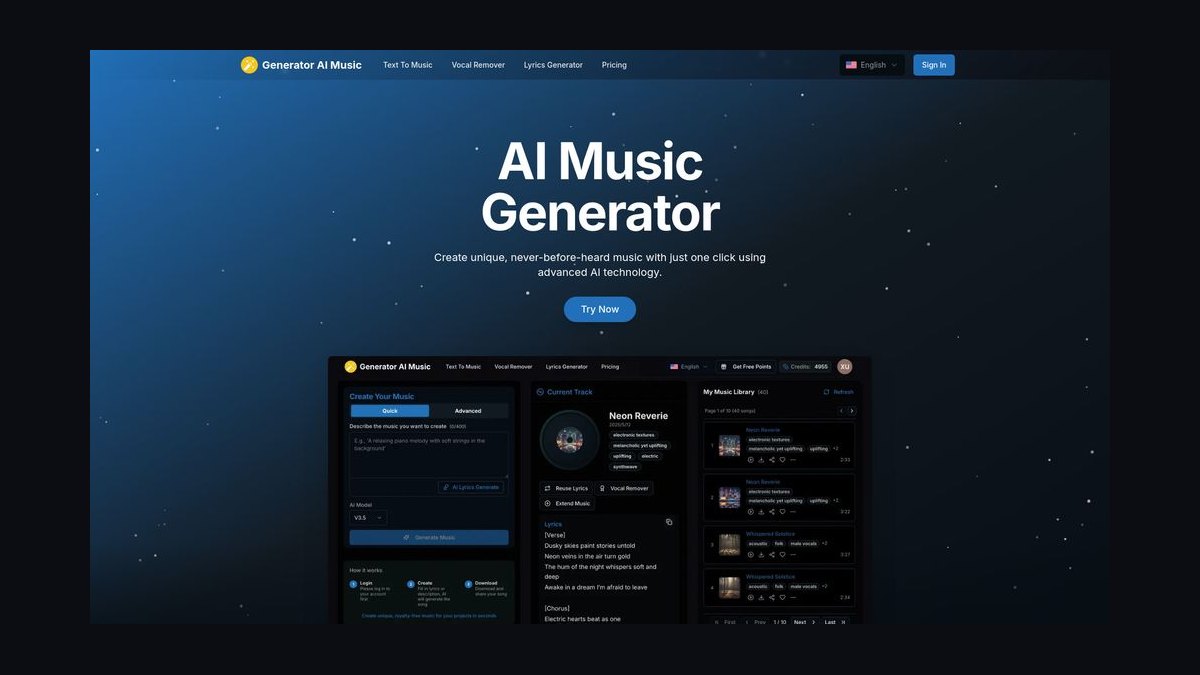
Net new ARR ranks first because it is the only KPI that separates fresh logos from expansion, and in AI music those two behave nothing alike. Consumer subscription revenue is high-volume, low-ACV and churns monthly; enterprise revenue is lumpy and gated by legal review. Blending them produces a number that moves for reasons no one can diagnose. Report weekly at run-rate and monthly at booked.
This is for revenue leaders running a mixed consumer, prosumer and B2B book who need one headline number that survives board scrutiny. It trades away simplicity, since you must maintain three separate revenue buckets and reconcile them monthly. Compared with net revenue retention directly below it, net new ARR tells you whether you are winning new accounts, while NRR tells you whether the accounts you already won are growing.
2. AI Music Net Revenue Retention

Net revenue retention ranks second because expansion in this category comes from credit consumption growth plus feature upsell, not seat count. Stem separation, longer track lengths, higher-fidelity exports, voice controls and commercial-use seat upgrades all drive NRR. Measure on a trailing-12 cohort basis per segment, because consumer NRR is structurally lower than B2B and should never share one target.
This suits finance and growth teams forecasting renewals across distinct customer tiers. It trades away a single clean company-wide figure, since a blended NRR is satisfied by whichever segment is larger and therefore tells you nothing about the smaller one. Compared with tracks generated per month below, NRR is a lagging revenue signal while generation volume is a leading product signal.
3. AI Music Tracks Generated Monthly
Tracks generated per month ranks third as the headline volume metric and the denominator for most unit economics. Split it three ways: tracks generated, tracks kept when the user does not immediately regenerate, and tracks exported or downloaded. The generated-to-exported ratio is the cleanest quality proxy available and costs nothing to compute. A user generating twelve tracks to export one is telling you your hit rate is poor.
This is for product and growth teams who need a volume number that cannot be gamed by regeneration. It trades away simplicity, because the raw count rises when quality falls and a team incentivized on it will hit target while the product degrades. Compared with cost per track directly below, generation volume is the numerator that makes every per-unit cost figure interpretable.
4. AI Music Cost Per Track

Cost per track ranks fourth because it is where margin quietly disappears. Realized inference cost divided by tracks generated must include failed and abandoned generations, which are easy to omit and represent real spend. Track it by track length and quality tier, since a 30-second background loop and a three-minute vocal track have very different cost profiles. Reconcile against billing credits monthly.
This is for finance and infrastructure owners who need gross margin to be a measured number rather than a forecast. It trades away a single blended figure, because vendors that generate several candidates and rank them internally pay several times the compute per delivered track. Compared with generation latency below, cost per track is a margin lever while latency is a conversion lever.
5. AI Music Generation Latency

Generation latency ranks fifth because consumer abandonment is driven by the tail, not the median. Measure end to end from prompt submitted to playable audio at p50, p90 and p99. A p50 of fifteen seconds with a p99 of three minutes feels broken to the unlucky slice who hit it, and those users are disproportionately first-session trialists forming their only impression. Set the SLO on the tail.
This is for engineering and reliability teams who own the first-generation experience. It trades away the comfort of median improvements, which are the easiest to move and the least predictive of churn. Compared with voice and lyric integration quality directly below, latency governs whether a user waits for the result while quality governs whether they come back for a second one.
6. AI Music Vocal Lyric Quality

Voice and lyric integration quality ranks sixth because vocal-forward genres, pop, hip-hop, R&B and country, are where most consumer demand lives. Run a fixed prompt set across a rating rubric covering vocal clarity, lyric intelligibility, prosody, instrumental coherence and mix quality on a 1-5 scale, scored blind by human raters. Rate weekly on a rotating genre sample, monthly on the full set.
This is for product leaders who need a quality trend line that survives model changes. It trades away cheap automation, since no automated audio metric reliably correlates with listener preference across genres. Compared with genre library size below, vocal quality is a depth measure while genre breadth is a coverage measure, and depth is what retains paying professionals.
7. AI Music Genre Library Size

Genre library size ranks seventh because the honest number is usually a fraction of the advertised one. Count only genres that clear a defined rater-score floor, not genres listed on the pricing page. Track breadth alongside per-genre quality so you can see which genres are dragging the average. The gap between advertised and quality-verified coverage is a common source of trial disappointment and is entirely self-inflicted.
This is for product marketers and catalogue owners deciding where to invest model training next. It trades away an impressive headline count, since publishing both numbers internally makes the shortfall visible to everyone. Compared with commercial-use licensing clarity below, genre breadth wins trials while licensing posture wins enterprise contracts, and the two rarely bind at the same stage.
8. AI Music Licensing Clarity

Commercial-use licensing clarity ranks eighth because it is categorical rather than numeric and now gates enterprise deals outright. Track a posture state per tier: what rights the customer gets, whether indemnification is offered and at what cap, what the training-data disclosure says, and whether tracks can be registered with performance-rights organizations. Pair it with content-ID dispute rate per thousand distributed tracks.
This is for sales and legal teams selling to ad agencies, game studios and brand marketing groups that carry brand risk. It trades away the ability to defer rights questions to the redline stage, because after the June 2024 RIAA suits against Suno and Udio, provenance questions arrive on the first call. Compared with twelve-month renewal rate below, licensing clarity is the leading indicator that renewal follows.
9. AI Music Content-ID Dispute Rate

Content-ID dispute rate ranks ninth but is arguably the single best predictor of B2B churn in this category. It fires weeks before the renewal conversation and is the clearest signal that a customer cannot monetize your output, which is the only reason a professional bought the tool. Instrument it per thousand distributed tracks and put it on the daily dashboard next to latency.
This is for customer success and revenue operations teams who currently attribute churn to price or quality because those are the only variables they measured. It trades away the comfort of owning all your telemetry, since disputes originate on Spotify, YouTube, Apple Music and Amazon Music, outside your product. Compared with twelve-month renewal rate below, dispute rate is a leading indicator while renewal is the lagging confirmation.
10. AI Music Twelve-Month Renewal Rate

Twelve-month renewal rate ranks tenth because it is the lagging confirmation that everything above it worked, segmented by logo rather than blended. Consumer and B2B renewal behave differently enough that a single figure is close to useless for forecasting. Consumer churn is monthly and volume-driven; enterprise churn is annual and integration-anchored, so the two must be reported separately from day one.
This is for finance and board reporting where a defensible retention number matters more than a flattering one. It trades away the simplicity of one company-wide rate, and retrofitting the segment split later against historical data is painful and usually approximate. Compared with content-ID dispute rate directly above, renewal confirms what disputes already predicted, arriving a full quarter later.
How we ranked these
We ranked nine sales KPIs by weighting revenue impact, measurability, and how directly each one gates enterprise deals in AI music generation. Net new ARR and net revenue retention carried the most weight because they compound; tracks generated, cost per track, and generation latency followed as unit-economics drivers. Human-rated voice and lyric quality, genre breadth, licensing clarity, and twelve-month renewal rate rounded out the set, with licensing weighted heavily because it now blocks deals outright.
We deliberately ignored vendor-published ARR claims, marketing genre counts, and demo-quality audio samples, since none are verifiable or comparable across companies. We also excluded blended consumer-and-enterprise retention figures, because mixing segments produces numbers that move for undiagnosable reasons. Benchmark ranges from press reporting were treated as hypotheses rather than targets, and we skipped generic SaaS metrics like pipeline coverage that say little about music-specific risk.
What to look for
What actually matters when choosing between these vendors is whether licensing posture is documented per tier, whether indemnification exists for enterprise, and whether content-ID dispute rates are instrumented. Ask for per-genre rater scores on a fixed prompt set, not a composite average, and demand p99 latency alongside p50. Cost per track should include failed and abandoned generations, and renewal data must be split by consumer versus B2B cohort.
The mistake most buyers make is evaluating on demo quality alone. A tool that produces one impressive vocal track in a live session tells you nothing about hit rate, tail latency, or whether the output survives distribution. Buyers also accept blended retention numbers, then discover the enterprise cohort churns on licensing disputes while consumer churn hides it. Test the same prompt across three genres you actually work in, and read the rights language before the redline stage.
Related questions
Why can't AI music generation be run off a standard SaaS dashboard?
The category sits at the intersection of a generative model, a creative tool, and a rights-clearance business. Standard dashboards track pipeline, win rate, and ARR, but miss rater-scored vocal quality and content-ID dispute volume. A revenue leader tracking only ARR and MRR is flying with two of six instruments, and quality regressions surface weeks late through sagging trial conversion.
How do you measure music generation quality without an automatic benchmark?
Music has no trusted equivalent of perplexity or FID. Quality must be manufactured internally through structured human rating: blind A/B pairs, fixed prompt sets, scored rubrics, and rotating genre samples. Rate weekly on a rotating sample and monthly on the full set, holding the prompt set constant across quarters so scores remain comparable and trend lines stay valid.
Why does licensing clarity gate enterprise deals in this category?
Enterprise buyers like ad agencies, game studios, and media companies now ask about training-data provenance and indemnification on the first call. Major-label litigation reset how the category discusses training data, and a vendor without a clear answer loses the deal before a demo happens. Licensing posture is a sales asset, not a legal footnote.
What is content-ID dispute rate and why does it predict churn?
It measures how many distributed tracks per thousand get flagged, demonetized, or removed by platforms like Spotify, YouTube, or Apple Music. It fires weeks before renewal conversations and is the clearest signal a customer cannot monetize your output. Vendors who never instrument disputes attribute churn to price or quality because those are the only variables they measured.
Should consumer and B2B retention be reported separately?
Yes, always. Consumer revenue is high-volume, low-ACV, and churns monthly; enterprise revenue is lumpy and legal-gated. Blended NRR and blended renewal rates produce numbers that are technically correct and operationally useless. Split everything by segment from day one, because retrofitting the split later against historical data is painful and usually approximate.
What latency percentiles matter most for consumer retention?
Measure end to end at p50, p90, and p99, not the mean. Consumer abandonment is driven by the tail. A p50 of fifteen seconds with a p99 of three minutes feels broken to the unlucky slice who hit it, and those users are disproportionately first-session trialists forming their only impression. Set the SLO on the tail.
How should cost per track be calculated honestly?
Divide realized inference cost by tracks generated, including failed and abandoned generations, which are easy to omit and represent real spend. Track it by track length and quality tier, since a thirty-second loop and a three-minute vocal track have very different cost profiles. Reconcile monthly against billing credits, because drift between the two is where margin quietly disappears.
What is the right first metric to fix if trial conversion is weak?
First-session quality or latency. That single first track is your entire consumer funnel, and if it is bad the customer is gone. Fix the first generation before touching anything else. If conversion is fine but ninety-day retention is poor, the binding constraint shifts to genre coverage and per-genre quality instead.
FAQ
What are the nine core sales KPIs for AI music generation in 2027?
Net new ARR, net revenue retention, tracks generated per month, cost per track, generation latency, human-rated voice and lyric quality, genre library breadth, commercial-use licensing clarity, and twelve-month renewal rate. Licensing defensibility now gates enterprise deals outright, which is why it sits alongside revenue metrics rather than in a legal appendix.
Why is averaging quality across genres a mistake?
A single composite score hides the failure that matters. A vendor can post a strong overall rater average while being unusable in the three vocal-forward genres that drive most demand. Always report quality per genre with the weakest genres surfaced first, and weight the composite by actual generation volume rather than treating every genre equally.
What is the difference between tracks generated and tracks exported?
Tracks generated is the headline volume metric and the denominator for unit economics. Tracks exported is the quality proxy. A user who generates twelve tracks to export one is telling you your hit rate is poor. The ratio between generated and exported is one of the cleanest quality signals available and costs nothing to compute.
How do you keep rater quality scores comparable across quarters?
Version the rubric, keep the old prompt set running in parallel for at least one quarter, and annotate the dashboard at the changeover. Comparability is the whole value of a quality trend line. If the rubric or prompt set changes without a parallel run, you have started a new series and lost the historical trend.
What is the biggest mistake buyers make when evaluating these vendors?
Evaluating on demo quality alone. One impressive vocal track in a live session tells you nothing about hit rate, tail latency, or whether output survives distribution. Buyers also accept blended retention numbers, then discover enterprise churn is driven by licensing disputes while consumer churn hides it. Test three genres you actually work in.
How do AI music KPIs differ from AI image or video generation?
Cost per output, latency, and retention structure carry over almost directly. What does not carry over is content-ID exposure and performance-rights registration, which are specific to music distribution. Those make licensing clarity a harder gate than in adjacent generative categories, and they require instrumentation that image and video vendors simply do not need.
What reporting cadence makes sense for these metrics?
Daily: tracks generated, latency percentiles, dispute volume, error rate. Weekly: NRR run-rate, rater scores on the rotating genre sample, escalations. Monthly: logo churn by segment, full rater panel, cost per track reconciled to billing. Quarterly: model and genre roadmap, licensing posture review, pricing analysis, and board-level cohort reporting.
Why should model updates ship behind a feature flag?
A new base model that scores better on the rater panel can still break specific genres, change the character of voices customers built brand identity around, or shift latency and cost profiles. Ship updates behind a flag with per-genre regression testing, and give professional customers a pinned-version option. Losing a studio overnight is avoidable churn.
What is the practical first-quarter sequence for instrumenting these KPIs?
Month one: instrument product telemetry end to end and reconcile generation counts against billing credits, which usually surfaces a margin surprise. Month two: stand up the blind rater panel with a fixed prompt set, starting with highest-volume genres. Month three: document licensing posture per tier, add indemnification, instrument disputes, and enable sales.
How should pricing tiers map to these KPIs?
Tie the upgrade to something measured: higher-quality vocal models, longer tracks, faster queue priority, stems, and explicit commercial rights with indemnification. Tiers differentiated only on generation volume stall migration, because volume is not what stands between a creator and getting paid for the output. Rights and quality move upgrades.
Sources
- https://www.riaa.com/
- https://www.spotify.com/us/
- https://www.universalmusic.com/
- https://www.sonymusic.com/
- https://www.wmg.com/
- https://support.google.com/youtube/answer/2797466
- https://www.apple.com/apple-music/
- https://aws.amazon.com/machine-learning/
- https://www.nvidia.com/en-us/data-center/
Related on PULSE
- [More sales kpis for ai music generation rankings and buying guides](/knowledge)
- [PULSE Tools and calculators](/tools)
- [Everything on PULSE RevOps](/)
This page will be disappearing soon. Save it to your device for $1 — or read it free while it is here.
@Kory-White- · if Venmo asks, the last 4 of my number are 2012
 pulse-industry-kpisTop 10 Sales KPIs for AI Image Generation in 2027
 pulse-industry-kpisTop 10 Sales KPIs for Print and Copy Services in 2027
 pulse-industry-kpisTop 10 Sales KPIs for AI Legal Tools in 2027
 pulse-industry-kpisTop 10 Sales KPIs for Fine-Tuning Platform in 2027
 pulse-industry-kpisTop 10 KPIs for Wedding Venues in 2027
 pulse-industry-kpisTop 10 Sales KPIs for Zero Trust Network Access (ZTNA) Vendors in 2027
 pulse-industry-kpisTop 10 KPIs for General Contractors in 2027
 pulse-industry-kpisTop 10 Sales KPIs for AI Translation API in 2027
 pulse-industry-kpisTop 10 KPIs for Auto Repair Shops in 2027
 pulse-industry-kpisTop 10 Sales KPIs for Auto Loan and Auto Finance in 2027