


How do you forecast sales revenue when your pipeline data keeps changing in 2027?
Quality
Certified
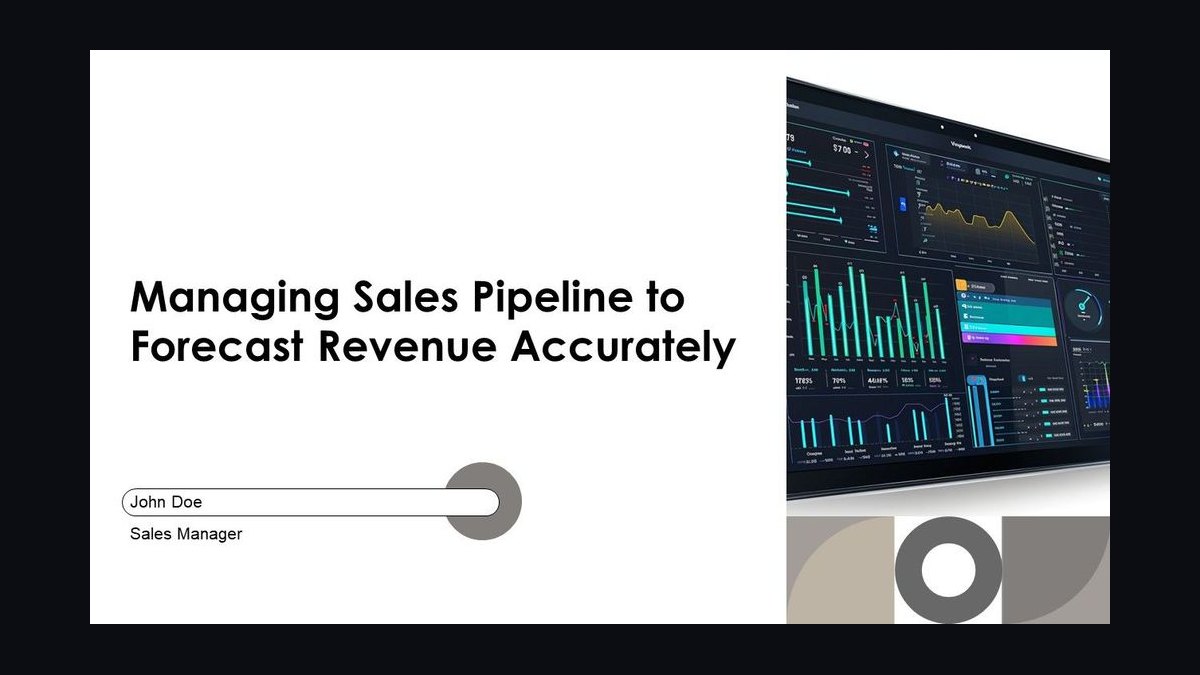
Forecasting sales revenue against a moving pipeline in 2027 means abandoning the single-snapshot spreadsheet. Instead, adopt a rolling forecast that blends historical conversion rates with real-time pipeline velocity, then reweights every deal by stage and recency. Rebuild the forecast weekly, not quarterly, and treat pipeline change as signal rather than noise. The core discipline is a documented, repeatable strategy for adjusting assumptions as data shifts.
The two options compared: static snapshots versus rolling reforecasts
The classic approach treats the forecast as a periodic artifact. You pull pipeline data on the last day of the month, apply a stage-weighted probability to every open deal, add committed renewals, and publish a number. That number then anchors budget conversations, board decks, and quota planning for weeks. It is simple, auditable, and familiar. It is also structurally blind to the thing that matters most in 2027: the pipeline underneath it never stops moving. Deals slip a stage, champions leave, budgets get frozen, a competitor gets acquired, and procurement adds a security review that nobody scoped. By the time the snapshot is challenged, the inputs are already stale.
The alternative is a rolling reforecast. You keep the same stage-weighted math but you refresh it on a fixed cadence — weekly for most B2B teams, sometimes daily inside the final two weeks of a quarter. Each refresh compares the current pipeline against the prior refresh, isolates what changed, and forces an explicit decision about whether the change is a timing shift, a probability shift, or a real loss. The forecast becomes a living model rather than a photograph.

The practical difference is not the formula. Both approaches use stage probabilities, historical conversion, and rep commit calls. The difference is the feedback loop. A static forecast learns nothing between cycles. A rolling reforecast learns continuously, and that learning is what lets you defend a number when the pipeline is churning.
There is a third pattern worth naming because it shows up constantly in 2027 tooling: the AI-generated forecast. Vendors now push models that ingest CRM activity, email sentiment, and call transcripts and emit a predicted close rate per deal. These can be genuinely useful, but they are not a replacement for either option above. They are an input. If your underlying pipeline hygiene is poor, an AI model will confidently forecast garbage. The model amplifies whatever data discipline you already have.
The honest comparison comes down to three trade-offs. Static snapshots win on auditability and low operational cost. Rolling reforecasts win on accuracy under volatility and on early warning. AI-assisted forecasts win on speed of coverage across large deal counts, but only when the CRM data feeding them is trustworthy. Most mature revenue teams end up combining all three: a rolling reforecast as the backbone, AI scoring as a per-deal input, and a frozen snapshot at quarter close for the audit trail.
How to decide between them

The decision hinges less on company size than on pipeline volatility and the cost of being wrong. If your average deal cycle is under 30 days and your win rates are stable quarter to quarter, a static snapshot refreshed monthly is probably sufficient. If your cycle is 90 days or longer, if you sell into committee buying groups, or if your historical conversion rates have moved more than a few points in either direction over the last two quarters, you need the rolling model.

Two more decision inputs matter and are easy to overlook. First, how many people consume the forecast? A number that only the CRO sees can tolerate more wobble than a number that drives hiring plans, inventory commitments, and public guidance. Second, how fast can you act on a signal? A rolling reforecast that surfaces a problem on Wednesday but has no remediation workflow attached is just anxiety delivered on a schedule. Pair the cadence with an intervention — deal reviews, executive sponsor outreach, revised mutual action plans — or the extra fidelity buys you nothing.
A useful test: take your last four quarterly forecasts and measure the absolute error against actuals. If the average miss is under roughly five percent, your current process is probably fine and added cadence is overhead. If misses routinely run into double digits, the pipeline is telling you something your forecast is not listening to, and the rolling model is the fix.
Concrete numbers behind each option
Numbers make the choice concrete. Start with stage conversion. A typical mid-market B2B funnel might convert roughly 20 to 25 percent of qualified opportunities to closed-won, with stage-by-stage rates something like 60 percent from discovery to validation, 50 percent from validation to proposal, and 40 percent from proposal to close. Multiply those together and you get a compounded rate that is far lower than any single stage suggests. This compounding is exactly where static forecasts go wrong: they apply a flat probability per stage and never re-derive the product as stages shift.

Now add time. If your average sales cycle is 95 days and your pipeline coverage ratio — open pipeline divided by quota — sits at 3x, you are nominally healthy. But coverage ratio is a point-in-time metric. If 40 percent of that pipeline was created more than 120 days ago and has not advanced a stage, the effective coverage is closer to 1.8x. That gap between nominal and effective coverage is the single most useful number a rolling reforecast produces, and it is invisible in a monthly snapshot.
Slippage is the next number. Track the percentage of deals that move out of a quarter rather than closing or being lost. In volatile environments, quarterly slippage of 15 to 25 percent of committed pipeline is common. If you forecast at the top of the range and 20 percent slips, you miss. A rolling model lets you see slippage accumulating week by week and adjust the commit number before the quarter ends rather than explaining it afterward.
Then there is velocity. Pipeline velocity equals the number of qualified opportunities multiplied by average deal value multiplied by win rate, divided by cycle length. Each of those four inputs moves independently. Win rate might hold steady while cycle length stretches by two weeks, and velocity drops even though nothing looks broken. Watching velocity as a single composite number, refreshed weekly, catches these offsetting movements that stage-level reporting misses.

Finally, weigh the cost of the cadence itself. A weekly reforecast for a team of 40 reps typically costs a few hours of analyst time plus 30 to 45 minutes per rep in pipeline review. That is real overhead. The counterweight is the cost of a miss: if a 10 percent forecast error translates into misallocated hiring, delayed product investment, or a credibility hit with the board, the weekly cadence pays for itself quickly. Run the arithmetic on your own numbers rather than accepting a generic benchmark.
Implementation details and sequencing
Sequence matters more than tooling. Teams that buy a forecasting platform before fixing pipeline hygiene end up automating their own confusion. Start with definitions, then cadence, then instrumentation, then automation.
Step one is a written stage definition document. Every stage needs an exit criterion that is objectively verifiable — not "demo completed" but "technical validation signed off by the named evaluator." Without this, stage probabilities are meaningless because two reps at the same stage are in completely different places. This is the least glamorous step and the one that determines whether everything downstream works.

Step two is setting the reforecast cadence and the change log. Pick a day — Monday morning works well because it captures the prior week's activity. Each cycle, record the forecast number, the pipeline total, the coverage ratio, the slippage count, and the top ten deals by value with their stage movement since last cycle. The change log is what turns a forecast into an early warning system. After two quarters you have a dataset that shows exactly how your pipeline behaves when it is about to go sideways.
Step three is per-deal inspection, concentrated where it matters. Roughly 20 percent of deals typically carry 70 to 80 percent of the forecast value. Inspect those individually every cycle. For the long tail, stage-weighted math is fine. This is the highest-leverage allocation of review time and it is what separates teams that hit numbers from teams that explain them.
Step four is the intervention workflow. A signal without an action is noise. When a top deal stalls or slips, there should be a defined response: a deal review within 48 hours, an executive sponsor touch, a rewritten mutual action plan with dated commitments from the buyer. The forecast's job is to trigger this; the workflow's job is to change the outcome.

Step five is the quarter-close freeze and post-mortem. Even in a fully rolling model, freeze a snapshot at close for auditability and compare it against actuals. The error you measure becomes the calibration input for next quarter's stage probabilities. This loop — define, forecast, intervene, measure, recalibrate — is the whole system. The tooling is interchangeable; the loop is not.
One upstream effect worth planning for: rolling reforecasts change how finance and sales interact. Finance teams accustomed to a locked monthly number need to understand that the forecast will move, and that movement is the point. Set expectations early, agree on which number is authoritative for which purpose, and keep the frozen close snapshot as the shared reference point. Downstream, a more accurate forecast improves territory design, quota setting, and compensation plan modeling, because those decisions inherit the quality of the pipeline data underneath them.
Related questions
How often should a forecast be rebuilt when pipeline data keeps changing?

Weekly for most B2B teams with cycles over 60 days, and daily during the final two weeks of a quarter. More frequent than daily adds noise without adding signal, because deal movement does not resolve fast enough to justify it.
What pipeline metrics best predict a forecast miss?
Effective coverage ratio — open pipeline excluding stale deals, divided by quota — plus quarterly slippage percentage and composite pipeline velocity. Watching all three weekly catches deterioration before the commit number breaks.
Can AI forecasting tools replace a rolling reforecast?
No. They are an input layer, not a replacement. AI scoring improves per-deal probability estimates, but it inherits whatever data quality your CRM has. The rolling cadence and change log remain the backbone.
What is the biggest cause of forecast error in volatile pipelines?
Stale pipeline counted at full value. Deals that have not advanced a stage in 90 to 120 days are frequently counted as live when they are effectively dormant, inflating coverage and masking the real gap.
Does a rolling forecast work for transactional, short-cycle sales?
It is usually overkill. If cycles run under 30 days and win rates are stable, a monthly snapshot with a mid-month sanity check captures most of the available accuracy at far lower operational cost.
FAQ

How do you forecast sales revenue when pipeline data keeps changing?
Rebuild the forecast on a fixed weekly cadence using stage-weighted probabilities derived from your own historical conversion rates. Log every change between cycles, inspect the top 20 percent of deals individually, and attach an intervention workflow to any deal that stalls. Treat the movement itself as the signal you are trying to detect.
What is a rolling reforecast, exactly?
It is a forecast that is recalculated on a set schedule rather than frozen for a quarter. Each cycle refreshes stage probabilities, compares the new pipeline against the prior cycle, and isolates what changed. The output is a continuously updated number plus a change log that shows the direction and cause of movement.
How do you handle deals that slip from one quarter to the next?

Track slippage as a standing metric and assume a baseline rate — often 15 to 25 percent of committed pipeline in volatile environments. Forecast at a level that survives that slippage rather than at the top of the range. When a specific deal slips, require a dated buyer commitment before counting it again.
What pipeline coverage ratio should you target?
Three to four times quota is a common benchmark, but nominal coverage is misleading. Calculate effective coverage by excluding deals that have not advanced in 90 days or more. If effective coverage falls below roughly 2x, the forecast is at risk regardless of what nominal coverage shows.
Should the forecast number ever be locked?
Only at quarter close, and only for audit purposes. During the quarter, the number should move as the pipeline moves. Locking a mid-quarter number defeats the purpose of a rolling model and forces teams to defend a figure they already know is wrong.
How do you get finance and sales to agree on a moving forecast?
Separate the purposes. Use the rolling number for operational decisions — hiring, spend, resource allocation — and the frozen close snapshot for reporting and audit. Agree in advance which number governs which decision so movement in the rolling figure does not trigger a false alarm.
Sources
- Gartner, "Sales Forecasting: Best Practices for Improving Forecast Accuracy" — https://www.gartner.com/en/sales
- Harvard Business Review, "How to Improve Your Sales Forecast Accuracy" — https://hbr.org
- Salesforce, "Sales Forecasting Guide: How to Forecast Sales" — https://www.salesforce.com/resources/articles/sales-forecasting/
- HubSpot, "Sales Forecasting: The Complete Guide" — https://blog.hubspot.com/sales/sales-forecasting
- McKinsey & Company, "The B2B Pricing and Sales Playbook" — https://www.mckinsey.com/capabilities/growth-marketing-and-sales/our-insights
- Deloitte, "Sales Operations and Forecasting Insights" — https://www2.deloitte.com/us/en/insights.html
- Forrester, "Revenue Operations and Forecasting Research" — https://www.forrester.com/research/
- Corporate Executive Board / Gartner, "The Challenger Sale" research foundation — https://www.gartner.com/en/sales/insights/challenger-sale
Related on PULSE
- What's the difference between *The Challenger Sale* and *SPIN Selling* for closing?
- Solution Selling — Cliff Notes Summary
- How does *The JOLT Effect* differentiate between buyer hesitation and buyer disinterest in enterprise deals?
- Stop Acting Like a Seller by Jerry Acuff — Cliff Notes Summary
- The Innovator's Solution by Christensen and Raynor — Cliff Notes Summary
- Solution Selling by Michael Bosworth — Cliff Notes Summary & Key Takeaways
This page will be disappearing soon. Save it to your device for $1 — or read it free while it is here.
@Kory-White- · if Venmo asks, the last 4 of my number are 2012
This page is gone.
This one is off the shelf now. $1 keeps it on your phone for good — the whole page, pictures and diagrams included.
 bsWhat’s the single most effective tactic from *The Challenger Sale* for shortening a long sales cycle in 2027?
 pulse-booksWhat is the best way to apply the Four Tendencies framework to build a daily reading habit in 2027?
 bsWhat’s the most practical technique from *New Sales. Simplified.* for handling a “send me info” objection?
 bsHow do you apply *The JOLT Effect* to reduce buyer hesitation in enterprise sales?
 bsHow does *Gap Selling* help you compete against a lower-priced competitor without discounting in 2027?
 bsWhat’s the biggest emotional trigger *Gap Selling* says you should never ignore in a buyer conversation?
 bsHow do you use *Never Split the Difference* to handle difficult conversations with customers in 2027?
 bsWhat’s the difference between a "challenger" and a "relationship builder" in *The Challenger Sale* for 2027?
 bsHow do you keep a sales team motivated when quotas keep rising but the market isn't growing in 2027?
 pulse-booksHow much do executive book summary subscriptions like getAbstract or Blinkist cost in 2027?