
The Ideal Customer Profile — Infographic
 Curated byKory White · Fractional CRO · Maryland
 PULSEKNOWLEDGE LIBRARY
Quality
Certified

An Ideal Customer Profile infographic is a visual, one-page reference that distills the firmographic, behavioral, and needs-based attributes of the organizations most likely to buy and benefit from your product. It typically uses icons, flowcharts, and concise data points to help sales and marketing teams focus on high-value leads. The infographic format forces clarity, making the Customer Profile instantly usable in calls, decks, and onboarding materials.
What it is and why it matters
An Ideal Customer Profile is a company-level description, not an individual-level one. It answers the question: "Which organizations should we dedicate our sales and marketing resources to?" The infographic format matters because it forces clarity. A dense 10-page document gets ignored; a single visual that a sales rep can glance at before a call gets used. The best ICP infographics compress three layers of information into one glanceable artifact: firmographics (industry, size, revenue, location), behavioral signals (triggers, engagement patterns, product usage), and fit criteria (must-haves, nice-to-haves, disqualifiers).
Why does this matter for RevOps specifically? Because revenue operations sits at the intersection of sales, marketing, and customer success. When those three teams operate from different definitions of "ideal," pipeline quality degrades, handoffs break, and forecasting becomes guesswork. An ICP infographic gives every team a single source of truth. Marketing uses it to segment campaigns and score leads. Sales uses it to prioritize outreach and qualify opportunities. Customer success uses it to identify expansion candidates and flag at-risk accounts that never fit in the first place.
The stakes are measurable. Companies that align sales and marketing around a shared ICP typically see 36% higher customer retention and 38% higher sales win rates, according to HubSpot research on alignment. Conversely, teams that skip the ICP exercise often waste 20–30% of their pipeline on deals that were never winnable, because the prospect fit was wrong from day one. The infographic format directly addresses this by making the ICP a working tool rather than a theoretical document.

A well-constructed ICP infographic typically includes six core components:
- Firmographic snapshot — industry verticals (2–3 max), employee count range (e.g., 50–500), annual revenue band (e.g., $10M–$100M), geographic focus if relevant.
- Persona mapping — the buyer, champion, and economic decision-maker roles, each with their top goals and frustrations.
- Trigger events — the 2–4 organizational changes that signal buying intent, such as a new VP of Sales, a funding round, or a failed tool implementation.
- Fit criteria — must-haves (e.g., uses Salesforce, has a dedicated marketing team) and nice-to-haves (e.g., has a sales enablement function).
- Anti-ICP traits — 3–5 red flags that disqualify a lead, such as under 10 employees or a price-sensitive procurement culture.
- Quantitative benchmarks — typical deal size, expected LTV, and expansion revenue potential for a fit account.
The infographic format also forces prioritization. If you try to include eight industries, five personas, and a dozen triggers, the visual becomes cluttered and useless. The constraint of a single page forces you to make hard choices about what actually matters — which is exactly the discipline most ICP efforts lack.

The step-by-step process
Building an ICP infographic is not a solo marketing exercise. It requires input from sales reps who hear objections daily, customer success managers who see churn reasons firsthand, and leadership who understand strategic direction. The process below is repeatable, typically takes 2–4 weeks, and produces a document that teams actually use.
Step 1: Mine your best customers. Pull the top 20% of accounts by revenue, retention, or referral value. For most B2B businesses, this cohort generates 60–80% of total profit. Extract from your CRM: total contract value, average deal size, churn rate, LTV, and expansion revenue. Then document firmographics for each account — industry, employee count, revenue range, funding stage, geography — and the job titles of the buyer, champion, and economic decision-maker.
Step 2: Identify common triggers. Look for recurring events that preceded your best deals. Common patterns include: a new VP of Sales or CRO hired within 90 days, a Series A or B funding round, a merger or acquisition, a compliance audit failure, or a failed implementation of a competing tool. In many B2B SaaS companies, 70–80% of top deals share 2–3 trigger patterns.

Step 3: Build the anti-ICP. List customers who churned early, required excessive support, or never expanded. Note their common traits: too small, wrong industry, single decision-maker with no champion, or a price-sensitive procurement culture. Compare this list to your golden 20%. If there is overlap, dig into the sub-niche or trigger that differentiates the good from the bad.
Step 4: Run a 30-minute workshop. Gather 3–5 sales reps, 2–3 customer success managers, and 1–2 marketers. Ask two questions: "What do our best customers have in common that our worst don't?" and "What objections do we hear from prospects who don't fit?" Record answers verbatim — they surface patterns raw data misses.
Step 5: Synthesize into one page. Combine findings into the infographic structure described above. Keep it to one page. Use bullet points, icons, and simple flowcharts — not paragraphs. The visual should be glanceable in under 30 seconds.

Step 6: Operationalize. Embed the ICP into lead scoring (assign points for fit attributes, negative points for anti-ICP traits), outbound targeting (filter lists to 80%+ fit), sales enablement (create ICP-specific talk tracks), and marketing content (case studies for your top verticals).
Step 7: Review quarterly. Markets shift, products evolve, competitors emerge. Schedule a quarterly review where you compare your top 10 deals from the last quarter against the current ICP. If 3 or more don't match, update the profile.
Costs, timelines, and typical ranges
The cost of building an ICP infographic varies dramatically depending on whether you do it internally or hire external help. The range below reflects realistic scenarios for a B2B company with 50–500 employees.

Internal DIY approach (0–5 days of time). If your team already has CRM data, call recordings, and customer success notes, the main cost is time. A focused effort typically takes 2–4 weeks of calendar time, with 3–5 hours of actual work per week spread across a RevOps lead, one sales rep, and one CSM. The workshop takes 30 minutes. The synthesis and design of the infographic takes 4–8 hours if you use a template tool like Canva, Figma, or a dedicated infographic builder. Total cash cost: $0–$100 for template subscriptions.
Agency or consultant approach (3–10 days of work, $3,000–$15,000). A specialized RevOps or marketing agency will typically run customer interviews, analyze your CRM data, and deliver a polished infographic plus a supporting one-page ICP document. The timeline is usually 3–6 weeks. The higher end of the range includes buyer persona development, trigger event analysis, and anti-ICP validation. This is worth it if your team lacks the analytical bandwidth or if your data is messy enough that you need help cleaning and interpreting it.
Design-only approach (1–3 days, $500–$2,500). If you already have the ICP content but need it turned into an infographic, a freelance graphic designer can produce a polished SVG or PNG in a few days. Expect to pay $50–$150 per hour depending on the designer's experience. Make sure to request the source file (Figma, Illustrator, or SVG) so you can update it quarterly without paying again.

Typical ranges for ICP quality metrics after implementation. While exact numbers vary by industry, teams that operationalize a well-built ICP typically see: win rates improve from 15–20% to 25–35%; pipeline volume may drop 10–20% initially (because you're disqualifying bad-fit leads), but revenue quality improves because deal sizes are larger and churn is lower; sales cycle length shortens by 15–25% because you're talking to buyers who have the problem you solve; and customer churn drops by 10–30% because you're acquiring accounts that actually fit.
The hidden cost most teams underestimate is the opportunity cost of a bad ICP. If your ICP is too broad — say, "any company with a website" — your sales team spends 50% of their time on leads that never close. At an average cost of $150–$300 per sales development rep call, that's thousands of dollars per month wasted. Conversely, if your ICP is too narrow — say, "Series B fintech companies in New York with exactly 150 employees" — you starve the pipeline and sales reps start ignoring the ICP entirely. The right range is usually 2–4 ICP segments, each with enough accounts to support your revenue targets.
Where teams get it wrong
The most common failure in ICP work is not the document itself — it's how teams use it. Below are the five mistakes that consistently undermine ICP infographics, along with practical fixes.

Mistake 1: Confusing ICP with buyer persona. An ICP describes the company; a buyer persona describes the individual. Mixing them produces vague profiles like "mid-market healthcare VPs" that miss firmographic nuances. The fix: create two separate documents. The ICP captures company-level attributes; the persona captures role-level goals and frustrations. Map each persona to the ICP so sales knows who to call and what to say.
Mistake 2: Over-relying on revenue as the only fit metric. A high-revenue customer who churns after 6 months is worse than a mid-revenue customer who stays for 3 years. Revenue alone doesn't capture retention, expansion potential, or referral value. The fix: use a composite score that weights revenue at 40%, retention at 30%, and strategic value at 30%. Strategic value includes willingness to provide testimonials, product feedback, and referrals.
Mistake 3: Building the ICP in a vacuum. Founders and marketers often create ICPs from assumptions or early-adopter data. Without sales and customer success input, the ICP misses real-world friction. The fix: run the 30-minute workshop described above. Ask reps what objections they hear from non-fit prospects and ask CSMs why customers churn. Their answers will surface patterns that raw data misses.

Mistake 4: Treating the ICP as static. An ICP that worked two years ago is likely outdated. Market shifts, product evolution, and competitive pressure all change who your best customer is. The fix: schedule a quarterly review. Compare your top 10 deals from the last quarter against the current ICP. If 3 or more don't match, update the profile. Also track win rates by ICP segment — if a segment's win rate drops below 20%, investigate whether it's still ideal.
Mistake 5: Ignoring the "not yet" segment. Some prospects match your ICP on firmographics but lack a trigger event. They're not ready to buy today, but they could be in 6–12 months. Many teams either ignore them (lost opportunity) or treat them as active leads (wastes time). The fix: create a separate nurture segment for ICP-fit accounts without triggers. Set up a 90-day automated email sequence that educates on pain points and trigger events. When a trigger occurs — say, they hire a new VP — move them to active pipeline.
A sixth mistake worth naming: teams set ICP criteria too loosely to avoid missing deals. This is understandable — pipeline pressure is real — but it dilutes the entire exercise. A focused ICP can double win rates even if it reduces total pipeline volume by 20%. Quality over quantity is the entire point of an Ideal Customer Profile.

Decision framework: when to choose what
An ICP infographic is not the only targeting tool available. Depending on your business model, data maturity, and go-to-market motion, you may need to combine it with other frameworks. The decision tree below helps teams choose the right combination.
Product-led growth (PLG). If your product is self-serve with a free tier, the ICP infographic should emphasize behavioral signals over firmographics. Sure, industry and company size matter for expansion deals, but the primary fit signal is user-level activation: do users invite teammates within 14 days, reach the "aha" moment, and adopt core features? The infographic for PLG companies typically shows a usage funnel alongside firmographic data, with the trigger being "user count hits 5+ within the first month."
Sales-led growth (enterprise, high ACV). If your average deal size is $50K or more, the ICP infographic should heavily emphasize firmographics, decision-maker roles, and procurement processes. Sales reps need to know who to call, what title to target, and what budget range to expect. The infographic should include persona mapping with the economic buyer's typical objections and the champion's typical motivations. Triggers are organizational events, not product usage signals.

Hybrid model (PLG + sales, $5K–$50K ACV). This is the most common pattern in modern B2B SaaS. The infographic needs both layers: firmographic fit (industry, size, revenue) and behavioral fit (product usage, feature adoption, expansion signals). The trigger overlay is critical — a free-tier user who hits the usage limit or a champion who moves to a new company are both sales triggers. The infographic should visually separate "fit" from "intent" so sales knows which accounts to prioritize.
Data maturity considerations. If your CRM data is messy or incomplete, start with a simplified ICP based on your top 10–15 accounts. A sample of 10–15 high-value accounts can still reveal strong signals — just be wary of over-indexing on one outlier. As your data improves, refine the ICP quarterly. If you lack the tooling to track behavioral signals, start with firmographics alone and add behavior later.
When to update the infographic. The visual itself should be refreshed whenever you change your ICP criteria, add a new product line, or enter a new market. The quarterly review process will tell you when. If the infographic starts collecting dust — say, reps stop referencing it — that's a sign it's either outdated, too complex, or not operationalized in your tools. The fix is usually simplification, not more data.
Related questions
How is an ICP different from a buyer persona?
An ICP describes the target company — its industry, size, revenue, and pain points — while a buyer persona describes the individual decision-maker within that company. The infographic format typically covers both layers: firmographics for the company and role-based goals for the buyer, champion, and economic decision-maker.
How often should a company update its ICP?
Most businesses review their ICP every 6 to 12 months, or whenever they enter a new market or launch a major product update. The infographic should be refreshed quarterly if you track win/loss data and see segments underperforming. A segment with a win rate below 20% needs investigation.
Can a company have more than one ICP?
Yes, especially if you serve multiple distinct market segments or product lines. The infographic format works well for 2–4 ICPs — beyond that, the visual becomes cluttered and sales teams lose focus. Each ICP should have its own one-page visual, not a single crowded document.
What are the core components of a strong ICP?
The infographic lists components such as industry vertical, company size (e.g., 50–500 employees), revenue range (e.g., $10M–$100M), geographic location, technology used, and common pain points. A well-defined ICP also includes buying triggers and decision-making processes.
How do you validate that a customer fits your ICP?
Analyze historical data from your best customers — those with high lifetime value, low churn, and strong referrals. Run small-scale tests with targeted outreach to a sample of prospects matching your ICP criteria, then compare conversion rates and retention. The infographic should be updated based on what the data shows.
FAQ
What exactly is an Ideal Customer Profile (ICP)? An Ideal Customer Profile is a detailed description of the type of company that would benefit most from your product or service. It focuses on firmographic, behavioral, and needs-based criteria rather than individual buyer personas. The infographic breaks down key components like industry, company size, revenue range, and pain points.
How is an ICP different from a buyer persona? A buyer persona describes the individual decision-maker — their goals, challenges, and role — while an ICP defines the target company itself. The infographic highlights that ICPs include factors like annual revenue, employee count, and tech stack, whereas personas focus on personal motivations and job responsibilities.
How often should a company update its ICP? Most businesses review their ICP every 6 to 12 months, or whenever they enter a new market or launch a major product update. The infographic suggests tracking win/loss data and customer feedback to refine the profile over time, as markets and customer needs evolve.
What are the core components of a strong ICP? The infographic lists components such as industry vertical, company size (e.g., 50–500 employees), revenue range (e.g., $10M–$100M), geographic location, technology used, and common pain points. A well-defined ICP also includes buying triggers and decision-making processes.
Can a company have more than one ICP? Yes, especially if you serve multiple distinct market segments or product lines. The infographic recommends creating separate ICPs for each segment, but warns against having too many — typically 2 to 4 is manageable — to avoid diluting sales and marketing efforts.
How do you validate that a customer fits your ICP? The infographic suggests analyzing historical data from your best customers — those with high lifetime value, low churn, and strong referrals. You can also run small-scale tests with targeted outreach to a sample of prospects matching your ICP criteria, then compare conversion rates and retention.
Sources
- Harvard Business Review — B2B marketing strategy and customer segmentation
- Gartner — Market research on buyer personas and ideal customer profiles
- HubSpot — Inbound marketing guides and ICP frameworks
- Salesforce — CRM best practices and customer data analysis
- McKinsey & Company — Business-to-business customer insights and targeting
- Forrester Research — Buyer behavior and account-based marketing methodologies
Related on PULSE
This page will be disappearing soon. Save it to your device for $1 — or read it free while it is here.
@Kory-White- · if Venmo asks, the last 4 of my number are 2012
This page is gone.
This one is off the shelf now. $1 keeps it on your phone for good — the whole page, pictures and diagrams included.
 graphicThe Weekly Rep Cadence — Infographic
 graphicThe Renewal Playbook — Infographic
 graphic4 Forecast Categories — Infographic
 graphicThe Cold Call Framework — Infographic
 graphicThe Value Selling Ladder — Infographic
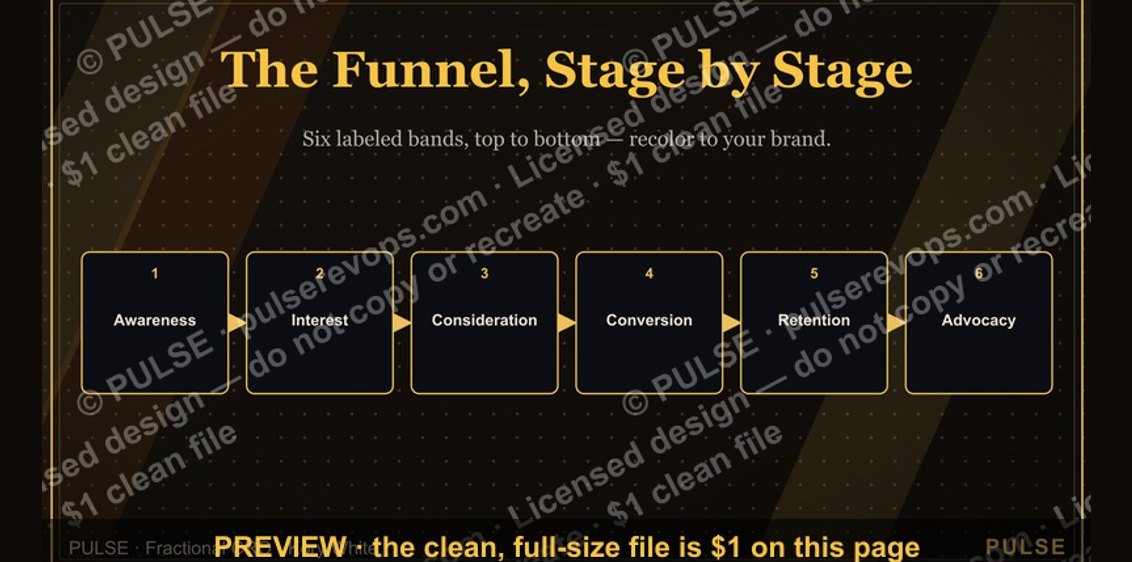 graphicThe Marketing Funnel — Infographic
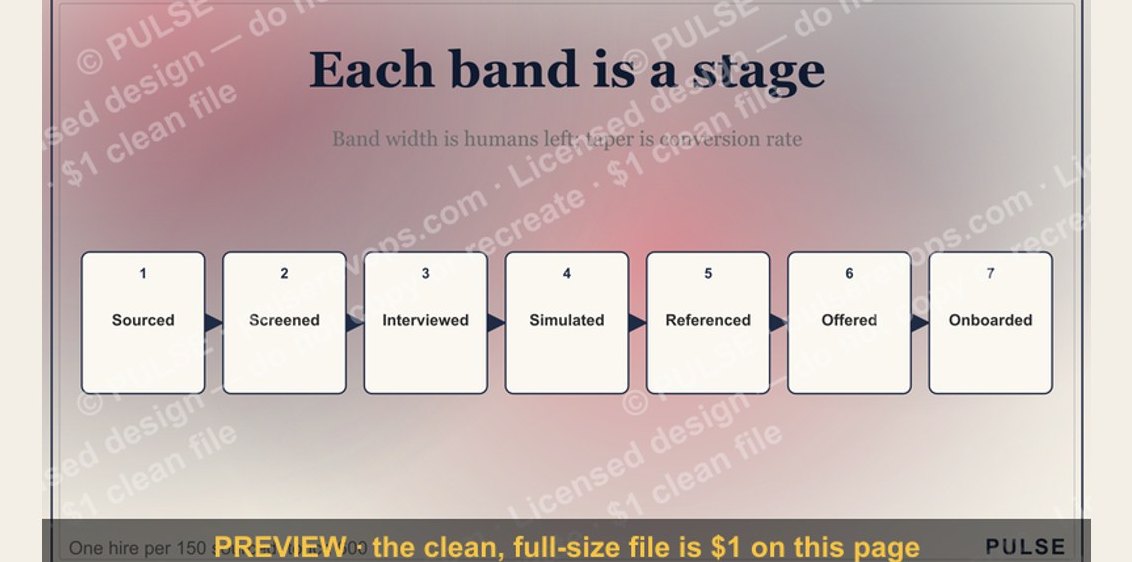 graphicThe Sales Hiring Funnel — Infographic
 graphicMEDDIC Qualification — Infographic
 graphic5 Stages of the Buyer’s Journey — Infographic
 graphic5 Signs a Deal Is Real — Infographic