
AI does 60% of SDR work — RevOps Banner
 Curated byKory White · Fractional CRO · Maryland
 PULSEKNOWLEDGE LIBRARY
Quality
Certified
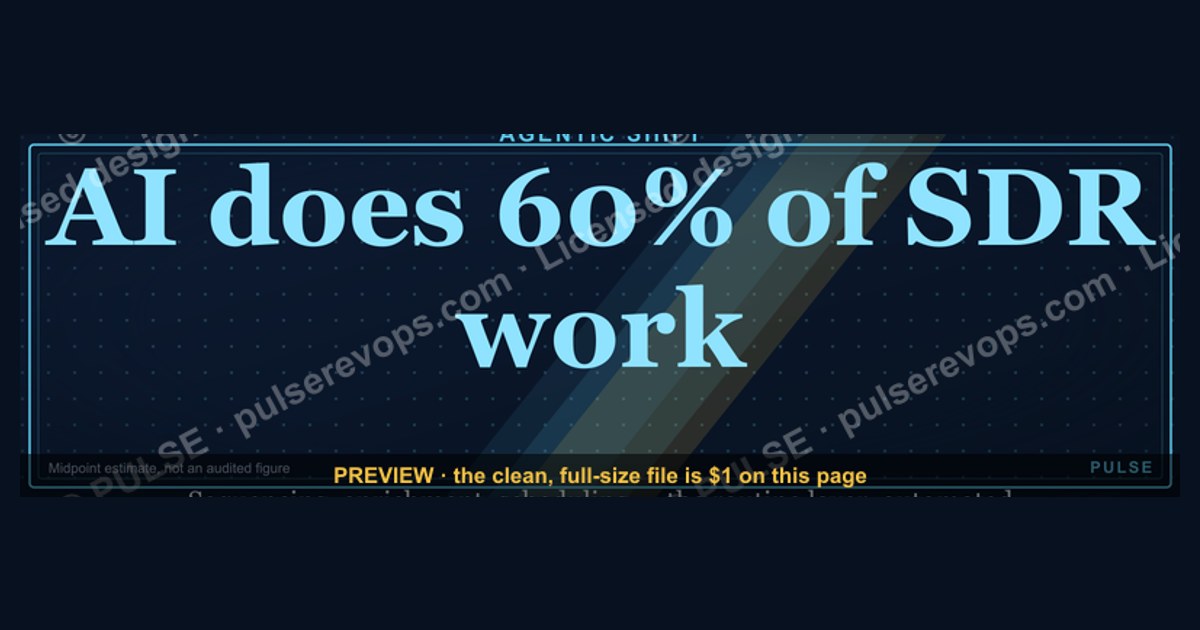

This is a downloadable LinkedIn banner, 1600x500 px, that reads "AI does 60% of SDR work" in bold type on a dark background. RevOps leaders use it to start a conversation about how much prospecting automation their team actually runs — and whether the remaining human 40% is being spent on the work that closes deals.
The outcome you should expect
When a RevOps team puts a claim like "AI does 60% of SDR work" in front of an audience, the reaction splits into three predictable camps, and knowing which camp you are talking to determines whether the banner helps or hurts you.
The first camp is the operator who already suspects the number is roughly right. Their SDRs spend the morning in a sequencing tool, the afternoon in a dialer, and the evening logging dispositions. If you asked them to itemize the day, they would say something like: list building and enrichment is automated, first-touch email is automated, follow-up cadence is automated, meeting scheduling is automated, and the only genuinely human minutes are the discovery call itself and the awkward middle of a negotiation. That is a defensible path to a 55-65% automation figure for the *activity* layer of the job. This operator nods at the banner and forwards it to their VP.
The second camp is the skeptic who has heard a vendor pitch this number before and watched it fall apart in a quarterly review. They will ask the only question that matters: 60% of *what*? Sixty percent of emails sent is not the same as sixty percent of pipeline created. Sixty percent of tasks completed is not the same as sixty percent of qualified meetings held. If your banner does not survive that question, it becomes a liability — a screenshot someone uses to argue that RevOps is overstating its impact.

The third camp is the SDR themselves, and this is the group most banner campaigns forget. An SDR reading "AI does 60% of your work" on a LinkedIn feed does not hear a productivity statistic. They hear a headcount argument. If your internal rollout of this banner is not paired with a clear statement about what the human 40% becomes — higher-value conversations, better territory, less list-scrubbing — you will get quiet resistance, slower adoption of the very tools the banner celebrates, and a spike in attrition among your best reps.
So the realistic outcome of publishing this banner is not "everyone agrees AI does 60% of SDR work." It is "everyone now has an opinion about which 60%," and your job as the RevOps owner is to be the person with the cleanest answer. That means having a measurement framework ready before the banner goes live, not after. It means being able to say, on the same slide, "here is the activity automation rate, here is the pipeline contribution rate, and here is why they are different numbers." Teams that do this convert the banner into an internal alignment tool. Teams that do not spend the next two quarters defending a number they never defined.
The second-order outcome is subtler. Once you publish a specific figure, you have created a benchmark whether you meant to or not. Your own leadership will hold you to it. If your SDR organization is at 35% activity automation and the banner says 60%, you have just set a target you did not choose. Before you post, decide whether 60% is a description of where the market is, where your team is, or where you want your team to be — and be explicit about which one, because your audience will assume the most flattering reading and your CFO will assume the least.
What drives that outcome
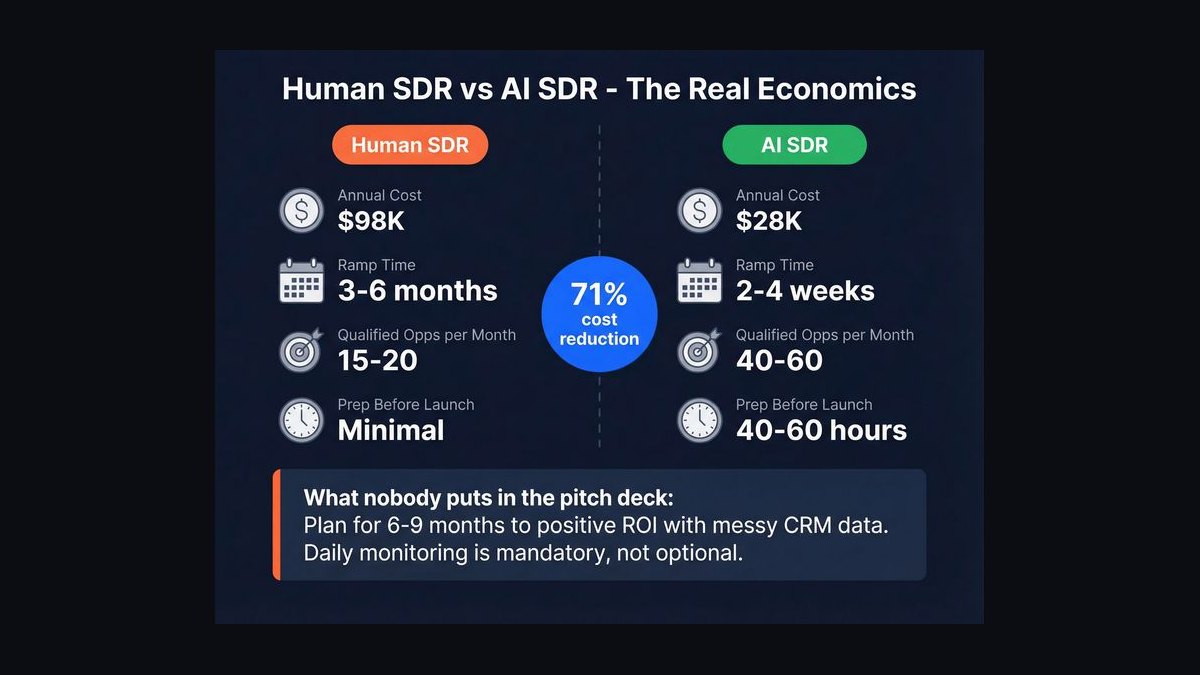
The 60% figure is not a single measurement. It is the sum of several distinct automation layers, each of which can be high or low independently. Understanding which layers are automated in your own organization is the only way to know whether the banner describes you.
The weighting matters enormously. If you count by *tasks completed*, live conversation is a tiny fraction of the day and the weighted average lands near 60%. If you count by *time spent*, live conversation dominates and the same organization looks 30% automated. If you count by *pipeline influenced*, the number depends almost entirely on whether your AI-assisted sequences are producing meetings that convert at the same rate as human-sourced ones — and in most organizations they are not, at least not at first.
Three forces push the number up. First, data availability: the more complete your contact and account data, the more of the list-building and enrichment layer can be automated without human review. Second, sequence maturity: teams that have run the same outbound motion for several quarters have enough performance data to let a model pick send times, subject lines, and follow-up cadence without a rep's judgment. Third, tooling integration: when the dialer, the sequencer, and the CRM share a single record, the logging and hygiene layer collapses from a manual chore into a background process.
Three forces push it down. First, deliverability risk: aggressive automation gets domains burned, and every burned domain forces a human back into the loop to rebuild sender reputation. Second, compliance and consent: regulated industries and certain geographies require human review of outbound contact, which caps the sequencing layer regardless of what the tool can do. Third, personalization depth: the moment a message needs a genuine reference to something the prospect said or did, the automation rate for that message drops toward zero, because the model is generating from a template, not from a relationship.
The practical implication is that "AI does 60% of SDR work" is a statement about a *configuration*, not a *capability*. Two companies with identical tool stacks can sit at 40% and 70% depending on how much human review they have chosen to keep in the loop. That is why the banner is useful as a conversation starter and dangerous as a target.
Benchmarks and realistic ranges
Because the 60% figure circulates without a standard definition, the most useful thing a RevOps leader can do is publish their own definition alongside their own number. Below are the ranges that tend to show up across B2B SaaS sales organizations, expressed as activity automation rate unless otherwise noted.
List building and contact enrichment sits at 80-95% automation in teams using a modern data provider with a CRM sync. The human work that remains is exception handling: verifying a title change, resolving a duplicate account, deciding whether a contact is worth sequencing at all. Teams without a data provider sit closer to 40-60% because reps are still copying from LinkedIn into spreadsheets.
Outbound email sequencing runs 70-90% automated in mature teams. The variable is not the sending — that is fully automated — but the reply handling. A team that routes every reply to a human for a written response will report a much lower automation rate than a team that lets the model classify replies into interested, not now, and not interested, and auto-handles the last two.
Inbound lead qualification is the widest range in the set, 40-70%. Chat-based qualification and form-to-meeting routing can be heavily automated, but the moment a prospect asks a question the model cannot answer confidently, a human takes over. The automation rate here is essentially a measure of how well your knowledge base covers the questions your buyers actually ask.
Meeting scheduling is the most automated layer at 85-95%. Calendar links, timezone handling, reminder sequences, and rescheduling are almost entirely machine-driven in any organization that has adopted a scheduling tool. The residual human work is the no-show follow-up, which many teams still do manually.
CRM hygiene and activity logging runs 60-85% automated. Auto-logged calls, auto-captured emails, and auto-updated stages cover most of it. The gap is in the judgment fields — next step, competitor mentioned, budget signal — which reps still fill in by hand because the model cannot reliably extract them from a call transcript without a human confirming the interpretation.
Live conversation automation is 5-20% and should stay there. Real-time coaching prompts, call summaries, and next-step suggestions are the realistic ceiling. Any team claiming higher is usually counting the *preparation* for the call as part of the call.
Weighted across a typical day by task count, these layers produce a composite of 55-65%. That is where the 60% figure comes from, and it is a defensible number *if you say so explicitly*. Weighted by time spent, the same organization lands at 30-40%. Weighted by pipeline contribution, most teams are honest to report 20-35%, because AI-sourced meetings historically convert at a lower rate than human-sourced ones until the sequences have been tuned for several quarters.
The benchmark that matters most for a RevOps leader is not the composite. It is the ratio of activity automation to pipeline contribution. A team at 60% activity automation and 15% pipeline contribution is running a volume machine that is not converting. A team at 45% activity automation and 30% pipeline contribution is running a precision machine. The second team is the one you want to be, and the banner should not be allowed to obscure that.
Risks, edge cases, and failure modes
The first and most common failure mode is definition drift. The banner says 60%, someone in the comments asks "60% of what," and the person who posted it does not have an answer. Within a week the number has been reinterpreted three different ways in three different Slack channels, and the original post is now a source of confusion rather than alignment. The fix is to publish the definition in the same place as the number, always, even when it makes the post less punchy.
The second failure mode is the vanity metric trap. Activity automation is easy to measure and easy to inflate. A team can push its number from 55% to 75% by automating more follow-up touches, more re-engagement sequences, and more no-show recovery — all of which increase activity without increasing pipeline. If your banner campaign is not paired with a pipeline-side metric, you have given your team permission to optimize the wrong thing.
The third failure mode is SDR morale. This is the one that shows up in attrition data six months later. An SDR who reads "AI does 60% of your work" and has not been told what happens to the other 40% will assume the worst. The teams that handle this well do two things: they show the SDR what the freed-up time is *for* (deeper discovery, multi-threading, executive engagement), and they tie compensation to the outcomes that freed-up time produces, not to the activity it replaces. The teams that handle it badly post the banner, run a tool rollout, and then wonder why their best rep left for a company that "still values humans."
The fourth failure mode is deliverability collapse. Automation at scale means more sends, and more sends from a domain that has not been warmed means spam folder. A team that pushes its sequencing automation rate from 70% to 90% without throttling volume will see reply rates fall before they see them rise. The edge case here is the team that measures automation rate but not inbox placement — they will not notice the problem until a quarter of pipeline has quietly evaporated.
The fifth failure mode is compliance exposure. In regulated industries and in certain jurisdictions, automated outbound contact carries disclosure and consent requirements that a human-driven motion does not. A banner that celebrates automation without acknowledging this will read as tone-deaf to anyone in legal or compliance, and it will make your tool rollout harder, not easier.
The sixth failure mode is the reverse of all the others: under-automation justified by the banner. A team that reads "AI does 60% of SDR work" and concludes "so we are already done" will stop investing in the layers that are still manual. The banner is a snapshot, not a destination. The teams that get the most from it treat the 60% as a floor and keep pushing the layers where automation is still low — inbound qualification, reply handling, and the judgment fields in CRM — because those are where the next ten points of leverage actually live.
A practical rollout plan
If you are going to use this banner, use it as the opening slide of a measurement conversation, not as a standalone post. The sequence below is the one that tends to work in organizations of 20 to 200 SDRs.
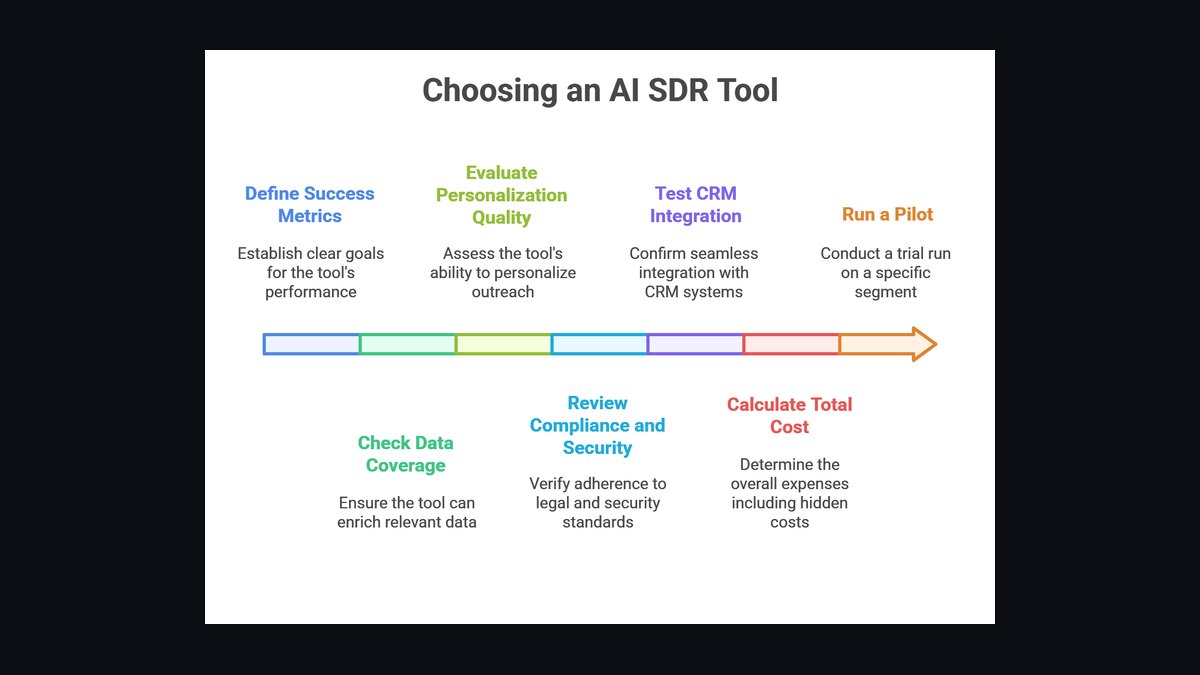
Step one is to write down your definition before you write anything else. Pick one: activity automation rate by task count, by time, or by pipeline contribution. Write the formula. Write the data sources. Write the exclusions — for example, "live conversation is excluded because it is not automatable." This document is the thing that makes the banner defensible.
Step two is to baseline your own layers using the ranges above as a sanity check. Pull the actual numbers from your sequencer, your dialer, your CRM, and your scheduling tool. Most RevOps teams find that their sequencing and scheduling layers are higher than they expected and their inbound qualification and CRM judgment layers are lower. That gap is your roadmap.
Step three is to publish the banner with the definition attached. On LinkedIn, that means the first comment carries the definition and the caveats. Internally, it means the banner is the title slide and the definition is the second slide. Never let the number travel without its definition.
Step four is the internal alignment session, and this is where the SDR morale risk gets handled. Show the team the layer-by-layer breakdown. Show them which parts of their day are automated and which are not. Show them what the freed-up time is expected to produce, and show them how that shows up in their comp plan. If you cannot show the last part, do not run the session yet.
Step five is the pipeline-side target. Pick one metric that the automation is supposed to move — qualified meetings held, pipeline created, or stage-one conversion — and set a target for it that is separate from the activity target. This is the guardrail against vanity automation.
Step six is the tooling rollout, scoped to the lowest-automated layer that has the highest pipeline leverage. In most organizations that is inbound qualification or reply handling, not more outbound volume.
Step seven is the 30/60/90 review. At 30 days, check activity metrics and deliverability. At 60 days, check reply rates and meeting conversion. At 90 days, check pipeline contribution. If activity is up and pipeline is not, stop adding volume and diagnose the conversion gap. If both are up, expand automation to the next layer.
The plan is deliberately unglamorous. The banner is the fun part; the plan is the part that determines whether the banner was a good idea.
Related questions
Does AI really do 60% of SDR work?
It depends entirely on how you count. By task count across a typical day, 55-65% is a defensible range for a well-tooled team. By time spent, the same team is closer to 30-40%. By pipeline contribution, most teams are honest to report 20-35%.
What counts as "SDR work" in this figure?
List building, enrichment, sequencing, inbound qualification, scheduling, and CRM logging are the layers usually counted. Live conversation is typically excluded because it is not automatable. The exclusion is what makes the composite land near 60% rather than near 40%.
Is this banner a benchmark or a target?
It is a description of a configuration, not a capability. Two teams with identical tools can sit at 40% and 70% depending on how much human review they keep in the loop. Treat it as a conversation starter, not a goal.
What is the biggest risk of publishing it?
Definition drift. If you post the number without defining it, your audience will assume the most flattering reading and your CFO will assume the least. Publish the formula alongside the figure, every time.
How do I adapt the banner for my own team?
Change the percentage to your own measured activity automation rate, and add a second line naming the pipeline metric you are tracking. A banner that says "AI does 47% of our SDR work, and we are measuring what the other 53% produces" is more credible than the generic version.
FAQ
Why 60% and not some other number? Sixty percent is the rough midpoint of the weighted activity automation ranges that show up across B2B SaaS sales organizations. It is not a measured industry average from a single study, and it should not be cited as one. It is a round number that captures the shape of the change — most of the repetitive work is automated, most of the judgment work is not.
Does this banner apply to enterprise sales teams? Less directly. Enterprise SDR motions involve more research, more multi-threading, and more compliance review, all of which push the automation rate down. A 40-50% figure is more realistic for enterprise, and the banner should be adjusted accordingly rather than posted as-is.
What tools are usually behind a 60% figure? A data and enrichment provider, an outbound sequencing platform, a dialer, a scheduling tool, and a CRM with native automation. The specific vendors matter less than the integration: the layers only compound when they share a single record.
How does this affect SDR compensation? It should shift comp away from activity metrics and toward outcome metrics. If AI is doing the activity, paying reps for activity is paying them for something they did not do. Teams that have made this shift report better retention and better pipeline quality.
Will AI replace SDRs entirely? Not at the layers that matter. Live conversation, multi-threading, and the judgment calls inside a deal are the 40% that automation has not touched, and the evidence so far suggests they are the 40% that determines whether pipeline converts. The role changes shape; it does not disappear.
How do I measure my own automation rate? Pick a counting method — tasks, time, or pipeline — and apply it consistently across the layers listed above. Pull the numbers from your tools, not from memory. Publish the method alongside the result so the number can be compared quarter over quarter.
Sources
- LinkedIn Marketing Solutions — banner and ad specifications: https://business.linkedin.com/marketing-solutions
- Salesforce — State of Sales research: https://www.salesforce.com/resources/research-reports/state-of-sales/
- HubSpot — sales automation and SDR benchmarks: https://blog.hubspot.com/sales
- Gartner — sales automation and revenue operations research: https://www.gartner.com/en/sales
- Forrester — B2B sales and revenue operations research: https://www.forrester.com/research/
- Harvard Business Review — sales automation and the future of the SDR role: https://hbr.org/topic/sales
- McKinsey — B2B sales and AI in the revenue function: https://www.mckinsey.com/capabilities/growth-marketing-and-sales/our-insights
- Salesloft — outbound sequencing benchmarks: https://www.salesloft.com/resources
- Outreach — sales engagement research: https://www.outreach.io/resources
Related on PULSE
- How to measure activity automation rate without inflating it
- What the human 40% of SDR work actually consists of
- Building a pipeline-side guardrail for AI sales tooling
- SDR compensation models when AI owns the activity layer
- Deliverability risk in high-automation outbound motions
- Rolling out AI sales tools without losing your best reps
This page will be disappearing soon. Save it to your device for $1 — or read it free while it is here.
@Kory-White- · if Venmo asks, the last 4 of my number are 2012
This page is gone.
This one is off the shelf now. $1 keeps it on your phone for good — the whole page, pictures and diagrams included.
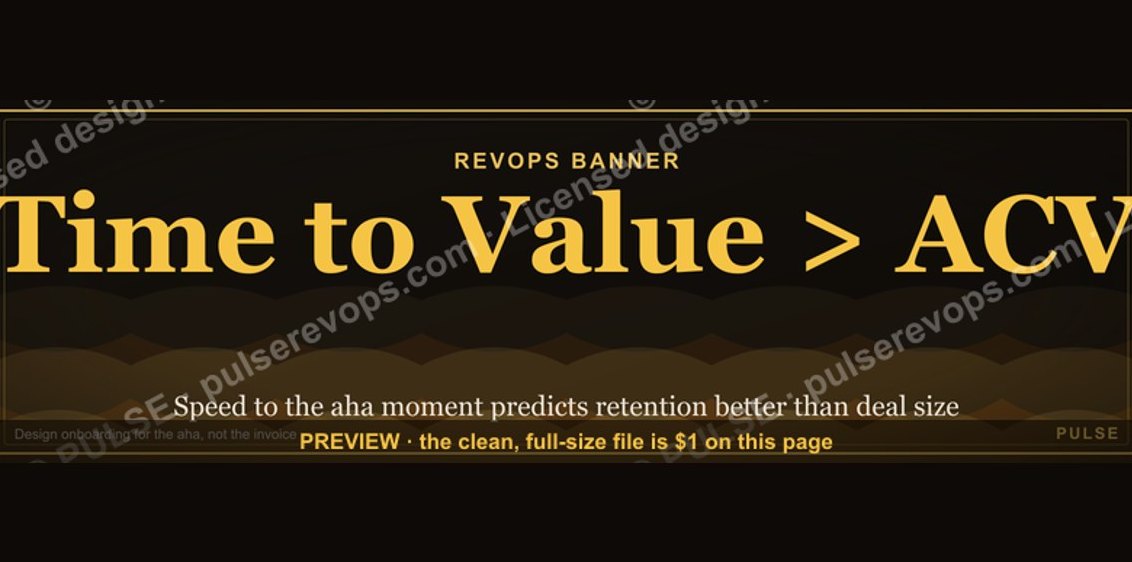 graphicTime to Value > ACV — RevOps Banner
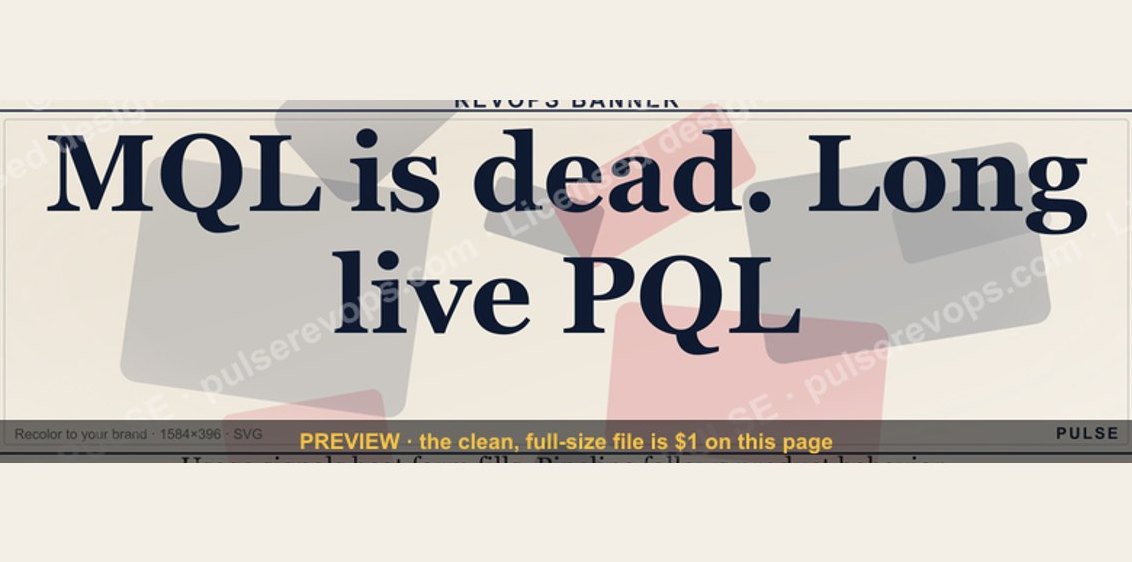 graphicMQL is dead. Long live PQL. — RevOps Banner
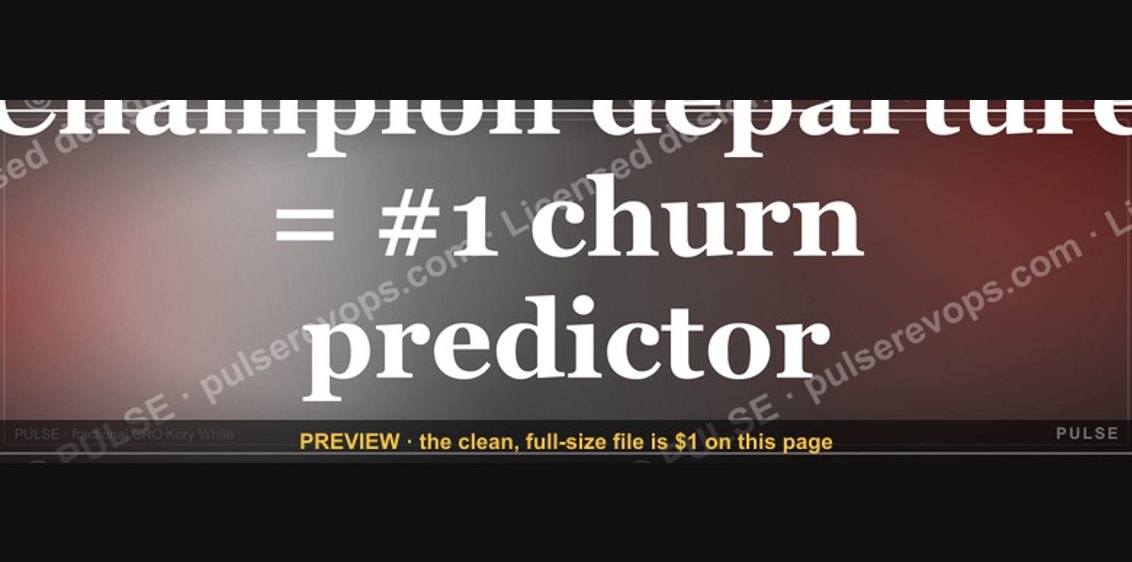 graphicChampion departure = #1 churn predictor — RevOps Banner
 graphicOutcome pricing beats seat pricing — RevOps Banner
 graphicForecast Bands Beat Point Estimates — Stat Card
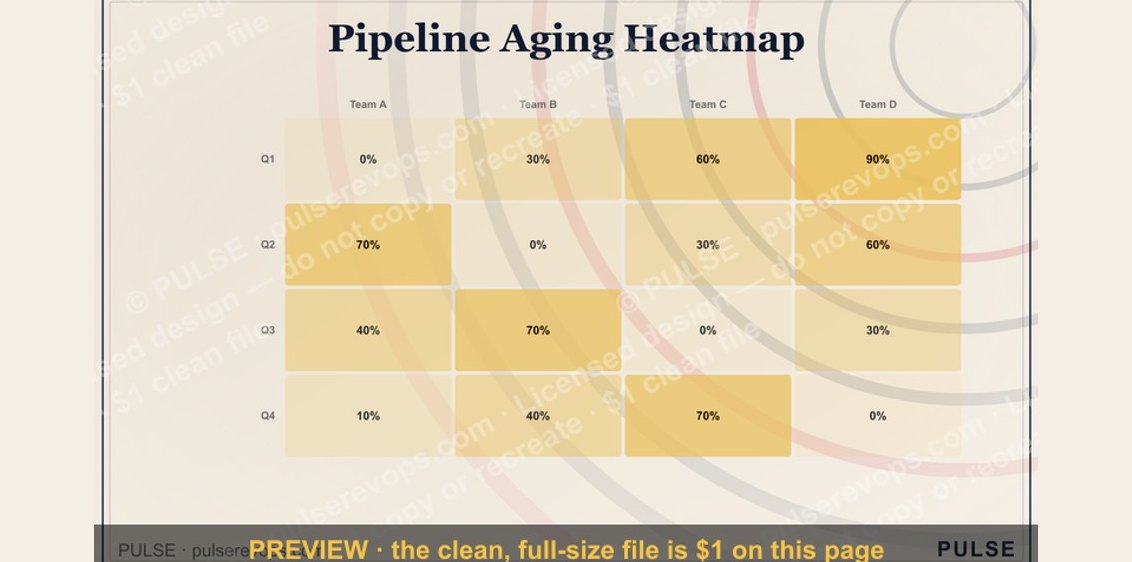 graphicPipeline Aging Heatmap
 graphicAE Comp Plan Pie — 50/50 Split
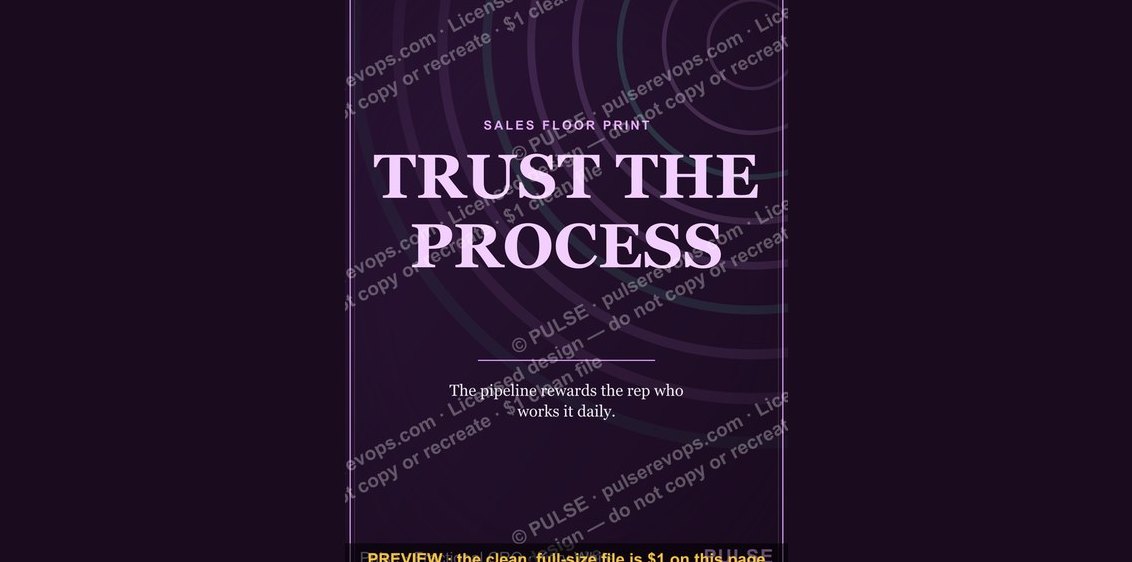 graphic“TRUST THE PROCESS” — Sales Floor Print
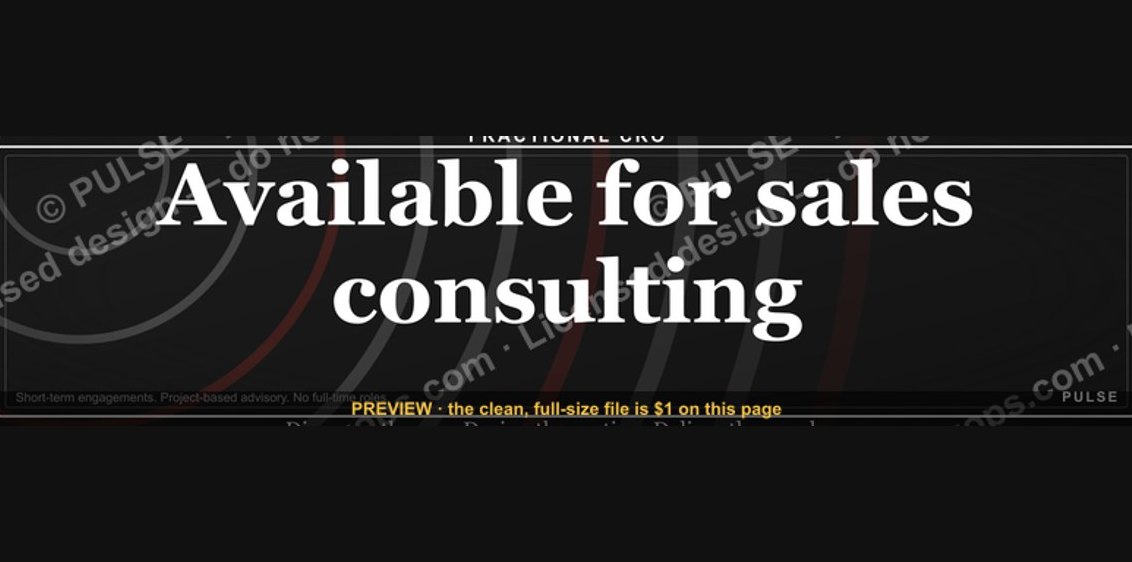 graphic“Available for sales consulting.” — LinkedIn Banner
 graphicGTM Org Wheel