
What's a realistic CAC payback for SMB vs mid-market vs enterprise?

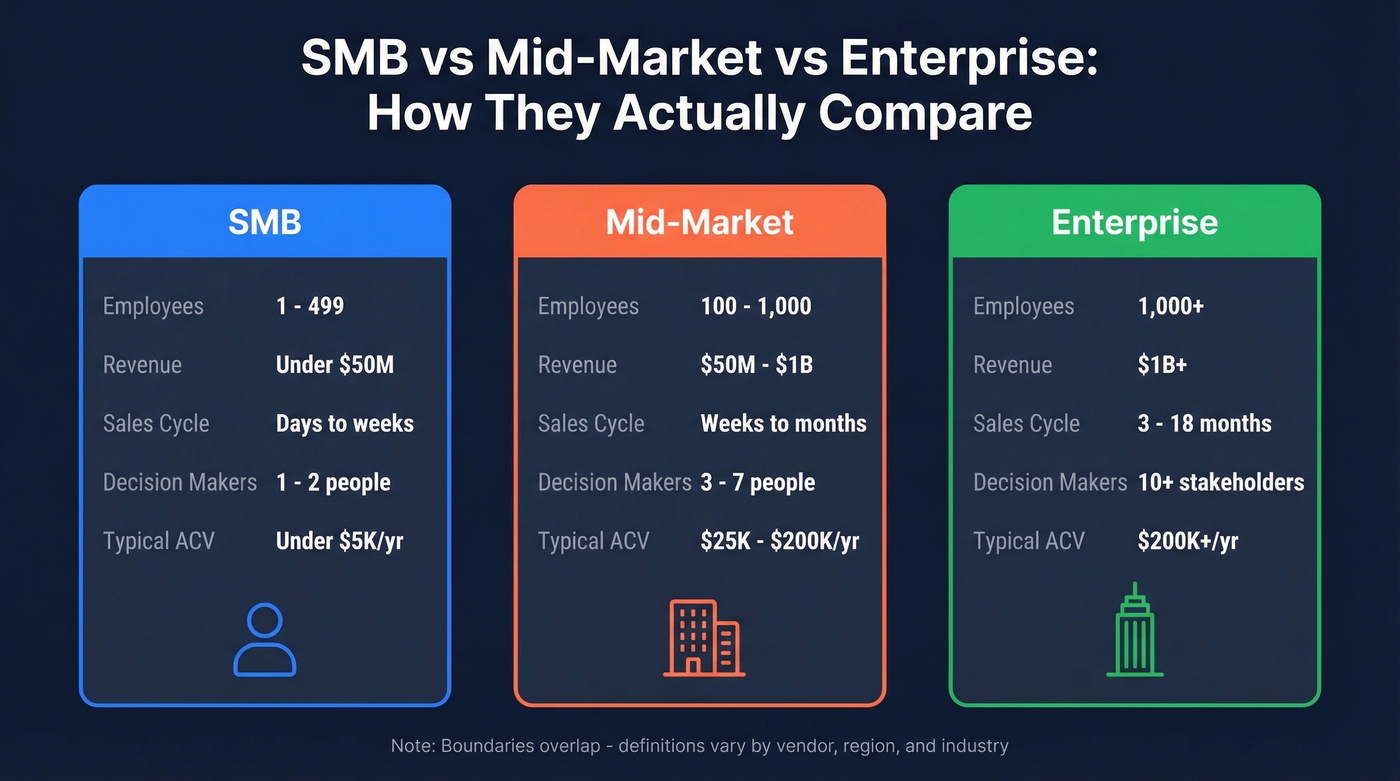

A realistic CAC payback period is segment-specific, not a universal number — anyone quoting a single "12 months" benchmark for all of SaaS is hiding a broken motion somewhere. Computed the honest way (fully-loaded CAC, gross-margin-adjusted, new-business only), the healthy bands are: SMB ($1K-$15K ACV) 5-12 months; mid-market ($15K-$75K ACV) 12-20 months; enterprise ($75K-$500K ACV) 18-30 months; strategic / named accounts ($500K+ ACV) 24-36+ months.
These are *bands to land inside*, not targets to minimize. The single non-negotiable rule: CAC payback is meaningless without the retention number next to it. A 12-month SMB payback paired with 30% gross annual churn is a worse business than a 30-month enterprise payback paired with 95% logo retention and 120% net revenue retention — the enterprise customer keeps paying and expanding for a decade, the SMB customer is gone before margin compounds.
Always pair payback with LTV:CAC (3:1+, segment-adjusted), the Magic Number (>0.75 means efficient growth), and the Rule of 40, and always compute it fully-loaded and margin-adjusted — the raw, marketing-only version flatters you by 25-60%.
What CAC Payback Period Actually Measures
1.1 The Question The Metric Answers
CAC payback period answers one question: how many months of gross profit from a new customer does it take to recoup the fully-loaded cost of acquiring that customer? It is the single best cash-efficiency metric in SaaS because, unlike LTV:CAC, it does not require forecasting a customer's entire future.
Cash back in 9 months can be redeployed almost three times in two years; cash back in 30 months ties up the balance sheet and forces you to raise capital just to keep growing. Payback is also harder to game than LTV:CAC — it does not depend on a speculative lifetime assumption, which is why David Skok's "SaaS Metrics 2.0" framework places months-to-recover-CAC at the center of cash-efficiency analysis.
1.2 The Canonical Formula
The formula is CAC Payback (months) = Fully-Loaded CAC / (New ACV x Gross Margin %) x 12, or equivalently Fully-Loaded CAC / Monthly Gross Profit per New Customer. Two variations matter enormously:
- Gross-margin-adjusted vs raw: The raw version divides CAC by ACV and pretends you keep 100% of revenue. You keep gross margin. At 78% gross margin, the raw payback understates the true number by 28%. Always use the margin-adjusted version.
- Blended vs new-business-only: Blended CAC mixes new-logo acquisition cost with expansion and renewal cost, deflating CAC and flattering payback. Use new-business-only to diagnose the acquisition engine; use a separate net-of-expansion view for the whole-company picture.
1.3 A Worked Example
A mid-market SaaS company spends $4.2M on S&M in a quarter (fully loaded), signs 70 new customers at $48K average ACV, runs 80% gross margin.
| Step | Calculation | Result |
|---|---|---|
| Fully-loaded CAC | $4.2M / 70 customers | $60,000 |
| Annual gross profit per customer | $48,000 x 0.80 | $38,400 |
| Monthly gross profit per customer | $38,400 / 12 | $3,200 |
| CAC payback (margin-adjusted) | $60,000 / $3,200 | 18.75 months |
| CAC payback (raw, wrong) | $60,000 / $4,000 | 15 months |
The 18.75 months is a healthy mid-market number; the raw version produces 15 — a 20% optimistic distortion that leads to over-hiring. The companion deep-dive on the CAC numerator is (q92).
What Counts In Fully-Loaded CAC
2.1 The Complete Cost List
The phrase "fully-loaded" does all the work in this metric, and it is where most companies quietly cheat. A defensible CAC includes every dollar spent to land a new customer:
- All sales compensation: AE base salaries, commission actually paid, accelerators, SPIFs.
- All SDR / BDR cost: base, commission, and the management layer above them.
- All marketing program spend: paid media, events, content production, ABM platforms, webinars, field marketing.
- All marketing headcount: demand generation, product marketing, marketing ops, the CMO's salary.
- Sales engineering and solutions consulting plus sales leadership and RevOps: VP Sales, enablement, deal desk.
- The entire GTM tech stack: CRM, sales engagement, intent data, conversation intelligence, CPQ, marketing automation.
- A fair allocation of overhead: the finance, IT, HR, facilities, and software costs that support the GTM org.
2.2 The Seven Exclusions Teams Make
The exclusions are remarkably consistent. The honest discipline is to name exactly what you exclude.
| Exclusion | Typical distortion | Where it hides |
|---|---|---|
| SDR / BDR cost | Understates CAC 15-30% | "Pipeline generation" line |
| Sales engineers / SCs | SE = 20-35% of true enterprise CAC | "Product" or "post-sale" |
| Sales leadership / RevOps | Several points of CAC | "G&A" |
| Marketing salaries | Counts ad spend, not the team | "Headcount, not program" |
| GTM tooling stack | $2K-$8K per rep per year | "IT" or "software" |
| Brand / PR / awareness | Variable, often material | "Not attributable" |
| Onboarding / implementation | When CAC-like and pre-revenue | "Customer success" |
2.3 The Reconciliation Test
The discipline test: take total S&M expense from the income statement, confirm it ties to the general ledger, then allocate it across segments and channels. If your "CAC" is materially smaller than (S&M expense / new customers), you are excluding something. The most honest companies reconcile CAC to the P&L every quarter.
The reconciliation discipline across all RevOps metrics is covered in (q116).
Benchmark CAC Payback By Segment
3.1 The Segment Map
This segment map holds up against public-company data and venture benchmarking surveys — all gross-margin-adjusted, fully-loaded, new-business payback in months.
| Segment | ACV band | Healthy payback | Sales motion | Cycle length |
|---|---|---|---|---|
| SMB | $1K-$15K | 5-12 months | Self-serve / low-touch inside sales | Days to weeks |
| Mid-market | $15K-$75K | 12-20 months | Full-cycle AEs + SDR support | 1-3 months |
| Enterprise | $75K-$500K | 18-30 months | AE + SE + overlay specialists | 6-12 months |
| Strategic | $500K+ | 24-36+ months | Dedicated named-account teams | 9-18 months |
3.2 The Reasoning Behind Each Band
- SMB 5-12 months: Short cycles, high lead volume, low cost per deal. PLG-assisted motions land at 5-8 months. Above 12 is a red flag — CAC bloated by too many humans on small deals, or pricing below cost-to-serve.
- Mid-market 12-20 months: The "messy middle." Efficient motions hit 12-15. Above 24 signals a drifted motion — AEs selling deals too small for their cost, or marketing buying expensive leads that do not convert.
- Enterprise 18-30 months: AE plus SE plus overlay, long cycles, multi-threaded committees, procurement and security review. An 18-24 month payback is genuinely good; 24-30 is normal and fundable — *structurally justified* because enterprise logos retain at 92-97% and expand at 110-130% NRR.
- Strategic 24-36+ months: Dedicated account teams, sometimes custom build commitments. A 30-36 month payback is acceptable *only* with multi-year contracts, near-zero logo churn, and strong expansion.
3.3 Bands, Not Targets
The reasoning running through all four: payback length should track contract value, cycle length, and retention together. A long payback is not bad; a long payback with weak retention is fatal. Land inside the band for your segment, then optimize against retention and growth rate, not against the payback number in isolation.
The discipline of segmenting all SaaS metrics this way is detailed in (q99).
Why SMB Payback Is Short — And The Churn Offset
4.1 The Four Reasons SMB Payback Is Structurally Short
SMB payback is short for four compounding reasons. Lower absolute CAC: SMB deals close through self-serve or low-touch reps carrying large quotas of small deals — the human cost per deal is hundreds to a few thousand dollars. Faster cycles: an SMB buyer decides in days or weeks — no procurement, no security questionnaire, no 11-person committee.
Self-serve assist and PLG mechanics: when the product does part of the selling, a meaningful share of revenue arrives with near-zero incremental sales cost. High lead volume and efficient marketing: SMB demand generation runs on content, SEO, and performance marketing at low cost per lead because the addressable population is enormous.
4.2 The Churn That Hides Behind The Slide
The result is paybacks of 5-12 months that look fantastic on a slide. But the slide hides the offset: SMB churn is brutal. SMB customers go out of business, switch tools casually, lose the champion, or simply stop paying.
| SMB retention metric | Typical range |
|---|---|
| Gross annual logo churn | 15-30% |
| Gross annual revenue churn | 10-20% |
| Average customer lifetime | Often 24-40 months |
A 12-month payback feels great until you model that 25% of the cohort is gone within 14 months — you recouped CAC, but barely cleared into profit before the customer left.
4.3 The Honest SMB Metric
The honest SMB metric is not payback alone; it is payback relative to average customer lifetime. If payback is 10 months and the average SMB customer stays 28 months, your actual return is roughly 18 months of gross profit — thin. If lifetime is 60 months, the business is excellent.
SMB economics live or die on whether the product creates enough stickiness to push lifetime well past payback. Founders who optimize SMB payback to 5 months while ignoring 28% churn are optimizing the wrong end of the equation. The retention metrics that must sit beside payback are defined in (q96).
Why Enterprise Payback Is Long — And Why That Is Fine
5.1 The Four Structural Drivers Of Long Enterprise Payback
- Expensive humans: An enterprise deal requires a senior AE ($250K-$400K OTE), one or more sales engineers ($200K-$300K OTE), often an overlay specialist, an SDR-sourced top of funnel, plus a deal desk and legal. The fully-loaded human cost of landing a single enterprise logo can be $80K-$200K.
- Long cycles: Six-to-twelve-month sales cycles mean each deal consumes a large slice of quota capacity, and that capacity cost loads into CAC.
- Expensive pipeline: Enterprise demand generation — field events, executive dinners, ABM programs, analyst relations — costs far more per opportunity than SMB performance marketing.
- Low close rates per opportunity: Lost-deal cost spreads across the won ones, raising the effective cost of every closed logo.
5.2 Why A 30-Month Payback Is Fine In Enterprise
A 30-month payback is alarming in SMB and fine in enterprise because the other side of the equation is radically different. Enterprise logos retain at 92-97% annually — once a platform is embedded in a Fortune 1000 workflow, switching cost is enormous — and they expand at 110-130% NRR.
The account you spent 30 months recouping is, by month 36, paying you 20-30% more than at signing, and will keep paying for 7-12 years. The lifetime gross profit of an enterprise logo dwarfs the CAC even at a 30-month payback.
5.3 The Metric To Actually Watch In Enterprise
The metric to watch in enterprise is not whether payback is long — it will be — but whether payback is shortening or lengthening across cohorts, and whether NRR and logo retention are holding. A 30-month payback with 120% NRR is a great business — the annuity is real. A 30-month payback with 98% NRR and 88% logo retention is a warning — the annuity is leaking.
The number alone tells you nothing; the number next to retention tells you everything. The NRR benchmarks by segment are detailed in (q98).
The Churn Adjustment — Payback Is Meaningless Without Retention
6.1 The Most Important Concept In The Topic
The single most important concept, most often skipped: CAC payback, read alone, is not a measure of business health — it is a measure of cash velocity. It tells you how fast money comes back, not whether the relationship is profitable. To know profitability you must place payback *next to retention* — and the comparison frequently inverts naive intuition.
6.2 Two Businesses, Inverted Intuition
| Business A (SMB) | Business B (Enterprise) | |
|---|---|---|
| CAC payback | 12 months | 30 months |
| Gross annual revenue churn | 30% | ~5% |
| Logo retention | ~70% | 95% |
| NRR | ~95% | 118% |
| Naive verdict | "2.5x better" | "Slow, capital-hungry" |
| Correct verdict | Treadmill | Annuity |
Business A recoups CAC at month 12, but revenue is decaying at 30%/year — a large fraction of the cohort churns before lifetime profit compounds. Business B does not break even until month 30, but from there the customer is *growing* and will keep growing for a decade. Business B's lifetime value per acquisition dollar is multiples of Business A's, despite the "worse" payback.
6.3 The Correct Mental Model
The correct mental model: payback tells you the cash-flow shape of the early period; retention tells you whether there is a long tail of profit after payback. A short payback with bad retention is a treadmill — constant re-acquisition to stand still. A long payback with great retention is an annuity — front-load the cost, then collect for years.
The diagnostic question is never "is payback under X months?" but "how does payback compare to average customer lifetime, and is the post-payback period long and growing or short and shrinking?" Always present CAC payback as a paired metric — payback months alongside gross revenue retention, logo retention, and NRR for the same segment and cohort.
A deck that shows payback without retention beside it is incomplete.
LTV:CAC — The Companion Metric You Read Together
7.1 What LTV:CAC Adds
If CAC payback measures cash velocity, LTV:CAC measures lifetime profitability — the two must be read as a pair, each covering the other's blind spot. LTV:CAC = (gross-margin-adjusted revenue per customer per year x average lifetime in years) / fully-loaded CAC. The rule of thumb is 3:1.
Below 3:1 you are spending too much or retaining too little; above 5:1 you are likely under-investing in growth.
7.2 The Ratio Is Segment-Specific
The 3:1 rule is a starting point, not a law.
| Segment | Sustainable LTV:CAC | Why |
|---|---|---|
| SMB | 3:1 - 4:1 | Lifetimes capped by churn |
| Mid-market | 3.5:1 - 5:1 | Moderate lifetime, moderate expansion |
| Enterprise | 5:1 - 8:1 | 8-12 year lifetimes, strong NRR |
7.3 Why The Pair Must Be Read Together
- LTV:CAC great, payback dangerous: An enterprise deal with a 40-month payback but a 10-year lifetime and 125% NRR might show a stunning 7:1 LTV:CAC — but it ties up cash for over three years per customer, and if you are not capital-rich, that ratio bankrupts you before the lifetime value materializes.
- Payback great, LTV:CAC broken: An SMB business with a 6-month payback but 35% annual churn might have an LTV:CAC of only 1.8:1 — cash comes back fast, but the customer leaves before generating real lifetime profit.
- The resolution: Payback tells you if you can *afford* to grow; LTV:CAC tells you if growth is *worth it*. You need both green. The full LTV:CAC deep-dive is (q93).
The Rule Of 40 Connection
8.1 What The Rule Of 40 States
The Rule of 40 states that a healthy SaaS company's growth rate plus profit margin should sum to at least 40% — a company growing 60% can afford -20% margin, one growing 20% should be at +20%. The framework traces to Bain & Company and McKinsey software-efficiency research, and CAC payback is one of its primary inputs.
8.2 The Mechanical Chain Of Causation
CAC payback determines how much growth each dollar of S&M buys and how long that dollar is underwater.
| Company | Payback | S&M dollar behavior | Rule of 40 effect |
|---|---|---|---|
| Fast-recovery | 9 months | Back within the year, redeployable | Strong growth at modest margin damage |
| Slow-recovery | 28 months | Underwater 2+ years | Same growth needs far more burn, worse margin |
Same growth rate, worse Rule of 40 score, purely because of payback. A company can still hit the Rule of 40 *temporarily* by slashing S&M — but it does so by sacrificing growth, the wrong lever.
8.3 Payback As The Efficiency Dial
CAC payback is the efficiency dial that lets you choose your position on the growth-margin frontier. Improving payback from 22 to 15 months structurally raises the Rule of 40 ceiling. This is why sophisticated boards push on payback even when growth looks fine — a company growing 50% at a 26-month payback is one downturn away from a brutal Rule of 40 problem, while the same growth at a 13-month payback has a structural buffer.
The full Rule of 40 deep-dive is (q95).
Magic Number And Its Relationship To Payback
9.1 What The Magic Number Is
The SaaS Magic Number is CAC payback expressed as a ratio instead of a duration: Magic Number = (net new ARR added in a quarter x 4) / (S&M spend in the prior quarter) — for every dollar of S&M spent last quarter, how many dollars of annualized recurring revenue did you generate this quarter?
It was popularized in a16z's "16 Startup Metrics" and the original Scale Venture Partners writing.
9.2 The Interpretation Thresholds
| Magic Number | Interpretation | Action |
|---|---|---|
| Above 0.75 | Efficient growth | Lean in, spend more |
| 0.5 - 0.75 | Acceptable | Monitor closely |
| Below 0.5 | Inefficient motion | Fix conversion, pricing, targeting before spending |
| 1.0 | ~12-month gross-revenue payback | One year of revenue per year of S&M |
9.3 The Reciprocal Relationship And The Division Of Labor
The relationship is reciprocal: Magic Number is approximately 12 / (raw CAC payback in months). They are two views of the same truth with different blind spots.
- Magic Number is faster: A one-quarter spend-to-result window catches a deteriorating motion sooner, but it is noisy and ignores gross margin.
- CAC payback is more precise: Margin-adjusted, computable per segment and per cohort, tied to cash planning — but slower.
- The best practice: Magic Number as the quarterly early-warning gauge; CAC payback as the diagnostic instrument. When Magic Number drops below 0.6 for two consecutive quarters, trigger the full teardown. The full Magic Number deep-dive is (q94).
Blended Vs Segment-Level Payback
10.1 The Most Dangerous Number In The Topic
The most dangerous number in this topic is the blended company-wide CAC payback — a single figure averaging SMB, mid-market, and enterprise together. It is most often presented to boards, and it routinely hides a serious problem inside an apparently healthy average.
10.2 The Failure Mode With Numbers
A company reports a blended CAC payback of 14 months — comfortably healthy, board pleased. Decompose by segment:
| Segment | Payback | New customers | Reality |
|---|---|---|---|
| Enterprise | 11 months | 30% of new logos | Excellent — senior team, large efficient deals, brand pull |
| Mid-market | 16 months | 30% of new logos | Healthy |
| SMB | 28 months | 40% of new logos | Disaster — too many reps on tiny deals, expensive paid leads |
| Blended | ~14 months | 100% | The average hides the SMB leak |
The enterprise number is *subsidizing* the SMB number. Worse, because the blend looks good, leadership keeps *expanding* the broken SMB motion.
10.3 The Absolute Rule
It can run the other way too — a healthy SMB motion can mask an enterprise motion that has quietly drifted to a 40-month payback because a big-logo sales team has not yet produced.
- The rule: Never make a decision on blended CAC payback. Blended is acceptable only as a one-line external summary; every internal planning, budget, and hiring decision uses segment-level payback.
- The diagnostic tell: The first thing any competent investor does with a "great blended payback" is ask for the decomposition. If a company *cannot* produce segment-level payback, that itself is the finding.
CAC Payback Calculation Flow
CAC Payback By Channel
11.1 Why Channel-Level Payback Is Where The Leverage Lives
Payback varies dramatically by acquisition channel — and channel-level payback is where most of the optimization leverage lives, because you can shift budget between channels far faster than you can change your segment mix.
| Channel | Typical payback | Character | Key constraint |
|---|---|---|---|
| Inbound (content, SEO, brand) | 4-12 months once established | Shortest; cost amortizes across growing volume | 12-24 month ramp; capacity-limited |
| Outbound (SDR, ABM, cold) | 18-36 months | Longest; human-cost-heavy | Scalable and targetable |
| Product-led growth | Low absolute CAC, short per-customer | Cheapest land | Conversion-rate-dependent |
| Partner / channel | Variable, often strong | Partner absorbs part of cost | Less control, lower margin |
11.2 Reading Each Channel
Inbound is the shortest payback once established — cost is largely fixed content and brand investment amortized across self-identifying buyers — but has a 12-24 month ramp and is capacity-constrained. Outbound is the longest, human-cost-heavy with low conversion per touch, but scalable and targetable.
PLG has the lowest absolute CAC but a critical asterisk covered next. Partner is frequently a strong payback because the partner absorbs part of the cost, traded for less control and lower margin.
11.3 Managing The Weighting
A company's blended CAC payback is the weighted average of its channel paybacks, and you can actively manage that weighting. If outbound runs 30 months and inbound runs 8, the highest-leverage move is often not "make outbound more efficient" — it is "shift 20% of the outbound budget into inbound and partner." Tag every closed deal with its sourcing channel and review the channel-by-segment matrix quarterly.
The pipeline-attribution foundation this depends on is covered in (q109).
The PLG CAC Payback Reality
12.1 The Free-Tier Subsidy
Product-led growth is sold as the CAC-efficiency silver bullet, and the reality is more dangerous to misread. The first hidden cost: the free-tier subsidy. Every free or freemium user consumes real resources — hosting, support, infrastructure, security, the engineering time maintaining the free experience — and only a small fraction ever convert.
| PLG entry motion | Free-to-paid conversion |
|---|---|
| Freemium (perpetual free tier) | 1-5% |
| Time-limited free trial | 8-25% |
The cost of serving the 95-99% who never pay is a genuine acquisition cost. A company reporting a "$40 PLG CAC" while absorbing $2M/year in free-tier infrastructure is reporting a fiction. Honest PLG CAC = (free-tier serving cost + PLG product/growth engineering + lifecycle marketing + sales-assist) / new paying customers.
12.2 Conversion-Rate Dependence
The second reality: PLG payback is conversion-rate-dependent in a way human-led sales is not. In a sales-led motion a rep can be coached and a close rate moved deliberately. In PLG, the conversion rate is a property of the *product and onboarding experience* — moving it requires product changes, activation-flow redesign, and packaging work, which are slower and more cross-functional.
A PLG company whose activation rate slips two points sees its effective CAC jump, and the fix is a roadmap item, not a coaching session.
12.3 The Expansion Dependency
The third reality: PLG often has a lower ACV at the point of self-serve conversion, so even a low CAC can produce a mediocre payback if the entry price is too low. PLG companies rely on expansion to make the economics work, pushing the real question to "what is PLG net-of-expansion payback?" PLG delivers excellent CAC payback only when you (1) load the free-tier subsidy into CAC, (2) treat conversion rate as the critical variable it is, and (3) measure payback net of expansion.
The full PLG unit-economics deep-dive is (q108).
Cohort-Based CAC Payback Analysis
13.1 Why Snapshots Lie About Direction
A single company-wide CAC payback number is a snapshot, and snapshots lie about direction. The instrument that tells you whether your acquisition engine is getting better or worse is cohort-based CAC payback — grouping customers by signup quarter and tracking each over time.
13.2 The Mechanics
For the customers acquired in Q1, compute that cohort's fully-loaded CAC, then track its cumulative gross profit month by month. The month it crosses cumulative CAC is that cohort's payback point. Do this for every quarterly cohort and lay them side by side.
| Cohort signal | What it means |
|---|---|
| Payback shortening across cohorts | Healthy, improving — motion more efficient, brand stronger |
| Payback lengthening across cohorts | CAC creeping up, or newer customers lower-quality |
| Sudden cohort degradation | Recently broken — channel or pricing issue |
| Gradual lengthening with upmarket move | Deliberate mix shift, not motion failure |
13.3 What Cohorts Expose That A Blend Cannot
- Mix shift: If you moved upmarket, newer cohorts will have longer payback by design — cohort analysis shows it is a deliberate mix change, not motion degradation.
- Retention layered onto payback: The cohort view should track retention, so you can see whether the cohort that took 16 months to pay back is still 90% intact at month 30 or already 60% churned.
- The best dashboard: Overlay three curves per cohort — cumulative CAC, cumulative gross profit, surviving logos. The cohort-retention method is detailed in (q97).
What Investors Expect By Stage
14.1 Seed Through Growth Equity
CAC payback expectations are not just segment-specific — they are stage-specific. A founder applying a growth-stage benchmark to a seed-stage company will starve a promising business or fund a broken one.
| Stage | Blended payback expectation | What investors want to see |
|---|---|---|
| Seed | Not over-indexed | Evidence the loop can exist; early retention signal |
| Series A | 18-24 months acceptable | Segment-level numbers emerging; improvement trend |
| Series B+ | Under 18 months expected | A machine, not an experiment; cohort improvement |
| Growth equity / PE | Under 12 SMB, under 24 enterprise | Cash efficiency; strong retention beside every number |
14.2 Reading Each Stage
- Seed: Investors largely do not over-index on CAC payback — the data is too thin. They want evidence the loop can exist and a credible thesis for reasonable payback at scale. Christoph Janz's "SaaS Funding Napkin" frames stage-appropriate expectations well.
- Series A: Now payback matters. Investors expect a blended 18-24 months, with segment-level numbers emerging and an early improvement trend. A 30+ month payback with no trend will struggle to raise.
- Series B+: The bar tightens to under 18 months blended, with healthy segment-level numbers and demonstrable cohort improvement. Long payback here reads as "they have not figured out efficient growth."
- Growth equity / PE: The most demanding bar — under 12 months for SMB motions, under 24 for enterprise. PE underwrites on cash efficiency because their model often involves leverage, and a long payback conflicts with debt service.
14.3 The Throughline
The appropriate benchmark rises in stringency as the company matures. At every stage after seed, investors care as much about the *direction* of payback as the absolute level. The full deep-dive on what investors underwrite by stage is (q110).
The Sales Capacity And Ramp Impact
15.1 Why Ramping Reps Drag Payback
A large distortion in CAC payback comes from sales rep ramp. A newly hired AE is a full-cost line item from day one — base salary, benefits, tooling, management attention — but produces little to no closed revenue for the first 3-9 months. Every ramping rep is, in effect, pure CAC with no offsetting gross profit.
15.2 The Hiring-Surge Artifact
A company that grows its AE headcount 60% in a year will see its blended CAC payback *worsen* — not because the motion got less efficient, but because a large fraction of the team is in ramp, costing money and not yet producing. If leadership reads that as "our GTM is breaking" and pulls back on hiring, they kill growth for a measurement artifact.
Conversely, a company that *stops* hiring sees its blended payback artificially *improve* — masking that it has stopped investing in future growth.
15.3 The Two-Number Fix
| Number | What it isolates | Use it for |
|---|---|---|
| Fully-ramped payback | Unit economics of a productive, tenured rep | Go/no-go on the motion itself |
| Blended payback | Current cash efficiency including ramp drag | Runway and burn planning |
A healthy fast-growing company routinely shows a good fully-ramped payback and a temporarily-worse blended payback — that gap is the visible cost of investing in growth capacity, not a problem. Track ramp time itself as a lever. The full capacity-and-ramp model is detailed in (q105).
The Multi-Year Contract Effect
16.1 Cash Payback Vs Accounting Payback
A powerful and underused lever on *effective* CAC payback is contract structure — multi-year contracts with annual upfront prepayment. When cash arrives early, the cash-flow reality changes dramatically.
| Contract structure | Accounting payback | Cash payback |
|---|---|---|
| 1-year, monthly billing | 20 months | ~20 months |
| 2-year, year-one prepaid | 20 months | A few months or immediate |
| 3-year, fully prepaid | 20 months | Cash-positive day one |
16.2 Why It Transforms The Cash Position
Consider a deal with a 20-month accounting payback. If the customer pays monthly, your cash position tracks that 20-month curve. But if the same customer signs a two-year contract with year one prepaid, you collect 12 months of revenue on day one — and your cash payback, the metric that governs runway, drops to a few months or immediate.
The accounting payback is unchanged; the cash-flow payback is transformed. This is why disciplined SaaS finance teams track cash CAC payback alongside recognized-revenue CAC payback, and why comp and deal desk policy should incentivize prepay.
16.3 The Caveats
- Prepay requires a discount: Typically 5-15% for annual, more for multi-year — slightly worsening the *margin-adjusted* payback even as it transforms the *cash* payback.
- Renewal-risk concentration: Prepay concentrates renewal risk into annual events rather than spreading it monthly.
- The net verdict: Contract structure is a lever most companies leave on the table — a radically better cash payback purely through how the contract is written. The full annual-vs-monthly billing analysis is (q106).
Expansion Revenue And Net CAC Payback
17.1 The Mechanism
The standard formula uses *initial* ACV. But customers expand: more seats, more usage, tier upgrades, cross-sell. When you account for expansion, the metric becomes net CAC payback. A customer signing at $50K ACV with a 20-month initial-ACV payback, in a segment with 125% NRR, has expanded to $68K by month 24.
The actual cumulative gross profit curve is steeper than the flat-ACV curve, so the cohort crosses its CAC line earlier than 20 months. In segments with very strong expansion (130%+ NRR), expansion revenue within the first 12-18 months alone can make the net payback dramatically shorter than the gross payback.
17.2 Negative Net CAC
Some operators describe best-in-class enterprise cohorts as having "negative net CAC" — expansion revenue from the existing cohort exceeds the CAC needed to maintain and grow it, so the cohort self-funds its own growth.
| NRR scenario | Effect on net payback |
|---|---|
| 130%+ NRR | Net payback much shorter than gross; cohort can self-fund |
| 110-125% NRR | Net payback meaningfully shorter than gross |
| 100% NRR | Net payback equals gross payback |
| Below 100% NRR | Net payback WORSE than gross — five-alarm signal |
17.3 Why You Compute Both
If your expansion motion is strong, a "long" initial-ACV payback is far less alarming than it looks — which is why enterprise businesses tolerate 24-30 month *initial* paybacks: the *net* payback, accounting for 120-130% NRR, is more like 14-18 months. Compute both gross CAC payback (initial ACV) and net CAC payback (ACV plus realized expansion minus contraction); the gap between them is one of the most informative numbers in the business.
The full deep-dive on building an expansion motion is (q114).
Discount Discipline's Impact On Payback
18.1 Why Discounting Destroys Payback
Discounting is one of the most direct destroyers of CAC payback — because a discount reduces gross profit per customer without reducing your CAC at all. The CAC was already spent; discounting just means it takes longer to recoup. CAC payback = CAC / (ACV x gross margin), and CAC is fixed by the time you negotiate price.
Because the discount comes straight off the *margin-bearing* portion of revenue, a 10% discount lengthens payback by more than 10%. A culture that routinely gives 15-20% discounts to "close faster" can push a segment's payback from 16 months to 20+.
18.2 The Second-Order Effect
There is a second-order effect: discounting trains buyers. Once a sales org is known to discount under deadline pressure, every subsequent buyer holds out for the same treatment, so the discount becomes structural. Worse, the discounted price usually becomes the renewal baseline — the damage compounds for the life of the customer, not just year one.
18.3 The Operational Responses
- Deal desk and approval thresholds: Discounts above a defined level require escalating sign-off, creating friction against casual discounting.
- Trade discounts for term, not for nothing: If you must concede on price, get multi-year commitment or annual prepay in exchange — improving cash payback even as it costs margin.
- Compensate on net ACV / margin, not gross bookings: If reps are paid on bookings regardless of discount, they discount; if commission reflects it, they defend price.
- Make the payback cost visible: Show the sales org, in their own deal reviews, how many extra months each discount point costs. The full deal desk and approval-process build is (q104).
The Payback Vs Retention 2x2
Sales Comp Design To Improve Payback
19.1 Comp Design Shapes Deal Selection
Sales compensation is a direct and underused lever on CAC payback, because comp design shapes which deals reps chase and how they structure them — and deal selection and structure are what determine payback. A comp plan that ignores payback produces a team that rationally optimizes against it.
19.2 The Four Comp Levers
| Lever | Mechanism | Payback effect |
|---|---|---|
| Accelerators on the right deals | Reward higher ACV, prepay, in-segment fit | Steers reps toward payback-friendly deals |
| Clawbacks on early churn | Recover commission on 6-12 month churn | Improves cohort quality, protects retention |
| Multi-year SPIFs | Bonus for multi-year / annual-prepay deals | Transforms cash payback via billing mix |
| Pay on net, not gross | Commission reflects discounts | Reps defend price, protect margin |
The unifying logic: a deal that churns in month 4 is a pure loss, so a clawback aligns the rep with retention; a SPIF for multi-year prepay shifts billing mix toward upfront cash; paying on net ACV makes the rep feel the payback cost of every concession. The payback-friendly deal should be the most lucrative deal for the rep.
19.3 Comp As The Control System
Comp design, deal desk policy, and CAC payback measurement should be a single connected system. Measure payback by rep and by segment, identify which deal patterns drive good vs bad payback, then design the comp plan to pay most for the healthy patterns. The comp plan is the *control system* for the behaviors that produce the number.
The full comp-design deep-dive is (q103).
Marketing Mix Optimization For Payback
20.1 The Method
If sales comp is the lever on deal selection, marketing mix is the lever on channel-level payback — reallocating the marketing budget is often the fastest way to improve blended payback without touching the product, price, or sales team.
- Step one — attribute: Attribute every closed deal to its primary channel and compute fully-loaded CAC and payback per channel, per segment. This produces a matrix — channels down the side, segments across the top.
- Step two — identify the spread: In almost every company the spread between best and worst channel payback is large — an 8-month inbound payback next to a 30-month outbound payback for the same segment is common.
- Step three — reallocate at the margin: Move incremental budget out of long-payback channels into short-payback ones, up to the point where the short-payback channel's payback starts to rise.
20.2 The Four Nuances
- Channels have different ramp times: Inbound and content take 12-24 months to produce — the shift must be planned ahead.
- Channels are not infinitely scalable: Inbound is capacity-constrained — you cannot fund 100% of growth through the shortest-payback channel.
- Channels interact: Brand and awareness spend makes outbound *and* inbound more efficient; cutting it to "improve payback" can lengthen the payback of every other channel.
- Segment fit matters: The channel that is short-payback for SMB (performance marketing, PLG) may be irrelevant for enterprise, where outbound and field are the only channels that reach the buyer.
20.3 The Correct Posture
Treat the marketing mix as a portfolio you actively rebalance every quarter against channel-level payback data, shifting toward efficiency at the margin while respecting ramp times, scalability ceilings, and channel interactions. Companies that do this well treat "blended CAC payback" as an *output they engineer*.
The marketing-mix-model build is (q107).
Five Real Benchmark References — Public SaaS
21.1 The Five References
Public-company disclosures and S-1 filings are the best available real-world calibration — audited numbers, businesses at scale.
| Company | Ticker | Segment profile | Payback lesson |
|---|---|---|---|
| HubSpot | NYSE: HUBS | SMB-to-mid-market | Payback improved with brand scale and upmarket move |
| Salesforce | NYSE: CRM | Enterprise | Long payback sustained by elite retention + multi-cloud expansion |
| ZoomInfo | NASDAQ: GTM | Enterprise-ACV | Unusually short, sales-efficient payback |
| Monday.com | NASDAQ: MNDY | PLG-and-sales hybrid | Efficient land, expansion-dependent net economics |
| Klaviyo | NYSE: KVYO | SMB / mid-market e-commerce | Product-led, usage-based expansion motion |
21.2 Reading Each Reference
HubSpot is a case study in payback improving with scale: early in its public life CAC payback ran long (well over 20 months by external estimates), then compressed materially as inbound brand pull strengthened and the product moved upmarket. Salesforce is the enterprise benchmark — a multi-year payback, long by SMB standards but normal for enterprise, sustained by exceptional retention and multi-cloud cross-sell: proof that a long payback is fine when retention is elite.
ZoomInfo showed an unusually efficient payback for its scale via a high-velocity motion and strong margins. Monday.com is a PLG-and-sales hybrid: efficient self-serve land plus a sales motion for larger accounts, with net economics that depend on expansion. Klaviyo is a current-era SMB/mid-market product-led, integration-driven motion with usage-based expansion.
21.3 The Meta-Lesson
There is no single "good" number — the public market rewards not a specific figure but the *combination* of payback, retention, and growth. Always read payback alongside disclosed NRR and gross margin. The full deep-dive on benchmarking against public comparables is (q119).
The Payback Period Trap
22.1 Optimizing By Under-Investing
The counterintuitive failure mode: CAC payback can be "improved" by doing exactly the wrong thing — under-investing in growth. The fastest way to shrink the number is not to make acquisition more efficient; it is to *spend less* — fire SDRs, cut marketing programs, stop hiring AEs, chase only easy inbound deals.
Payback drops, the metric looks great, and the business is quietly dying.
22.2 The Recognizable Signature
A company that has "optimized" its payback to a suspiciously short number — a 4-month SMB or 11-month enterprise payback — is very often one that has stopped growing. The tells: payback well below the segment benchmark; growth decelerating; S&M as a percentage of revenue falling; new-segment and new-channel experiments cut "for efficiency"; a sales team working only warm inbound.
Each individually can be fine; together they are the trap. Payback *should* be a guardrail against inefficiency; in the trap it becomes a justification for timidity — the board sees a great payback number and a decelerating growth rate and does not connect them.
22.3 The Correct Framing
Payback is a constraint, not an objective. The objective is *efficient growth* — the maximum sustainable growth rate at an acceptable payback. Spend S&M up to the point where the marginal dollar pushes payback past the segment ceiling, and no further. If your SMB payback is 6 months and the band is 5-12, pushing payback to 10 months while doubling growth is the right move.
The companies that win spend to the *edge* of their healthy band. The full payback-period-trap deep-dive is (q117).
How To Diagnose A Broken CAC Payback
23.1 Segment It, Channel It, Cohort It
When the blended CAC payback is bad — or *fine but you suspect it is hiding something* — there is a disciplined three-cut diagnostic: segment it, channel it, cohort it.
- Cut one — segment it: Decompose blended payback into SMB, mid-market, enterprise, and strategic. Always the first cut, because the blend is where problems hide. It is common to find one segment running 2-3x the payback of the others.
- Cut two — channel it: Within the problem segment, decompose by channel — inbound, outbound, PLG, partner. This turns "our SMB payback is bad" into "our SMB *outbound* payback is 31 months while SMB inbound is 9."
- Cut three — cohort it: Within the problem segment and channel, look at the trend across quarterly cohorts. This answers the *direction* question — structural, recently broken, or mix/ramp artifact — and overlays retention so you can see whether the "payback problem" is a retention problem wearing a payback mask.
23.2 The Component Drill-Down
Once segment/channel/cohort has localized the leak, drill into the components.
| Side of the formula | Leak source | Check against trend |
|---|---|---|
| CAC numerator rising | Too many SDRs, expensive media, ramping reps, bloated tooling | Decompose CAC into line items |
| Gross-profit denominator falling | Discounting, declining gross margin, downmarket mix drift | Decompose into ACV, discount, margin trend |
*Resist fixing before diagnosing* — most failed remediation efforts cut the wrong thing because they never localized the actual leak. The full deep-dive on diagnosing a deteriorating GTM motion is (q111).
Building A CAC Payback Dashboard
24.1 The Fields
A CAC payback dashboard is a standing instrument RevOps and finance maintain and leadership reads monthly. It shows, at minimum:
- Fully-loaded CAC and payback, segmented: SMB / mid-market / enterprise / strategic — never just blended, with payback by channel within each segment.
- Three paired views: gross and net (expansion-adjusted), blended and fully-ramped (hiring drag), recognized-revenue and cash (runway).
- Paired retention beside every payback number: logo retention, gross revenue retention, NRR for the same segment/cohort.
- Companion efficiency metrics: LTV:CAC, Magic Number, Rule of 40, plus a cohort view across the last 6-8 quarterly cohorts.
24.2 The Cadence
| Cadence | What to review | Why |
|---|---|---|
| Monthly | Magic Number + blended payback estimate | Early-warning gauge |
| Quarterly | Full segmented / channeled / cohorted teardown | Payback is noisy over short windows |
| Annually | Full model rebuild + benchmark reset | Re-calibrate segment bands |
| Off-cycle | Magic Number < 0.6 for two quarters, or a segment >20% off trend | Deep dive |
24.3 The Reconciliation
This separates a trustworthy dashboard from a vanity dashboard. CAC must reconcile to the P&L — total S&M expense, tied to the general ledger, must equal the sum of all CAC allocated across segments and channels; if the dashboard's implied total S&M is smaller than the income statement's S&M line, it is excluding cost.
New-customer and ACV counts must reconcile to the CRM and billing system. Every quarter, finance and RevOps jointly tie the dashboard to the P&L, CRM, and billing system. A dashboard never reconciled to the financial statements is a story, not a measurement. The hands-on dashboard build is (q101).
Five-Year Outlook — AI-Driven CAC Compression
25.1 AI Compresses CAC On The Acquisition Side
The segment benchmarks here are a 2026 calibration, not a permanent law. The dominant theme toward 2030: AI is compressing CAC across the funnel — unevenly. AI-assisted SDR tooling reduces the human cost of pipeline generation; AI content generation lowers the cost of inbound and SEO; AI sales-assist tools raise rep productivity, shortening ramp and lifting close rates; AI-driven targeting reduces wasted spend on poor-fit accounts.
The aggregate effect is downward pressure on fully-loaded CAC — a motion that paid back in 18 months in 2026 might pay back in 13-14 by 2030.
25.2 The Compression Is Uneven — And That Creates Traps
- AI tooling is itself a cost: The AI sales/marketing stack is a new and growing line in fully-loaded CAC; naive "AI lowers our CAC" claims fail to load the tooling cost back in.
- Competitive intensity rises: If AI lowers CAC for everyone, the cost advantage gets competed away through aggressive spending and lower prices — net payback can land where it started while everyone runs faster.
- AI changes the buyer too: AI-assisted buyers run faster, more self-directed evaluations, compressing cycles (good for payback) but commoditizing the seller's information advantage (pressuring price, bad for payback).
25.3 What This Means For The Benchmarks
| Segment | 2026 band | Projected 2030 band |
|---|---|---|
| SMB | 5-12 months | 4-9 months |
| Mid-market | 12-20 months | Modest compression |
| Enterprise | 18-30 months | 16-28 months (compresses least) |
PLG and self-serve segments compress most as AI makes products easier to adopt without human help. Enterprise compresses least — procurement, security review, multi-threaded committees, and integration complexity are human-trust problems AI does not dissolve. Expect the metric to matter *more*, not less.
The full deep-dive on how AI changes SaaS GTM by 2030 is (q115).
Counter-Case: When CAC Payback Is The Wrong Metric To Optimize
Everything above treats CAC payback as a central, near-sacred discipline. But there are real situations where over-indexing on it is actively destructive — where the founder who religiously optimizes the number loses to the one who ignores it.
- Counter 1 — The early-stage land-grab: In a brand-new category, the first to scale often wins permanently — through brand, default status, data or network effects. A 30-month payback that grabs the market beats a 10-month payback that lets a competitor out-grow you.
- Counter 2 — Winner-take-all markets: With strong network effects or compounding switching costs, the *terminal* market structure matters, not *path* efficiency. If being #1 means owning 70% forever and #3 means dying, payback during the race is almost irrelevant — spend whatever it takes, fix efficiency after.
- Counter 3 — When a short payback signals under-investment: The payback period trap restated. If payback is well below your segment's band, you are leaving growth on the table — the "right" move is to *make payback worse* by spending into longer-payback channels.
- Counter 4 — When the metric drives short-termism: CAC payback rewards what is fast and cheap to recoup — the easy inbound deal, the existing segment. It *punishes* new segments, new channels, brand, going upmarket — all long-payback early. The metric has a built-in bias toward harvesting and against planting.
- Counter 5 — Pre-product-market-fit: Before PMF, CAC payback is noise dressed up as signal — the customer set is tiny and unrepresentative, the motion is being invented weekly, and the "CAC" is mostly founder time. The job before PMF is to find the loop, not make it efficient.
- Counter 6 — When cheap capital changes the math: CAC payback measures a cash constraint. If capital is genuinely cheap and abundant, the constraint is slack and a long payback is far less dangerous. The metric implicitly assumes capital is scarce; when capital is expensive, payback discipline becomes *more* critical than the benchmarks suggest.
- Counter 7 — Strategic and loss-leader customers: Some customers are worth acquiring at a payback that never makes standalone sense — the marquee logo that unlocks a segment's trust, the design-partner account, the account that blocks a competitor. Judging these on CAC payback would mean never acquiring them.
- Counter 8 — When it crowds out the metric that matters: For many businesses the binding constraint is *retention*, not acquisition efficiency. A company with a churn problem will not be saved by a better CAC payback — a leadership team staring at the payback dashboard may miss that the real fire is in the retention numbers.
The honest synthesis. CAC payback is the right thing to optimize for the *large majority* of SaaS companies at the *large majority* of stages — post-PMF, in competitive markets, when capital is normally priced and retention is healthy. But the metric is a servant, not a master.
Consciously *de-prioritize* it in four conditions: a genuine land-grab where speed beats efficiency; pre-PMF, where the data is meaningless; when capital is cheap and the prize is large; and when the real constraint is retention. The sophisticated operator does not ask "is my CAC payback good?" — they ask "given my market structure, stage, capital position, and retention, *how much* should CAC payback discipline govern my decisions right now?" When to prioritize growth over efficiency is examined in (q118), and the Burn Multiple as an adjacent lens is covered in (q112).
Final Framework — Target Payback Plus The Diagnostic Checklist
26.1 The Target Bands
The target payback bands (gross-margin-adjusted, fully-loaded, new-business, 2026 calibration):
| Segment | Band | Below-band signal | Above-band signal |
|---|---|---|---|
| SMB | 5-12 months | Under-investment in growth | Bloated CAC or underpricing |
| Mid-market | 12-20 months | Possible under-investment | Motion drift — decompose obsessively |
| Enterprise | 18-30 months | Possible harvest mode | Sales team unramped or retention leaking |
| Strategic | 24-36+ months | Rare; verify | Acceptable only with multi-year contracts + near-zero churn |
These are *bands to land inside*, not targets to minimize.
26.2 The Six Non-Negotiable Rules
- Compute it fully-loaded and margin-adjusted: Every GTM cost reconciled to the P&L; divide by ACV x gross margin, never raw ACV.
- Present it next to retention: Logo retention, gross revenue retention, NRR — payback alone measures cash velocity, not health.
- Segment it: Blended is for external summaries only; every internal decision uses segment-level numbers.
- Read it with its companions: LTV:CAC, Magic Number, Rule of 40 — no single metric stands alone.
- Track three paired views: gross vs net, blended vs fully-ramped, recognized vs cash — each pair separates a signal from an artifact.
- Treat payback as a constraint, not an objective: Spend to the edge of the healthy band, do not minimize the number.
26.3 The Diagnostic Checklist And One-Sentence Version
When payback looks wrong: segment it, channel it, cohort it, then component-drill (is the CAC numerator rising or the gross-profit denominator falling?). Resist fixing before diagnosing. The dashboard is a standing quarterly instrument — segmented, channeled, cohorted, with retention beside every number, reconciled to the P&L, CRM, and billing system.
The one-sentence version: a realistic CAC payback is the segment-appropriate band, computed honestly, read next to retention, surrounded by its companion metrics, and managed as the dial that lets you buy the maximum efficient growth your cash position can sustain — anyone who hands you a single number without that context is either confused or selling something.
Key Numbers At A Glance
| Topic | Key figures |
|---|---|
| Core formula | CAC Payback = Fully-Loaded CAC / (New ACV x Gross Margin %) x 12; raw version overstates efficiency ~25-40% |
| Benchmark bands | SMB 5-12 months (PLG-assisted 5-8), mid-market 12-20, enterprise 18-30, strategic 24-36+ |
| Retention beside payback | SMB logo churn 15-30%; enterprise logo retention 92-97%, NRR 110-130%; mid-market NRR 100-115% |
| Companion metrics | LTV:CAC 3:1 (SMB 3-4:1, enterprise 5-8:1); Magic Number >0.75 efficient; Rule of 40: growth % + margin % >= 40% |
| Channel payback | Inbound 4-12 months (12-24 month ramp); outbound 18-36; PLG conversion freemium 1-5%, free trial 8-25% |
| Investor stage bars | Seed: do not over-index; Series A: 18-24 blended; Series B+: under 18; PE: under 12 SMB / under 24 enterprise |
FAQ
What are the realistic CAC payback bands by segment? Computed the honest way — fully-loaded, gross-margin-adjusted, new-business only — the healthy bands are SMB ($1K-$15K ACV) 5-12 months, mid-market ($15K-$75K ACV) 12-20 months, enterprise ($75K-$500K ACV) 18-30 months, and strategic/named accounts ($500K-plus ACV) 24-36-plus months.
These are bands to land inside, not targets to minimize — below the band signals under-investment, above it signals bloated CAC or underpricing.
What is the canonical CAC payback formula? CAC payback in months equals Fully-Loaded CAC divided by (New ACV times Gross Margin %), times 12 — equivalently, Fully-Loaded CAC divided by monthly gross profit per new customer. The raw version that divides CAC by ACV and pretends you keep 100% of revenue understates the true number by about 28% at 78% gross margin, so always use the margin-adjusted version.
Why is CAC payback meaningless without retention next to it? A 12-month SMB payback paired with 30% gross annual churn is a worse business than a 30-month enterprise payback paired with 95% logo retention and 120% net revenue retention, because the enterprise customer keeps paying and expanding for a decade while the SMB customer is gone before margin compounds.
Payback alone measures cash velocity, not business health, so always pair it with LTV:CAC of 3:1-plus, the Magic Number above 0.75, and the Rule of 40.
What does a worked mid-market example look like? A company spending $4.2M on fully-loaded S&M in a quarter, signing 70 new customers at $48K average ACV at 80% gross margin, has a fully-loaded CAC of $60,000 and $3,200 monthly gross profit per customer, giving an 18.75-month margin-adjusted payback.
The raw version produces 15 months — a 20% optimistic distortion that leads to over-hiring.
Which costs are the seven exclusions teams make to flatter CAC? The common exclusions are SDR/BDR cost (understates CAC 15-30%, hidden in "pipeline generation"), sales engineers (20-35% of true enterprise CAC, hidden in "product" or "post-sale"), sales leadership and RevOps (hidden in "G&A"), and marketing salaries (counting ad spend but not the team, hidden in "headcount").
A defensible fully-loaded CAC includes all sales comp, all SDR/BDR cost and their management layer, all marketing program spend and headcount, sales engineering, RevOps, the full GTM tech stack, and a fair allocation of overhead.