
What's a good NRR for Series B SaaS in 2026?

NRR Definition And Formula: What You Are Actually Measuring

Net Revenue Retention measures how much recurring revenue you keep and grow from your existing customer base over a defined period, excluding any revenue from new logos. The standard formula is straightforward but the edge cases are where boards get misled. Take a fixed cohort of customers — every account that was active twelve months ago — and compute: NRR = (starting ARR + expansion ARR − contraction ARR − churned ARR) ÷ starting ARR.
If you started the period with $20M of ARR from that cohort, added $4M of expansion, lost $1M to downgrades, and lost $1.5M to full churn, your NRR is ($20M + $4M − $1M − $1.5M) ÷ $20M = 107.5%. The critical discipline is that the numerator and denominator must reference the same cohort — you are asking "what happened to the dollars I already had," not "how did total ARR change," which would contaminate the number with new-logo revenue.
Several variants exist and conflating them is the most common reporting error at Series B. GAAP-style versus management NRR: some teams measure strictly on booked, recognized revenue; others use a management view that includes signed-but-not-started expansion. Gross versus net: Gross Revenue Retention (GRR) strips out expansion entirely — GRR = (starting ARR − contraction − churn) ÷ starting ARR — and is capped at 100%, while NRR can exceed 100%.
Logo retention versus dollar retention: logo retention counts accounts kept; dollar retention weights by revenue, so losing ten tiny accounts hurts logo retention but barely moves dollar NRR. Monthly versus annual cohorts: monthly NRR annualized is not the same as a true trailing-twelve-month cohort measurement and tends to look smoother.
For board reporting at Series B, the defensible standard is a trailing-twelve-month, dollar-based, cohort-locked NRR, reported alongside GRR, with new-logo revenue explicitly excluded. Pick one definition, document it, and never change it mid-fundraise — investors will rebuild your number from the data room, and a definition that flatters you will erode trust faster than a lower honest number.
The 2026 Benchmark Reality
Here is the benchmark that matters, stated plainly. For a Series B SaaS company sitting between $10M and $50M ARR in 2026: 105-115% NRR is solid and fundable, 115-125% is strong and will attract competitive term sheets, and 125%+ is elite and rare. Below 100% is a red flag — it means your existing base is shrinking and every dollar of growth has to come from new logos, which is the most expensive growth there is.
Between 100% and 105% you are in a yellow zone: not disqualifying, but you will face hard questions about whether the expansion motion is real or whether you are simply not losing customers fast enough yet.
What makes 2026 different is compression. In 2021, at the peak of zero-interest-rate exuberance, 120%+ NRR was so common across venture-backed SaaS that it functioned as a baseline expectation rather than a differentiator. Public comps regularly disclosed 125-135%.
Series B decks routinely showed 130%+ and nobody blinked. That era is over. The median NRR across venture-backed B2B SaaS has fallen roughly 10-20 points depending on segment, and the distribution has widened — the gap between the best and the median is larger now because expansion is harder to manufacture when budgets are scrutinized.
This means a Series B founder quoting "we're at 112%, which is below the 120% benchmark" is working from a stale benchmark. 112% in 2026 is a perfectly respectable, fundable number for most segments. The mistake runs both directions: some founders panic over a number that is actually fine, while others — anchored to 2021 — assume 105% is great when for an enterprise-focused company it signals a real expansion problem.
The benchmark is not a single number. It is a band that moves with segment and pricing model, and the 2026 bands are lower and tighter than the numbers your investors internalized five years ago. Calibrate to the current market, not the memory of the last one.
Why NRR Compressed From 2021 To 2026
The compression was not random — it was the predictable result of four reinforcing forces. Understanding them matters because each one tells you something about whether your own NRR softness is a market condition or a company-specific failure.
The end of ZIRP. When capital was free, customers bought ahead of need, expanded aggressively, and rarely audited spend. When rates rose, every SaaS line item went under a magnifying glass. The same customer who added 40 seats a year in 2021 now adds 8 and asks for a discount on renewal.
This is a demand-side change you cannot fully engineer around — it sets the ceiling.
Budget scrutiny and procurement professionalization. Finance teams and dedicated SaaS-spend management tools (Vendr, Zylo, Tropic and their successors) now sit between you and the budget owner. Multi-year auto-expansion clauses get negotiated out. "Nice to have" modules get cut at renewal.
The frictionless expansion of 2021 has been replaced by a procurement gate on every uplift.
Seat-based contraction. Layoffs across tech and adjacent industries from 2022 onward meant customers literally had fewer humans to license. A seat-priced product loses revenue mechanically when a customer cuts headcount — no product failure required. This hit horizontal, seat-priced SaaS hardest and is the single biggest driver of sub-100% NRR among 2023-2025 cohorts.
AI-driven efficiency reducing seat counts. This is the newest and most structural force, and it cuts deeper than the others. As customers adopt AI tooling — including AI features inside your own product — they need fewer people to do the same work. A support team that needed 50 agent seats now needs 35.
A sales team automates SDR work and cuts seats. For seat-priced vendors, AI efficiency at the customer is a direct contraction vector. The double-edged nature of this — AI features can also drive expansion — is covered later, but the near-term effect on seat-based models has been downward pressure.
Add general downgrade pressure (customers moving from premium to standard tiers to save money) and you have a structural, multi-year compression that explains why 2026 benchmarks sit where they do.
NRR By Segment: SMB, Mid-Market, Enterprise
NRR varies more by customer segment than by company stage, and a Series B founder must benchmark against the right segment or risk either false panic or false comfort.
SMB-focused Series B SaaS: realistic NRR 95-105%. Small businesses churn — they go out of business, they get acquired, they cut tools in a downturn, they switch for a cheaper alternative. Logo churn in SMB routinely runs 2-4% per month, which is 25-40% annually. That is a brutal headwind.
Expansion within SMB accounts is also limited because the accounts are small to begin with — there is not much room to grow a 5-seat customer. An SMB-focused Series B company that hits 105% NRR is doing genuinely well; one at 100% is normal; one below 95% has a real retention problem.
The SMB model wins on volume and velocity of new logos, not on expansion.
Mid-market-focused Series B SaaS: realistic NRR 105-115%. Mid-market accounts are stickier — switching costs are higher, the buyer is more deliberate, and there is real room to expand through additional seats, departments, and modules. Annual logo churn in mid-market typically runs 8-15%.
Expansion is meaningful but not explosive. This is the sweet spot for a lot of venture-backed SaaS, and 110% is a healthy, fundable midpoint.
Enterprise-focused Series B SaaS: realistic NRR 115-130%. Enterprise accounts churn rarely — annual logo churn of 3-8% is typical — because the procurement cost, integration depth, and political capital invested make switching painful. And the expansion runway is enormous: you land in one division and expand across business units, geographies, and use cases.
A genuinely enterprise-motion Series B company should be at 115% minimum; the best are at 125-130%.
Why the spread exists. It comes down to two structural variables: churn floor (how often customers leave for reasons you cannot control) and expansion ceiling (how much room exists to grow an account). SMB has a high churn floor and a low expansion ceiling — both pull NRR down.
Enterprise has a low churn floor and a high expansion ceiling — both push NRR up. Mid-market sits between. This is why comparing your SMB company's 103% to a competitor's enterprise 125% is meaningless.
Benchmark within your segment or the number tells you nothing.
NRR By Pricing Model: Seat-Based, Usage-Based, Hybrid
Pricing model shapes NRR as powerfully as segment does, because it determines the mechanical relationship between customer success and your revenue.
Seat-based pricing: structurally vulnerable, typically 105-115%. When you charge per seat, your revenue is tied to your customer's headcount — a variable you do not control and which, in 2023-2026, has frequently moved down. Expansion in a seat model requires the customer to hire, to roll the product out to new teams, or to upgrade tiers.
Contraction happens automatically when they cut staff. The seat model is clean, predictable, and easy to sell, but it caps NRR upside and exposes you to your customer's worst quarters. Most seat-based Series B SaaS lands in the 105-115% band, and the best of them get there through aggressive multi-team land-and-expand plus tier upgrades.
Usage-based pricing: high ceiling, real volatility, 115-140% with strong PMF. When you charge for consumption — data processed, API calls, compute, messages sent — and your customer is growing, your revenue grows automatically without any sales motion at all. This is the Snowflake and Datadog pattern: customers that adopt the product and succeed simply consume more, and NRR compounds.
The best usage-based companies have posted NRR well above 130%. But the same mechanism cuts the other way: when a customer optimizes, has a slow quarter, or re-architects to reduce consumption, your revenue drops with no warning and no renewal event to defend it. Usage-based NRR is higher on average but materially more volatile, and that volatility itself is a risk investors now probe.
Hybrid pricing: the increasingly common middle. Many 2026 Series B companies run a hybrid — a platform/seat base fee plus usage-based consumption on top, or seats plus consumption-priced AI features. Done well, hybrid gives you the predictability of a committed base and the expansion upside of consumption.
It is also the model best positioned for the AI era, because AI features are naturally consumption-shaped. The hybrid model can realistically support 110-125% NRR while being less volatile than pure usage. The strategic point: your pricing model is not a billing detail — it is the single biggest lever on your structural NRR ceiling, and changing it is one of the highest-impact (and hardest) moves a Series B company can make.
Gross Retention Versus Net Retention: Which One Tells The Truth
This is the most important conceptual point in the entire NRR discussion, and the one most likely to be glossed over in a board deck. NRR can lie. GRR cannot.
Net Revenue Retention blends two opposing forces — expansion (good) and churn plus contraction (bad) — into a single number. A company can post a healthy-looking 112% NRR while quietly losing 18% of its customer base every year, because aggressive expansion from the customers who stay masks the damage from the customers who leave.
That is a leaky bucket with a fast tap. It looks fine until growth slows, expansion plateaus, and suddenly the churn that was always there is fully visible with nothing covering it.
Gross Revenue Retention strips out expansion and shows you only what you kept: GRR = (starting ARR − contraction − churn) ÷ starting ARR. It is capped at 100% by definition. GRR is the "true health" metric because it measures whether customers are actually staying and not shrinking — it cannot be inflated by a few whale accounts expanding.
A company with 112% NRR and 95% GRR is genuinely healthy. A company with 112% NRR and 80% GRR is in trouble and does not know it yet.
The GRR floors you should hold at Series B: 85% for SMB-focused, 90% for mid-market, 92%+ for enterprise. Below those floors, your NRR — however good it looks — is built on sand. Sophisticated investors at Series C will always ask for GRR alongside NRR for exactly this reason; if your deck shows NRR only, they will assume you are hiding a GRR problem.
The disciplined practice is to report both, always, side by side, and to treat GRR as the leading indicator of base health and NRR as the measure of how well you monetize the base you keep. When the two diverge — NRR strong, GRR weak — you have an expansion engine papering over a retention failure, and you must fix the retention failure first, because expansion built on a churning base is a treadmill.
The Expansion Levers That Drive NRR At Series B
NRR above 100% comes from expansion, and at Series B there are five distinct levers — each with different mechanics, ownership, and predictability.
Seat expansion. The customer adds users — new hires, new teams, broader rollout. This is the most common expansion lever for seat-priced SaaS and the most exposed to the customer's macro situation. It is driven by adoption depth: the more teams actively using the product, the more seats get added organically.
Seat expansion is best supported by making rollout frictionless and by giving champions the tooling to evangelize internally.
Tier upgrades. The customer moves from a lower package to a higher one — Standard to Professional to Enterprise — to unlock features, limits, security, or support. Tier upgrades are high-margin and relatively predictable if your packaging is designed so that growing customers naturally hit the ceiling of their current tier.
Bad packaging leaves customers comfortable forever on the cheap tier; good packaging creates natural upgrade pressure.
Cross-sell of modules. The customer buys an additional product or module — a second product line, an add-on capability. This is the highest-ceiling lever for multi-product companies and the reason platform strategies exist. At Series B, most companies have one or two cross-sell motions emerging; the discipline is to make the second module a natural extension of the first, sold to the same buyer.
Usage growth. For usage- or consumption-priced products, the customer simply consumes more as they succeed. This is the most powerful lever because it requires no sales motion, but it is also the least controllable — it follows the customer's own growth and behavior.
Price increases. Annual uplifts, list-price increases applied at renewal, inflation-indexed escalators. This is a real and legitimate NRR lever, often underused at Series B because founders fear churn. A 5-7% annual uplift on a sticky base is meaningful NRR contribution and, executed with notice and value framing, rarely drives churn among healthy accounts.
The mature expansion motion uses all five levers deliberately rather than hoping expansion "happens."
The Contraction And Churn Drivers To Hunt Down
If expansion is the engine of NRR, contraction and churn are the drag, and at Series B they come from four identifiable sources. You cannot fix what you have not isolated.
Seat reduction. The customer keeps the product but cuts licenses — usually because they cut headcount, sometimes because they over-bought initially and are right-sizing. This is the dominant contraction vector for seat-priced SaaS in the 2023-2026 environment and is largely macro-driven, which makes it frustrating but also somewhat predictable: watch your customers' hiring signals.
Downgrades. The customer moves to a cheaper tier — dropping from Enterprise to Professional, or dropping modules they decided they could live without. Downgrades signal a value perception problem: the customer no longer believes the premium tier is worth the premium. Downgrades are often preventable with proactive value demonstration before the renewal conversation.
Full churn. The customer leaves entirely. The reasons cluster: the business failed or was acquired (uncontrollable), a champion left and the replacement did not value the product (semi-controllable), the product failed to deliver value or was never adopted (fully controllable), or a competitor displaced you (controllable).
Full churn is the most damaging because it removes the entire expansion runway, not just current revenue.
The "silent contraction" problem. This is the most dangerous because it is invisible until renewal. A customer quietly stops using features, lets their seat count drift below what they pay for, or shifts usage to a competitor — and nothing in your billing system flags it because they are still paying the same amount today.
Then renewal arrives and the contraction lands all at once. Silent contraction is why product-usage telemetry and health scoring are not optional at Series B — they are the only early-warning system you have. The companies that hold NRR in 2026 are the ones that catch contraction in the usage data three to six months before it hits the revenue line.
What Investors Expect At Series B Heading Into Series C
NRR is, after growth rate itself, the metric venture investors most rely on to underwrite a SaaS business — and the bar to raise a Series C in 2026 is materially higher than it was in 2021.
Why investors weight NRR so heavily. NRR is a proxy for three things at once: product-market fit (customers who get value expand), capital efficiency (expansion revenue costs a fraction of new-logo revenue to acquire), and predictability (a high-NRR base means next year's revenue is largely already in the building).
A company with 120% NRR can theoretically grow 20% a year selling nothing to new customers. That optionality is enormously valuable to an investor underwriting a five-to-seven-year hold.
The Series C bar in 2026. To raise a competitive Series C, a SaaS company generally needs to show NRR at or above its segment benchmark — so 105%+ for SMB-heavy, 110%+ for mid-market, 115%+ for enterprise — combined with a healthy GRR floor and a credible expansion motion that is systematized rather than founder-dependent.
Investors will not just take the headline number; they will rebuild it from the data room, cohort it, segment it, and check whether NRR is stable, rising, or quietly declining across recent cohorts. A 115% NRR that has fallen from 128% over two years is a worse story than a stable 110%.
What gets you discounted or passed. Sub-100% NRR at Series B is close to disqualifying for an enterprise or mid-market company — it tells investors the base does not expand and growth is entirely a function of an expensive new-logo engine. Even at 100-105%, you will face skeptical questions and a lower multiple.
The rough heuristic investors apply: each 10 points of NRR below the segment benchmark costs roughly 0.5-1.0x off your forward-revenue multiple. Conversely, demonstrably elite NRR (125%+ in enterprise, with strong GRR) can pull your multiple up by a full turn or more, because it de-risks the entire forward model.
At Series C, NRR is not a vanity metric — it is a primary input to your valuation.
How NRR Interacts With CAC Payback And The Magic Number
NRR does not stand alone in the efficiency stack — it is mechanically entangled with CAC payback and the SaaS magic number, and a Series B operator who understands the interaction can make smarter resource decisions than one who tracks each metric in a silo.
The CAC payback connection. CAC payback measures how many months of gross-margin-adjusted revenue it takes to recover the cost of acquiring a customer. NRR changes that math directly. If a customer's revenue grows after acquisition — a 120% NRR account is worth 20% more next year for zero additional acquisition cost — then the effective payback period is shorter than the headline CAC payback suggests, because the denominator is growing.
A company with 90% NRR has the opposite problem: the account is shrinking under it, so the real payback is longer than the spreadsheet says. This is why two companies with identical headline CAC payback can have completely different capital efficiency: the one with higher NRR is recovering acquisition cost against an expanding base, the other against a contracting one.
At Series B, the disciplined view is CAC payback adjusted for NRR — the months to recover acquisition cost given that the account itself is growing or shrinking.
The magic number connection. The SaaS magic number measures how much new ARR you generate per dollar of sales and marketing spend. Expansion ARR is far cheaper to produce than new-logo ARR — it requires a CSM or AM conversation, not a full new-logo sales cycle with SDR, AE, and marketing-sourced pipeline.
So a company with high NRR generates a meaningful slice of its growth through the cheap channel, which lifts the blended magic number. A company with low NRR has to manufacture all its growth through the expensive new-logo channel, which depresses the magic number and burns capital faster.
The combined picture investors actually underwrite. Sophisticated Series C investors do not look at NRR, CAC payback, and the magic number separately — they look at the system. The company they want is the one where high NRR is making CAC payback effectively shorter and the magic number structurally higher, because that is a growth engine that compounds cheaply.
The company they fear is the one papering over a weak magic number and a long CAC payback with a new-logo engine that has to run hot forever. For a Series B founder, the takeaway is that improving NRR is not a customer-success project living off in a corner — it is a capital-efficiency project that improves the three metrics the next round will be priced on, simultaneously.
How Customer Concentration Distorts NRR
A blended NRR number assumes every dollar in the base behaves like every other dollar — and at Series B, that assumption is frequently false in a way that quietly misleads the board.
The whale-account problem. Many Series B companies, especially enterprise-motion ones, have a revenue base where the top 10-20% of accounts represent 50-70% of ARR. When a few of those whale accounts expand aggressively in a given period, blended NRR can read 125% even if the broad middle and long tail of the base are flat or contracting.
The headline says "the base is thriving." The reality is "three accounts had a great year and everything else is mediocre." This is not a hypothetical — it is one of the most common patterns a Series C diligence team uncovers, and it is exactly why investors rebuild NRR cohorted and segmented rather than trusting the blend.
Why concentration-distorted NRR is dangerous. A high NRR carried by a handful of accounts is fragile in a way a broadly-distributed high NRR is not. If one whale at 8% of ARR has a flat year next year — not even a bad year, just flat — your blended NRR can drop 8-12 points with no change whatsoever in the health of the other 95% of the base.
The number swings on a few accounts you do not fully control, which makes it nearly useless as a forecasting input and dangerous as a board-confidence signal. Concentration also tends to correlate with negotiating leverage: your biggest accounts know they are your biggest accounts, and their renewals and expansions come with the most pricing pressure.
How to read NRR through a concentration lens. The disciplined practice at Series B is to always present NRR with a concentration cut alongside the blend: NRR excluding the top 5 or top 10 accounts, NRR for the long tail separately, and the share of total expansion ARR that came from the top decile of accounts.
If your blended NRR is 122% but your ex-top-10 NRR is 103%, you do not have a 122% company — you have a 103% company with a few great accounts, and your real expansion motion needs work. This is not pessimism; it is accuracy. The companies that hold NRR durably are the ones whose strong number is broadly distributed across the base, because that number is resilient to any single account's bad quarter.
Concentration-adjusted NRR is the version of the metric that survives both a downturn and a diligence process.
The Rule Of 40 Connection
NRR does not live in isolation — it feeds directly into the Rule of 40, the efficiency benchmark that pairs growth and profitability. The Rule of 40 says a healthy SaaS company's revenue growth rate plus its profit margin should sum to 40 or more. NRR is the hidden engine underneath the growth half of that equation.
Here is the mechanical link. Your total revenue growth has two sources: expansion from the existing base (governed by NRR) and revenue from new logos. If your NRR is 120%, you start each year already 20% ahead before you sell anything new — new logo sales are pure additive growth on top.
If your NRR is 100%, every point of growth has to be manufactured by the new-logo engine, which is far more expensive in sales and marketing spend. So a high NRR makes the Rule of 40 dramatically easier to clear, because expansion revenue is high-margin and low-cost-to-acquire — it improves both the growth term and the margin term simultaneously.
This is why investors look at NRR and the Rule of 40 together. A company growing 50% with 130% NRR is in a fundamentally healthier position than a company growing 50% with 100% NRR, even though the headline growth rate is identical — the first company's growth is cheap and durable, the second's is expensive and fragile.
The first company can hit the Rule of 40 by simply being modestly profitable; the second has to either spend heavily to keep the new-logo engine running (hurting margin) or accept slowing growth.
The strategic takeaway for a Series B founder: when you improve NRR, you are not just improving one metric — you are improving the efficiency of your entire growth model. Ten points of NRR is worth far more than ten points of new-logo growth, because expansion growth comes at a fraction of the cost.
The companies that clear the Rule of 40 comfortably in 2026 are, almost without exception, the companies with strong NRR doing the heavy lifting.
Cohort Analysis Mechanics
A single blended NRR number is nearly useless for diagnosis — the real signal is in cohort analysis, which means tracking NRR separately for each group of customers based on when they signed up.
How it works. Take every customer who signed in Q1 2024 and treat them as a cohort. Track that cohort's total ARR every quarter thereafter. A healthy cohort's ARR line rises over time — expansion outpaces churn.
An unhealthy cohort's line falls. You repeat this for the Q2 2024 cohort, the Q3 cohort, and so on, building a stack of cohort curves. Now you can see things a blended number hides.
What the cohort curves tell you. First, the trend across cohorts: if your Q1 2024 cohort retained better than your Q1 2025 cohort at the same age, your product or your ideal-customer targeting is degrading — newer customers are worse-fit or less satisfied. That is an early warning a blended number would never surface, because the blend is dominated by your large, mature, healthy cohorts.
Second, the maturation curve: most cohorts dip in the first few quarters as the worst-fit customers churn out, then stabilize or climb as the survivors expand. Knowing the shape of your normal maturation curve lets you spot an abnormal cohort immediately.
Why it matters for Series B specifically. As you scale, you change your ICP, your pricing, your sales motion, and your onboarding — and each change shows up first in the newest cohorts. Cohort analysis is how you catch a strategy mistake six months before it contaminates the blended number.
Investors at Series C will ask for the cohort table directly. The discipline: build a cohort NRR view in your BI tool, review it every board cycle, and watch the trend line across cohorts as carefully as you watch the absolute number. A rising blended NRR with deteriorating recent cohorts is a company about to hit a wall.
NRR Measurement Pitfalls That Mislead Boards
NRR is deceptively easy to compute and remarkably easy to compute in a way that misleads. Five pitfalls account for most of the bad numbers presented to boards.
Annual versus monthly cohorts. A monthly NRR, annualized by compounding, almost always reads higher and smoother than a true trailing-twelve-month cohort measurement, because it never captures the full lumpy reality of an annual renewal cycle. If your contracts are annual, your NRR should be measured on annual cohorts.
Mixing the two — or quietly switching — is a classic way to manufacture an improving trend that is not real.
Including or excluding new logos. NRR must exclude revenue from customers acquired during the measurement period. It sounds obvious, but a surprising number of homegrown spreadsheets accidentally let new-logo revenue leak into the numerator, which inflates NRR and makes it meaningless — at that point you are just measuring total ARR growth with extra steps.
Currency effects. For companies with international revenue, FX swings move ARR without any customer behavior changing at all. A customer in euros who did nothing can show as expansion or contraction purely from exchange rates. Mature reporting normalizes for currency or discloses the FX impact separately; otherwise NRR becomes partly a macro-currency bet.
Mid-period movement and timing. When expansion lands, when churn is recognized, how mid-term upsells are counted — small methodology choices here can swing NRR by several points. The fix is a written, consistent methodology, not a different judgment call each quarter.
The "blended NRR hides segment problems" trap. This is the most consequential. A single company-wide NRR number is an average that can be entirely healthy while hiding a segment that is bleeding. A company with 112% blended NRR might have a 128% enterprise segment masking a 92% SMB segment that is quietly destroying value.
The board sees 112% and relaxes; the SMB business is on fire. Always segment NRR before you present it — by customer size, by product line, by acquisition channel — because the blend is exactly where problems hide.
How To Diagnose A Falling NRR
When NRR drops, the instinct is to react fast — but reacting before you diagnose wastes the quarter. There is a disciplined sequence.
Step one: segment it. Break the blended number apart by customer size, by product line, by geography, by acquisition cohort. NRR almost never falls uniformly — it falls in a specific segment, and the blended number just averages the damage across the healthy parts. You cannot fix a problem you have not located.
If SMB NRR went from 100% to 88% while enterprise held at 122%, you have an SMB problem, not an NRR problem, and the fix is entirely different.
Step two: cohort it. Within the troubled segment, look at the cohort curves. Is the decline coming from old cohorts suddenly deteriorating (something changed in your product or market that is now hurting even loyal customers) or from new cohorts retaining worse than old ones did at the same age (your ICP targeting, onboarding, or sales qualification has degraded)?
These point to completely different root causes.
Step three: separate GRR from expansion. Decompose the NRR drop into its components. Did GRR fall — meaning more churn and contraction — or did expansion fall while GRR held? This is the single most important fork.
A GRR problem is a retention and value-delivery problem: customers are leaving or shrinking, and the fix lives in product, onboarding, support, and customer success. An expansion problem is a monetization and growth problem: customers are staying but not growing, and the fix lives in packaging, the expansion playbook, the value metric, and expansion ownership.
Pouring expansion-motion resources onto a GRR problem does nothing — you are trying to grow a base that is leaking.
Step four: find the specific mechanism. Within GRR, is it logo churn or seat contraction or downgrades? Within expansion, which lever stalled — seats, tiers, cross-sell, usage? Only now, with the problem segmented, cohorted, decomposed, and mechanism-identified, do you deploy a targeted fix.
The discipline saves quarters: most teams that "work on NRR" are working on a blended average and a vague intuition. The teams that recover NRR fast are the ones that diagnosed precisely first.
The CS-Sales Ownership Question
One of the most consequential and most-fumbled decisions at Series B is who owns expansion revenue — and therefore who is accountable for NRR. There are three common models, each with real tradeoffs.
CSM-owned expansion. The Customer Success Manager owns the relationship and the expansion number. The argument: the CSM has the trust, the usage visibility, and the context to spot and drive expansion naturally. The risk: many CSMs are hired and wired as relationship-and-adoption people, not closers, and asking them to carry a quota can corrupt the trusted-advisor relationship that makes them effective in the first place.
This model works when CSMs are genuinely commercial and comped for it.
AM-owned expansion. A dedicated Account Manager — a commercial role distinct from the post-sale CSM — owns expansion and renewal. The CSM drives adoption and health; the AM drives the commercial conversation. The argument: clean separation of concerns, expansion owned by someone trained and comped to sell.
The risk: handoff friction and the customer feeling "sold to" by someone who is not their day-to-day contact. This is the most common model at scaled enterprise SaaS.
AE-owned expansion. The original Account Executive who closed the deal keeps the account and owns expansion. The argument: continuity and existing relationship. The risk: AEs are usually compensated and culturally oriented toward new logos and tend to neglect the existing book once the next quarter's new-logo quota looms.
The comp implications are the real decision. Whoever owns expansion must be measured and paid on it — NRR accountability without NRR compensation is theater. At Series B, the pragmatic answer is usually: CSMs own health and adoption (and are measured on GRR and a health metric), while a commercial role — AM or a commercially-comped CSM — owns the expansion number and carries an NRR or expansion-bookings target.
The fatal pattern is diffuse ownership: when "everyone" owns NRR, no one does, and the number drifts. Pick an owner, give them the comp, and make the board scorecard reflect it.
Building An Expansion Motion
A strong NRR is the output of a deliberately engineered expansion motion, not a happy accident. At Series B the motion has five components that work together.
QBRs that earn their name. Quarterly Business Reviews should not be status updates — they should be value-demonstration and roadmap-alignment sessions where you show the customer the ROI they have realized, surface unmet needs, and naturally tee up the next expansion. A QBR cadence with executive sponsors on enterprise accounts is the single highest-leverage expansion ritual.
Health scoring. A composite score — built from product usage depth, breadth of adoption across teams, support sentiment, champion engagement, and stakeholder coverage — that tells you which accounts are expansion-ready and which are at risk. Health scoring is what makes expansion proactive instead of reactive: you target the healthy accounts for expansion conversations and the at-risk accounts for rescue.
Expansion playbooks. Documented, repeatable plays for each expansion lever: the "add a second team" play, the "upgrade to the next tier" play, the "attach the second module" play, each with triggers, talk tracks, and offers. Playbooks turn expansion from individual heroics into a systematized motion that survives rep turnover — which is exactly what investors mean when they ask if your NRR is "repeatable."
Usage-based triggers. Automated signals that fire when an account crosses a threshold — approaching a plan limit, a new team starting to log in, a usage spike — routing a timely expansion conversation to the owner. For usage- and hybrid-priced products this is the core of the motion.
Land-and-expand mechanics. Deliberately landing in a way that creates expansion runway: starting with one team or one use case in an account with many, with the explicit plan and the relationship map to expand. The land is designed for the expand. Together these five components form a motion that produces NRR predictably — which is the difference between a company that hopes its NRR holds and one that knows it will.
Reducing Contraction
Expansion gets the attention, but at Series B in 2026 — with contraction running structurally high — reducing the downside is often the faster NRR win. Four disciplines matter.
Proactive health monitoring. The same health score that targets expansion targets risk. An account whose usage is declining, whose champion has gone quiet, or whose seat utilization is drifting below paid level is a contraction event forming months before renewal. The entire point of monitoring is to intervene while intervention is still possible — once the customer has decided to cut, you are negotiating, not saving.
A save-desk. A dedicated, trained function — or at minimum a defined process — for handling at-risk renewals and downgrade requests. The save-desk has plays: re-onboarding, executive engagement, targeted discounting tied to commitment, repackaging to fit a reduced budget without full churn.
The save-desk converts what would be churn into contraction, and contraction into flat renewal. Companies without a save-desk simply take the churn.
Downgrade-prevention plays. Most downgrades are value-perception failures that surface at renewal. Catching them earlier — through health monitoring and QBRs that re-establish value before the renewal conversation — prevents the downgrade entirely. When a downgrade is genuinely budget-driven, a downgrade-prevention play might offer a smaller package or a longer term at the lower price rather than losing the tier entirely.
Multi-year contracts. The most structural contraction-reduction tool available. A two- or three-year contract removes the annual renewal decision point — and the annual opportunity to contract — for the contract term. Multi-year deals trade some price (customers expect a discount) for retention certainty, and at Series B that trade is usually worth making for your best-fit accounts, because it converts a portion of your base into locked, contraction-proof revenue.
Multi-year coverage of your top accounts is one of the cleanest ways to put a floor under GRR, and a strong GRR floor is what makes any NRR number trustworthy.
Pricing And Packaging For NRR
The deepest lever on NRR is not the expansion motion or the save-desk — it is whether your pricing and packaging are designed so that growing customers naturally pay you more. This is a design decision made long before the CSM ever has an expansion conversation.
Value-metric alignment. The core principle: the thing you charge for (the value metric) should scale with the value the customer receives. If a customer who gets twice the value from your product pays you roughly twice as much, expansion is automatic — it happens as the customer succeeds, with no friction.
If your value metric is disconnected from value — a flat platform fee, or a seat count that does not track value — then expansion requires a sales motion to manufacture, and NRR caps out. The classic well-aligned metrics are consumption-based (data, compute, transactions, messages) precisely because they track value naturally.
Seat-based pricing is aligned only when more seats genuinely means more value, which is true for collaboration products and false for many others.
Tier design that creates upgrade pressure. Packaging should be built so that a customer who is growing and succeeding naturally hits the ceiling of their current tier — runs into a limit, needs a feature locked to the next tier, needs the security or support that comes with Enterprise.
Good tier design makes the upgrade feel inevitable rather than sold. Bad tier design — where the cheap tier is "good enough" forever — strands customers and caps NRR.
Designing the second module in. For multi-product strategy, the cross-sell module should be designed as a natural extension that the same buyer wants once the first product is embedded — not a random adjacency that requires a whole new sales cycle to a whole new buyer.
Packaging for the AI era. AI features are naturally consumption-shaped and, packaged well, become a new expansion lever — an AI add-on priced on usage that grows as adoption deepens. The strategic point for a Series B founder: if your NRR is structurally capped, the answer is often not a better expansion team — it is a repricing and repackaging project.
It is hard, it is risky, and it is the highest-ceiling NRR move available.
The Usage-Based Pricing NRR Advantage
Usage-based pricing deserves its own treatment because it changes the structural physics of NRR — and because the 2026 market increasingly rewards it.
Why consumption models structurally produce higher NRR. In a usage-based model, expansion is the default state of a successful customer. A customer who adopts the product and grows their own business consumes more — more data stored, more API calls, more compute, more transactions — and your revenue rises automatically, with zero sales motion, zero renewal negotiation, zero friction.
The customer's success is mechanically your expansion. This is why the canonical high-NRR public companies — Snowflake, Datadog, and their peers — are consumption-priced: their NRR is not the product of a heroic expansion team, it is the product of a pricing model that converts customer growth directly into vendor revenue.
A seat-based company has to sell every expansion; a usage-based company harvests it.
The volatility risk that cuts the other way. The same mechanism that makes usage-based NRR high makes it unstable. When a customer has a slow quarter, optimizes their usage, re-architects to be more efficient, or hits a budget freeze, consumption drops — and so does your revenue, immediately, with no renewal event to defend it and often no warning.
Usage-based NRR can swing 15-20 points between quarters on macro conditions alone. A seat-based company with annual contracts has revenue that is locked for the term; a usage-based company has revenue that floats on customer behavior in real time. Investors in 2026 have learned to probe this — they will ask about usage concentration, about how much NRR comes from a handful of whale accounts whose consumption could drop, and about the volatility of the NRR series itself.
The 2026 verdict. Usage-based and hybrid models have a real, structural NRR advantage and are increasingly the default for new infrastructure and AI-native SaaS. But the advantage comes with volatility that must be managed — through usage commitments, minimum floors, and diversification away from whale concentration.
The high average is real; so is the variance.
Five Real Benchmark References
Public-company NRR disclosures are the best available calibration for what good actually looks like — the numbers are audited, comparable, and disclosed every quarter. Five reference points span the relevant range for a Series B founder.
Snowflake — roughly 125-130% (and historically much higher). Snowflake is the canonical usage-based, enterprise-data-infrastructure NRR machine. At its peak it disclosed NRR well above 165%; it has compressed substantially as the base matured and customers optimized, settling into the mid-to-high 120s in recent disclosures.
The lesson: even the best usage-based NRR compresses as the base scales and the law of large numbers takes hold — and a "declining" 128% is still elite.
Datadog — roughly 115%. Datadog, also usage-based and enterprise-infrastructure, has run a remarkably durable NRR — for many quarters it disclosed NRR above 130%, and it has compressed toward the mid-110s in the recent environment. It is the benchmark for a healthy, scaled, consumption-priced platform.
HubSpot — roughly 100-105%. HubSpot serves a large SMB and lower-mid-market base, mostly seat-and-tier priced. Its NRR sits around or just above 100% — which, for that segment, is solid. HubSpot is the proof point that an SMB-heavy model is a volume-and-new-logo game, and that 100-105% NRR there is not a weakness but a structural reality of the segment.
Monday.com — roughly 110%. Monday.com spans SMB through mid-market with a seat-based model and lands around 110% NRR — a clean benchmark for a horizontal, seat-priced, mid-market-leaning SaaS company, which describes a large share of Series B companies.
Klaviyo — roughly 115%. Klaviyo, serving e-commerce with pricing tied to contacts and sends (a value-aligned, consumption-flavored metric), runs NRR around 115% — illustrating how a value-aligned metric lifts NRR even outside pure infrastructure. Together these five map the terrain: SMB-seat around 100-105%, mid-market-seat around 110%, value-aligned/usage 115-130%.
Benchmark yourself against the comp that matches your segment and model — not against the highest number on the list.
The NRR-Valuation Multiple Link
NRR is not just an operating metric — it is one of the most direct inputs into how the market values a SaaS company, and a Series B founder should understand the mechanics because they govern the Series C and every round after.
Why NRR drives the multiple. A revenue multiple is fundamentally a bet on future growth and the durability of that growth. NRR speaks directly to both. A company with 130% NRR has growth that is largely already contracted — it is durable, high-margin, and cheap to produce.
A company with 100% NRR has growth that must be bought fresh every year through sales and marketing — it is fragile and expensive. The market pays far more for the first kind of growth, so it pays a higher multiple for the company that produces it.
The rough mapping. As a heuristic that holds across most market conditions: each 10 points of NRR is worth roughly 0.5-1.0x of forward revenue multiple, with the effect strongest in the bands that matter most — the move from sub-100% to 110% is worth more than the move from 130% to 140%, because crossing 100% changes the entire growth story.
In the 2026 market, a Series B/C-stage enterprise SaaS company with 95% NRR might trade at a meaningfully compressed multiple, the same company at 115% trades at a market multiple, and at 130% it trades at a premium — a spread of several turns of revenue from end to end on a metric that is, in principle, controllable.
The strategic implication. This is why NRR work has a higher ROI than almost any other operating improvement at Series B. Ten points of NRR does not just add expansion revenue this year — it re-rates the entire enterprise value, because it changes the market's assessment of how durable and how cheap all future growth will be.
When a founder asks "what is improving NRR worth," the honest answer includes the multiple expansion, not just the incremental ARR — and that makes the math dramatically more compelling than the operating P&L alone suggests.
Forecasting NRR Forward
A backward-looking NRR tells you what happened; a Series B company needs to forecast where NRR is going, because the board and the next investor will ask. NRR is forecastable because it has leading indicators that move months ahead of the revenue line.
Health scores as the primary leading indicator. The aggregate distribution of account health scores today predicts the GRR component of NRR two to three quarters out. If the share of accounts in the "at-risk" band is growing, contraction and churn are coming — the revenue has not moved yet, but the leading indicator has.
Tracking the health-score distribution over time, not just the average, is the core of NRR forecasting.
Product usage trends. Usage depth and breadth — daily and weekly active users, feature adoption, the number of teams active in an account — lead both expansion and contraction. Rising usage breadth across an account precedes seat and module expansion; declining usage precedes contraction.
For usage-priced products, the usage trend is the revenue forecast.
Support ticket trends. A rising volume of certain ticket types, falling support sentiment, or escalations clustering in a segment are early signals of dissatisfaction that will show up in renewals later. Support data is an underused NRR leading indicator.
Champion turnover. When a champion leaves a customer, the account's risk jumps — the new stakeholder did not buy the product and may not value it. Tracking champion and key-stakeholder changes across the base is a direct leading indicator of churn risk, and a trigger for immediate re-engagement.
Putting it together. A credible NRR forecast combines the contracted expansion and renewal pipeline (what is scheduled to happen) with a leading-indicator overlay (health distribution, usage trend, support sentiment, champion changes) to adjust for what the raw pipeline does not capture.
The companies that forecast NRR well are the ones that treat it as a leading-indicator problem, not a spreadsheet extrapolation — and that distinction is exactly what a sophisticated Series C investor is testing when they ask how you forecast retention.
NRR Dashboard Design
NRR only drives behavior if it is instrumented and visible. A Series B company needs a real NRR dashboard, and getting the design right is half the battle.
The core fields. At minimum: NRR and GRR side by side; both decomposed into the components — starting ARR, expansion, contraction, churn; segmented by customer size, product line, and acquisition cohort; and trended over enough history to see direction, not just level. A dashboard that shows a single blended NRR number is worse than useless because it creates false confidence.
The cohort views. Beyond the blended number, the dashboard needs the cohort table — NRR by signup cohort, agable so you can compare cohorts at the same age — and the segment cuts that reveal where the blend is hiding problems. The cohort view is what turns the dashboard from a scorecard into a diagnostic tool.
The cadence. NRR is a trailing-twelve-month metric and does not need daily refresh, but the leading indicators feeding it — health scores, usage, pipeline — should be near-real-time. The discipline: a monthly NRR review at the leadership level, a quarterly deep-dive at the board level, and always-on leading-indicator dashboards for the CS and account teams who act on them.
The reconciliation problem. The hardest and most important part of dashboard design is data integrity. NRR is computed from the intersection of your CRM (Salesforce or equivalent) and your billing system, and these two systems disagree constantly — a deal marked closed-won in the CRM that is not yet billing, a billing change not reflected in the CRM, currency handled differently in each.
The NRR number is only as trustworthy as the CRM-to-billing reconciliation behind it. Before a Series C, a company should be able to tie its NRR back to billed revenue exactly, with a documented reconciliation. Investors will test this — a beautiful dashboard built on un-reconciled data is a liability, because the moment the diligence team finds the gap, every number you have presented is in question.
Build the reconciliation first, then build the dashboard on top of it.
The "NRR Treadmill" Trap
NRR is a metric, and like every metric it can be gamed in ways that look good on the scorecard and quietly damage the business. The "NRR treadmill" is the pattern of chasing the number in ways that are locally rational and globally destructive.
Over-discounting expansion to manufacture the number. A team under pressure to hit an NRR target can simply discount its way to expansion bookings — give customers more product at a price that does not reflect value, just to get the expansion line up. The NRR number rises; the unit economics quietly rot.
This is expansion revenue that costs more to produce than it is worth, and it shows up later as margin compression and a base that has been trained to expect discounts.
Ignoring new-logo growth because expansion is easier. Expansion revenue is cheaper and easier to produce than new-logo revenue, so a team that is measured heavily on NRR will rationally tilt all its energy toward the existing base. The NRR number looks great. Meanwhile the new-logo engine atrophies, and the company slowly becomes a business that can only grow its existing customers — which means its total growth ceiling is now capped by its existing base, and the moment expansion plateaus, growth stops entirely.
A high NRR with a broken new-business engine is a company with a hard ceiling it cannot see.
Degrading product focus to chase expansion revenue. Chasing cross-sell and module expansion can pull product and engineering toward building whatever the existing base will pay for next, rather than what wins the market. The expansion revenue is real; the strategic drift is also real.
The discipline. NRR is a means, not an end. The end is durable, efficient, profitable growth — which requires expansion AND new logos AND healthy unit economics AND product focus. NRR should be measured and managed alongside new-logo growth, CAC, gross margin, and the Rule of 40, never in isolation.
The moment NRR becomes the metric a team optimizes at the expense of the others, it has stopped measuring health and started manufacturing the appearance of it. A board that asks only "what is NRR" is training its company onto the treadmill.
Board Reporting On NRR
How a Series B company presents NRR to its board shapes how the board thinks — and a founder has a choice between an honest framing and a vanity framing every quarter.
What to present. The board deck should show NRR and GRR together, every time, with no exception — showing NRR alone signals you are hiding GRR. It should show the decomposition: how much of the change is expansion, how much is contraction, how much is churn. It should show the segment cuts — by customer size, by product line — because the blended number is where problems hide and a board that only sees the blend cannot govern.
And it should show the trend across recent cohorts, so the board can see whether NRR is improving, stable, or quietly eroding underneath a flat headline.
The honest framing versus the vanity framing. The vanity framing picks the cut that looks best — the enterprise segment, the mature cohorts, the quarter that happened to have a big expansion land — and presents it as the company number. The honest framing leads with the blended number, then shows the cuts that are weak and names them as the focus areas.
The vanity framing buys a comfortable board meeting and a brutal Series C diligence process when the investor rebuilds the number and finds the SMB segment the board never saw. The honest framing buys an uncomfortable board meeting and a clean diligence.
Why honesty compounds. Board members are also your references and often your bridge to the next round's investors. A founder who has presented NRR honestly — including the weak cuts — has a board that trusts the numbers and will defend them. A founder who has been managing the board's perception with favorable cuts has a board that, the moment diligence surfaces the gap, no longer trusts anything.
At Series B, with a Series C in sight, the reporting discipline you build now is the credibility you spend later. Present the number that diligence will rebuild, present it first, and present it with the weak segments named — that is the framing that survives contact with a real investor.
Five-Year Outlook: AI's Double-Edged Effect On NRR
The single biggest force shaping NRR over the next five years is AI, and its effect is genuinely double-edged — it is both the largest contraction risk and the largest expansion opportunity in the SaaS model, often inside the same company.
The contraction edge. AI makes customers more efficient, and for seat-priced vendors, efficiency at the customer is contraction at the vendor. As customers adopt AI — both standalone tools and AI features inside the products they already buy — they need fewer people to do the same work.
The support team that needed 50 seats needs 35. The sales team automates SDR work. The analyst team does with 6 what took 10.
Every one of those is a seat-priced vendor losing revenue with no product failure, no dissatisfaction, no competitive loss — just structural deflation of the seat as a unit. Over five years, this is the dominant downward pressure on seat-based NRR, and it is why the seat model's structural ceiling is likely to keep falling.
The expansion edge. At the same time, AI features are the most powerful new expansion lever the SaaS model has seen in a decade. AI capabilities — copilots, agents, automation, generation — are naturally consumption-shaped and command real willingness to pay. A vendor that ships AI features as a usage-priced add-on creates an expansion vector that grows as adoption deepens, entirely independent of seat count.
The companies that win on NRR over the next five years are the ones that use AI-driven expansion to more than offset AI-driven seat contraction.
The strategic divergence. This double edge will split the SaaS landscape. Companies that stay purely seat-priced and do not build a consumption-shaped AI expansion lever will watch NRR erode as their customers get more efficient. Companies that shift toward hybrid and usage-based pricing and package AI as a consumption-priced expansion vector will see NRR hold or rise.
The five-year NRR outlook is not a single trend — it is a divergence, and which side a company lands on is determined by pricing-model and packaging decisions made now, at Series B. The benchmark bands themselves will likely keep compressing for seat-based models and holding or rising for usage-based ones, widening the gap this entry already describes.
Final Framework: The Path From 105% To 120%
Pulling it together into a usable framework for a Series B founder, CRO, CFO, or RevOps leader.
Target NRR by segment and model. Set your target by the intersection of segment and pricing model, not a single company-wide number. SMB-seat: target 100-108%. Mid-market-seat: target 108-115%.
Enterprise-seat: target 115-122%. Add 5-15 points if you are usage-based or hybrid with strong PMF. Hold the GRR floor underneath it: 85% SMB, 90% mid-market, 92%+ enterprise.
If your NRR is at target but GRR is below floor, fix GRR first — the NRR is not real.
The diagnostic checklist. Before any fix: Is the number segmented, or are you looking at a blend that hides a problem? Is it cohorted, so you can see whether new cohorts retain worse than old? Is the NRR drop a GRR problem (retention, value delivery — fix in product, onboarding, CS) or an expansion problem (monetization — fix in packaging, playbooks, ownership)?
Which specific mechanism — logo churn, seat contraction, downgrade, or a stalled expansion lever — is driving it? Diagnose precisely before deploying resources.
The path from 105% to 120%. It is a two-front campaign, not a single initiative. On the contraction front: build proactive health monitoring, stand up a save-desk, run downgrade-prevention plays, and put multi-year contracts under your best accounts — this lifts the GRR floor and stabilizes the base.
On the expansion front: establish clear single-owner accountability for expansion with matching comp, run real QBRs, build health scoring and documented expansion playbooks, wire up usage-based triggers, and — the deepest lever — align your value metric and tier design so growing customers naturally pay more.
Layer in disciplined annual price increases. Do the contraction work first because expansion built on a leaking base is a treadmill; then the expansion work compounds. Fifteen points of NRR is not a quarter's project — it is a four-to-six-quarter operating campaign, and it is worth more to enterprise value than almost anything else on the Series B roadmap, because it does not just add revenue, it re-rates the multiple on all the revenue.
NRR Calculation Waterfall: How The Number Is Built
Diagnosing A Falling NRR: The Decision Tree
FAQ
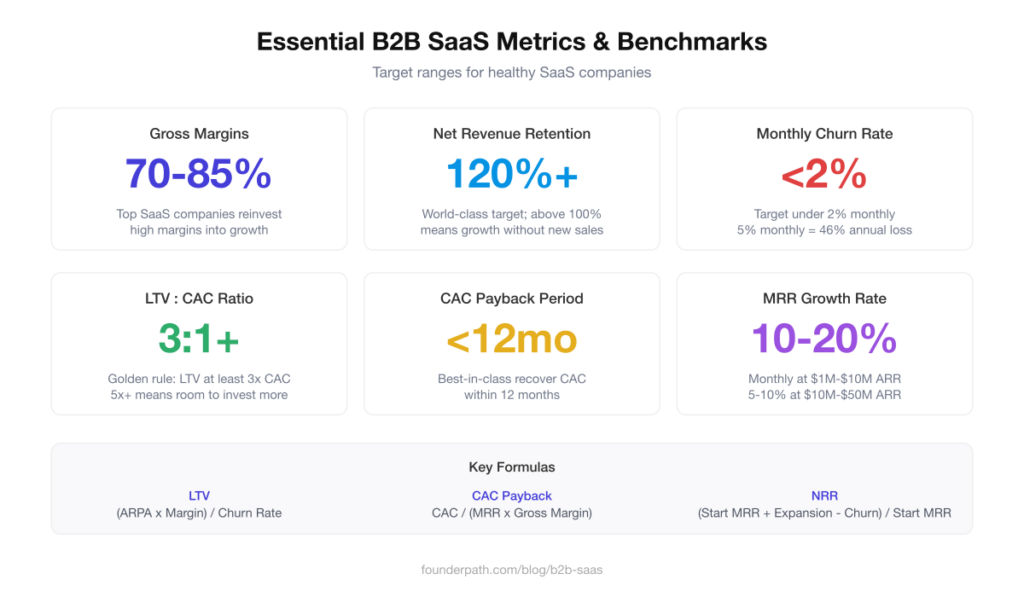
What NRR counts as good for a Series B SaaS company in 2026? For a Series B company at $10M-$50M ARR in 2026, 105-115% NRR is solid and fundable, 115-125% is strong and will attract competitive term sheets, and 125%-plus is genuinely elite and rare. Anything below 100% is a structural red flag that will block your Series C, and the 100-105% range is a yellow zone that invites hard questions about whether the expansion motion is real.
Why have NRR benchmarks compressed since 2021? The numbers have fallen roughly 10-20 points from the 2021 peak, when 120%-plus was so common that VCs treated it as table stakes. The end of ZIRP, brutal budget scrutiny, seat-based contraction, and increasingly AI-driven efficiency that lets customers do more with fewer seats have all pulled the median down.
A founder quoting "we're at 112%, below the 120% benchmark" is working from a stale benchmark — 112% is perfectly respectable in 2026.
How does NRR vary by segment and pricing model? Segment matters more than stage: SMB-focused Series B SaaS realistically lands at 95-105%, mid-market at 105-115%, and enterprise at 115-130%. Pricing model matters just as much — pure seat-based pricing is structurally vulnerable to contraction and caps around 105-115%, while usage-based pricing with real product-market fit (the Snowflake/Datadog pattern) can reach 115-140%.
Why is GRR the truer health metric than NRR? NRR can mask a leaky bucket because expansion revenue papers over churn, so GRR is the truer health metric. Hold a GRR floor of 85% for SMB, 90% for mid-market, and 92%-plus for enterprise. Before spending a dollar fixing NRR, separate the GRR problem from the expansion problem — they have different cures.
How will investors translate NRR into valuation? Investors underwriting your Series C treat NRR as the number-one SaaS health metric, second only to growth rate itself, and will discount your valuation multiple by roughly 0.5-1.0x of forward revenue for every 10 points of NRR below the segment benchmark.
The defensible reporting standard is a trailing-twelve-month, dollar-based, cohort-locked NRR reported alongside GRR with new-logo revenue excluded — pick one definition and never change it mid-fundraise, because investors will rebuild your number from the data room.
Numbers
2026 NRR Benchmark Bands — Series B SaaS ($10M-$50M ARR)
- Below 100%: red flag — base is shrinking, blocks Series C
- 100-105%: yellow zone — fundable but heavily questioned
- 105-115%: solid — fundable, market-standard
- 115-125%: strong — attracts competitive term sheets
- 125%+: elite — rare, premium multiple
NRR Compression 2021 to 2026
- Median venture-backed B2B SaaS NRR decline: ~10-20 points
- 2021 typical Series B deck NRR: 120-130%+
- 2026 typical Series B fundable NRR: 105-115%
- Distribution width (best vs median gap): widened materially
NRR By Segment (Series B, 2026)
- SMB-focused: 95-105% realistic
- Mid-market-focused: 105-115% realistic
- Enterprise-focused: 115-130% realistic
- SMB annual logo churn: 25-40% (2-4%/month)
- Mid-market annual logo churn: 8-15%
- Enterprise annual logo churn: 3-8%
NRR By Pricing Model
- Seat-based: 105-115% typical (structurally capped)
- Usage-based with strong PMF: 115-140%
- Hybrid (base + consumption): 110-125%, lower volatility than pure usage
- Usage-based quarter-to-quarter NRR swing: 15-20 points possible on macro alone
GRR Floors To Hold At Series B
- SMB-focused: 85% floor
- Mid-market-focused: 90% floor
- Enterprise-focused: 92%+ floor
- GRR is capped at 100% by definition; NRR is not
Public Company NRR References (recent disclosures, approximate)
- Snowflake: ~125-130% (down from 165%+ peak)
- Datadog: ~115% (down from 130%+)
- HubSpot: ~100-105% (SMB/lower-mid-market seat-and-tier)
- Monday.com: ~110% (horizontal seat-based, SMB to mid-market)
- Klaviyo: ~115% (value-metric-aligned, contacts/sends)
NRR-to-Valuation Multiple Link
- Heuristic: each 10 points of NRR ≈ 0.5-1.0x forward revenue multiple
- Effect strongest crossing the 100% threshold
- Sub-100% NRR enterprise SaaS: meaningfully compressed multiple
- 115% NRR: roughly market multiple
- 130%+ NRR with strong GRR: premium multiple (several turns spread end-to-end)
Series C Bar (2026)
- SMB-heavy: 105%+ NRR
- Mid-market: 110%+ NRR
- Enterprise: 115%+ NRR
- Plus: healthy GRR floor + systematized (not founder-dependent) expansion motion
- Investors rebuild NRR from the data room — cohorted and segmented
The Five Expansion Levers
- Seat expansion — most common for seat-priced; most macro-exposed
- Tier upgrades — high-margin, predictable with good packaging
- Cross-sell modules — highest ceiling for multi-product
- Usage growth — most powerful, least controllable
- Price increases — 5-7% annual uplift is meaningful, often underused
The Four Contraction/Churn Drivers
- Seat reduction — dominant 2023-2026 vector, macro-driven
- Downgrades — value-perception failure, often preventable
- Full churn — most damaging, removes entire expansion runway
- Silent contraction — invisible until renewal; only telemetry catches it
Rule of 40 Connection
- Rule of 40 = revenue growth rate + profit margin ≥ 40
- 120% NRR = 20% growth before any new-logo sale
- 100% NRR = all growth must be bought via new-logo engine
- High NRR improves both the growth term and the margin term simultaneously
- 10 points of NRR worth more than 10 points of new-logo growth (cost-to-acquire)
Cohort & Diagnostic Mechanics
- Diagnostic sequence: segment it → cohort it → separate GRR from expansion → find mechanism
- GRR problem → fix in product/onboarding/CS
- Expansion problem → fix in packaging/playbooks/ownership
- Cohort signal: new cohorts retaining worse than old = ICP/onboarding degradation
- Cohort signal: old cohorts suddenly decaying = market/product shift
Expansion Motion Components
- QBRs with executive sponsors on enterprise accounts
- Health scoring (usage depth, breadth, sentiment, champion engagement)
- Documented expansion playbooks per lever
- Usage-based triggers (plan-limit approach, new-team login, usage spike)
- Land-and-expand: land designed for the expand
Contraction-Reduction Tools
- Proactive health monitoring — intervene before the decision is made
- Save-desk — converts churn to contraction, contraction to flat
- Downgrade-prevention plays — re-establish value pre-renewal
- Multi-year contracts — removes the annual contraction decision point
NRR Forecasting Leading Indicators
- Health-score distribution — leads GRR 2-3 quarters
- Product usage trends (DAU/WAU, feature adoption, teams active)
- Support ticket volume and sentiment trends
- Champion / key-stakeholder turnover
- Forecast = contracted pipeline + leading-indicator overlay
The NRR Treadmill Traps
- Over-discounting expansion to manufacture the number
- Neglecting new-logo growth because expansion is cheaper
- Degrading product focus to chase cross-sell revenue
- NRR must be managed alongside new-logo growth, CAC, gross margin, Rule of 40
Five-Year Outlook (AI Double Edge)
- Contraction edge: AI efficiency cuts customer seat counts (50→35 support seats typical pattern)
- Expansion edge: AI features as usage-priced add-on = new expansion lever
- Divergence: pure-seat models compress; usage/hybrid models hold or rise
- Pricing-model decision made at Series B determines which side you land on
Final Framework Targets
- SMB-seat target: 100-108%
- Mid-market-seat target: 108-115%
- Enterprise-seat target: 115-122%
- Add 5-15 points for usage-based/hybrid with strong PMF
- Path from 105% to 120%: a 4-6 quarter two-front operating campaign
- Front 1 (contraction): health monitoring + save-desk + downgrade plays + multi-year contracts
- Front 2 (expansion): single-owner accountability + QBRs + health scoring + playbooks + usage triggers + value-metric alignment + price increases
Counter-Case: When NRR Is The Wrong Thing To Optimize
The entire entry above treats NRR as a metric worth understanding deeply and improving deliberately — and for most Series B SaaS companies it is. But a serious operator should stress-test the premise, because there are real situations where focusing on NRR is a mistake, and where the metric actively misleads.
Counter 1 — At early stage, new-logo growth matters far more than NRR. A company that has just raised a Series B is, by definition, still in a phase where the size of the market and the speed of capturing it dominate the equation. If you have $15M ARR in a $5B addressable market, the question that determines your outcome is "how fast can you acquire new customers," not "can you squeeze your existing base from 108% to 114%." Expansion revenue is a multiplier on a base — and when the base is small relative to the opportunity, growing the base is the higher-leverage move.
A founder who pours the company's best energy into NRR optimization while the new-logo engine sputters has optimized the wrong variable. The brutal version: a fast-growing company with 100% NRR will usually beat a slow-growing company with 130% NRR over a five-year horizon, because the first one is compounding a bigger number.
NRR is a durability and efficiency metric; at the stage where land-grab still matters, durability is secondary to speed.
Counter 2 — High NRR can mask a broken new-business engine. This is the most dangerous failure mode in the whole topic. A company can post a beautiful 125% NRR and a board that celebrates it every quarter — while the new-logo acquisition motion is quietly dying. The existing base expands, total ARR keeps rising, the headline looks healthy, and nobody is alarmed.
Then expansion plateaus (every base eventually does — the law of large numbers is undefeated), and suddenly the company discovers it has no working new-business engine and no growth at all. The high NRR was not a sign of health; it was camouflage. A company should be at least as worried about a 130% NRR with declining new-logo bookings as it is about a 100% NRR with strong new-logo bookings.
The metric that looks like strength was hiding the actual weakness.
Counter 3 — Chasing expansion revenue can degrade product focus. When a company orients heavily around NRR, product and engineering get pulled toward whatever the existing base will pay for next — the incremental module, the enterprise-checkbox feature, the cross-sell adjacency.
Each individual decision is rational; the cumulative effect is a product roadmap optimized for monetizing the customers you already have rather than winning the customers you do not. Over a few years this produces a bloated, internally-incoherent product that expands well and competes poorly.
The companies that win markets are usually the ones that kept product focus sharp; the companies with the most impressive cross-sell NRR are sometimes the ones that quietly lost the plot on what made them win in the first place.
Counter 4 — Usage-based NRR volatility actively misleads. For consumption-priced companies, NRR is genuinely noisy — it can swing 15-20 points between quarters on macro conditions, a few whale accounts' behavior, or seasonal usage patterns, with no underlying change in customer health at all.
A usage-based company that reads its quarterly NRR as a health signal will lurch between false panic and false confidence. Worse, the metric is concentration-sensitive: a usage-based company's NRR can be carried entirely by a handful of hyper-growth accounts, masking mediocre retention across the long tail.
Optimizing the headline NRR in that situation means optimizing for whale behavior you do not control, while the broad-base health problem goes unaddressed. For these companies, the cohorted, concentration-adjusted, multi-quarter view is the only honest read — and the single-number NRR is closer to noise than signal.
Counter 5 — NRR can be gamed in ways that look like progress. Everything in the "NRR Treadmill" section is a counter-case in its own right: a team under pressure to improve NRR can discount its way to expansion bookings, can starve the new-logo engine because expansion is cheaper, can pull product toward the existing base.
Every one of those moves improves the metric and damages the business. The moment NRR becomes a target that compensation and board attention are pinned to, Goodhart's Law applies — it stops being a good measure because it has become a target. A company that needs to "fix its NRR" should be at least as suspicious of the easy ways to move the number as it is motivated to move it.
The honest verdict. NRR is one of the most important SaaS health metrics — it is a real proxy for product-market fit, capital efficiency, and durable growth, and the benchmark bands in this entry are the right ones to know. But it is a metric, not a goal. It is the wrong thing to optimize when: you are early enough that new-logo land-grab dominates the outcome; when a high NRR is camouflaging a dying new-business engine; when chasing expansion is degrading the product that wins your market; when your pricing model makes the number too volatile to act on; or when the metric has become a compensation target and the team has found the easy ways to move it.
The disciplined posture is to measure NRR honestly, benchmark it correctly by segment and model, diagnose it precisely when it moves — and manage it as one input among several (alongside new-logo growth, CAC, gross margin, and the Rule of 40), never as the number that the company optimizes in isolation. A founder who can articulate when NRR does not matter understands NRR better than one who treats it as the answer to everything.
Related Pulse Library Entries
- q97 — What's a good CAC payback period for Series B SaaS in 2026? (The other side of capital efficiency; CAC payback and NRR together define growth quality.)
- q98 — What's a healthy gross margin for a Series B SaaS company? (The margin term in the Rule of 40 that NRR feeds.)
- q99 — How do you calculate the Rule of 40 for a SaaS company? (Deep dive on the efficiency benchmark NRR drives.)
- q100 — What metrics do investors look at in a Series C round? (The full diligence metric set NRR sits inside.)
- q88 — How do you build a customer success team for a Series B SaaS company? (The org that owns GRR and feeds NRR.)
- q89 — Who should own expansion revenue: CS, AM, or Sales? (Deep dive on the ownership question raised here.)
- q90 — How do you build a SaaS health scoring model? (The leading-indicator engine for NRR forecasting.)
- q91 — How do you run an effective QBR? (The highest-leverage expansion ritual.)
- q92 — How do you reduce SaaS churn at Series B? (The GRR-side companion to this entry.)
- q93 — Seat-based vs usage-based pricing: which is right for your SaaS? (The pricing-model decision that sets your structural NRR ceiling.)
- q94 — How do you design a usage-based pricing model? (Deep dive on the consumption model's NRR advantage and volatility.)
- q95 — How do you run a SaaS price increase without churning customers? (The underused expansion lever, executed safely.)
- q80 — What's a good logo retention rate for B2B SaaS? (Logo vs dollar retention distinction.)
- q81 — How do you build a cohort analysis for a SaaS company? (The cohort mechanics referenced throughout.)
- q82 — How do you forecast SaaS revenue for a board deck? (NRR forecasting inside the broader revenue forecast.)
- q83 — What should be in a Series B SaaS board deck? (How to present NRR and GRR to a board.)
- q84 — How do you build a save-desk for at-risk renewals? (The contraction-reduction function detailed here.)
- q85 — How do you build an expansion playbook? (The systematized expansion motion investors want to see.)
- q86 — What is the difference between GRR and NRR? (Foundational distinction expanded in this entry.)
- q87 — How do you reconcile Salesforce and your billing system? (The NRR data-integrity problem behind the dashboard.)
- q101 — How do AI features affect SaaS pricing and packaging? (The five-year-outlook driver, in depth.)
- q102 — What is value-metric pricing and how do you choose a value metric? (The deepest NRR lever — pricing-and-packaging alignment.)
- q103 — How do you raise a Series C in 2026? (The round NRR is underwriting toward.)
- q104 — How do SaaS revenue multiples work in 2026? (The valuation mechanics NRR feeds into.)
- q105 — How do you build a RevOps function at Series B? (The team that instruments and reports NRR.)
- q106 — What is the difference between management and GAAP SaaS metrics? (The NRR-variant reporting question.)
- q107 — How do you benchmark a SaaS company against public comps? (Using Snowflake/Datadog/HubSpot disclosures correctly.)
- q108 — How do you handle multi-year contracts in SaaS? (The structural contraction-reduction tool.)
- q109 — How do you build a SaaS metrics dashboard? (The NRR dashboard design in broader context.)
- q110 — What is the SaaS magic number and how does it relate to NRR? (Another efficiency metric in the same family.)