
What's the right CAC payback target — 12, 18, 24 months?
 Curated by Kory White · Fractional CRO, CRO Syndicate
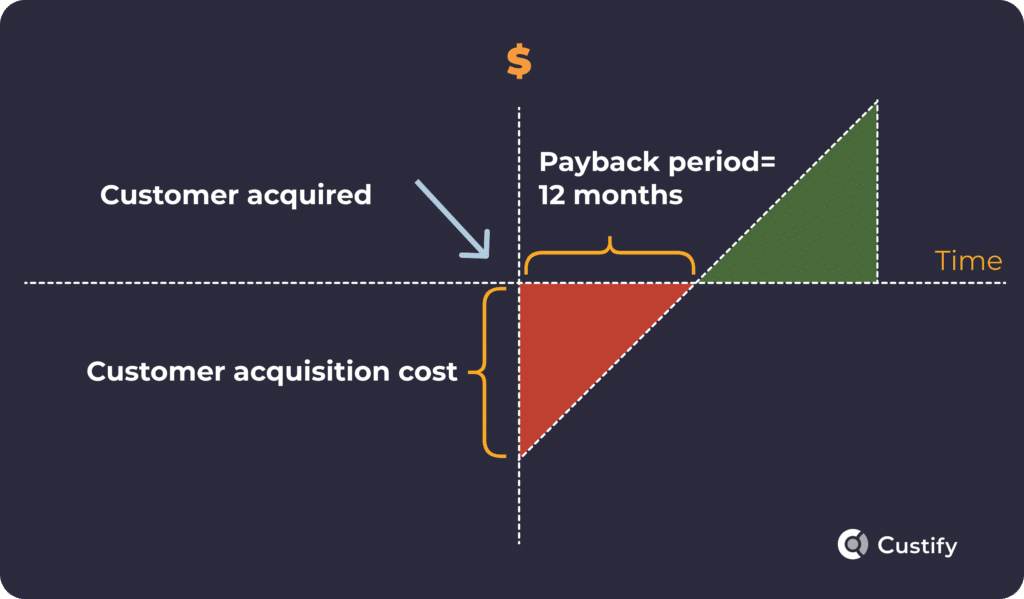
The Question Reframed: There Is No Universal Right Number

The question "what's the right CAC payback target — 12, 18, or 24 months?" is the wrong question, or at least an incomplete one, and the most damaging thing a finance leader can do is answer it with a single number pulled from a blog post. CAC payback is not a constant of nature. It is an output of your business model, and it varies — legitimately and by design — across companies that are all healthy.
A vertical SaaS company selling five-year contracts to hospital systems at 92% gross margin with 96% gross retention can run a 22-month payback and compound beautifully. An SMB project-management tool selling month-to-month at 78% gross margin with 80% gross retention will go bankrupt at the same 22-month payback, because the average customer is gone before the company has recouped the cost of acquiring them.
Same number, opposite verdicts. The number alone tells you almost nothing.
So the reframe is this: the right CAC payback target is the function payback(segment, gross margin, GRR, NRR, growth stage, capital environment) — and your job is to compute the function for your specific business, not memorize a constant. What makes the question answerable at all is that the function is not infinitely variable.
It clusters. Across thousands of SaaS companies, the healthy outcomes bunch around three anchors — roughly 12, 18, and 24 months — and each anchor corresponds to a recognizable profile. Twelve months is the efficiency bar: capital-efficient, fast-compounding, the number that lets growth self-fund and the number disciplined investors increasingly treat as the price of entry.
Eighteen months is the venture-scale default: the number Series B and C investors underwrite for a company that is deliberately spending ahead of efficiency to capture a market. Twenty-four months is the outer edge: defensible only when retention and contract structure are elite, and catastrophic when they are not.
The rest of this entry is the work of locating yourself on that map. We will walk the capital-environment context, the three anchors in depth, the retention and gross-margin adjustments that make the number honest, the segment and channel and stage breakdowns, the cross-checks against Magic Number and Rule of 40, a decision framework that takes your inputs and outputs your specific target, the failure modes of optimizing the metric too hard, and the levers to actually move the number.
The deliverable is not "use 18." The deliverable is a defensible, board-credible target you derived from your own economics — and the judgment to know when payback is not even the metric you should be staring at.
The 2026 Capital-Environment Reality
CAC payback targets are not set in a vacuum — they are set against the cost and availability of capital, and that backdrop has changed more in the last four years than in the prior decade. During the zero-interest-rate period that ran roughly 2013-2021, capital was cheap and abundant, growth was rewarded almost without regard to efficiency, and a 24-to-30-month CAC payback was routinely waved through in board decks and Series B and C diligence.
The implicit logic was that capital to bridge the payback gap was nearly free, so the only thing that mattered was top-line growth rate and market capture. Burn multiples of 2x, 3x, even higher were normalized. "Grow at all costs" was not a slogan; it was the actual underwriting standard.
That era ended hard. Starting in 2022, rate hikes repriced risk across the entire venture and growth-equity stack. Public SaaS multiples compressed from double-digit forward revenue multiples to low-to-mid single digits.
The IPO window effectively closed for sub-scale or inefficient companies. Crossover funds pulled back. And the consequence that matters here is that the efficiency bar moved up the funnel — what private investors demand at Series B and C now mirrors what public markets demand, because the exit they are underwriting is a public market that no longer pays for inefficient growth.
By 2024-2026, the practical standard for most SaaS companies raising money or reporting to a board has tightened from the 2021 24-30 month tolerance to a 12-18 month expectation, with 12 months treated as genuinely strong and anything north of 24 months requiring a specific, retention-backed justification.
There is nuance. The 2025-2026 environment is not uniformly austere — AI-native companies with explosive growth have at times been funded on growth alone again, and the very best enterprise franchises still get latitude. But for the median Series A-through-C SaaS company at $5M-$200M ARR, the operating reality is that payback discipline is now a survival trait, not a virtue.
Capital to bridge a long payback is expensive and conditional. The companies that sailed through 2021 on a 28-month payback and a great growth rate are, in many cases, the same companies that did painful 2023-2024 layoffs when the bridge financing did not materialize on the old terms.
The lesson the market taught — and the lesson that should inform your target — is that a payback target you set in a cheap-capital environment is a liability in an expensive one. Set the target for the capital environment you will actually be raising and operating in, which in 2026 is a disciplined one.
The Three Anchor Targets Explained
The three anchors are not arbitrary marketing-blog numbers; each one corresponds to a coherent financial profile and a recognizable investor posture. Understanding what each anchor *means* is what lets you choose between them rather than defaulting.
12 months — the efficient / PE-grade anchor. A 12-month payback means that one year after acquiring a customer, you have recouped the entire fully-loaded cost of acquiring them, and every dollar of gross-margin revenue after that is funding growth or flowing to the bottom line.
At this level, growth is substantially self-funding: the cash a cohort throws off in year two can finance the acquisition of the next cohort. This is the number private equity and growth-equity firms gravitate toward because it implies the business can scale without an unbounded external capital requirement.
It is also the number that holds up in a tight capital market because it minimizes the bridge financing the business depends on. For companies at Series C and beyond, or any company that wants to control its own destiny, 12 months is the target to build toward.
18 months — the healthy venture-scale default. An 18-month payback says you are deliberately investing ahead of pure efficiency to capture a market faster than self-funding would allow, but you are doing it within a range that Series B and C investors will underwrite without flinching.
It is the most common healthy target for mid-market SaaS in growth mode. At 18 months, you are still recouping CAC well inside the typical customer lifetime, NRR is doing meaningful work to shorten the *effective* payback, and the incremental capital you raise is buying real, durable ARR rather than papering over a leaky bucket.
Eighteen months is not a compromise — it is a deliberate, defensible choice for a company whose thesis is land-and-expand market capture.
24 months — the outer edge. A 24-month payback is the boundary of defensibility. It can be entirely healthy — but only when a specific set of conditions hold: enterprise-grade ACVs, 95%+ gross revenue retention, multi-year contracts (ideally prepaid), and NRR comfortably above 120%.
Under those conditions the customer lifetime is long enough and the expansion strong enough that recouping CAC in two years still leaves years of high-margin, expanding revenue. Outside those conditions, 24 months is where businesses quietly die. The discipline the anchor demands is honesty: if you are running a 24-month payback, you must be able to point to the retention and contract structure that justifies it.
If you cannot, 24 months is not your target — it is your problem.
Why 12 Months Is The PE / Growth-Equity Bar
To understand why private equity and growth-equity investors anchor on a 12-month payback, you have to think about the math of capital efficiency over a multi-year hold. PE underwriting is fundamentally about return on invested capital and the ability to compound without an open-ended cash requirement.
A 12-month payback is the threshold at which a SaaS business stops being a capital sink and starts being a capital engine.
Walk the mechanics. Suppose a cohort of customers costs $1M in fully-loaded CAC to acquire and generates $1M in gross-margin-adjusted revenue over the following 12 months — a 12-month payback. By the end of year one, the original $1M is fully recovered.
In year two, if even 90-95% of that cohort is retained (and at PE-grade businesses GRR is higher), the cohort throws off something close to another $1M of gross-margin revenue, and with any NRR above 100% it throws off *more*. That year-two cash can fund the acquisition of the next cohort outright.
The business can roughly double its acquisition spend each year off its own cash generation, with external capital used to *accelerate* rather than to *survive*. That is the self-funding flywheel, and it is why a sponsor can buy the company, grow it meaningfully, and not need to keep injecting equity.
Now contrast a 24-month payback. The same $1M cohort takes two full years to repay. During year one and most of year two, that cohort is a net cash drain.
To grow at all, the company must raise external capital to bridge every cohort's payback gap — and the faster it grows, the bigger the cash hole, because each new cohort opens a fresh two-year gap before it closes. Growth and cash burn move together. For a PE sponsor, that is an unfinanceable profile unless retention is so strong it changes the calculus, because the equity check required to fund growth never stops.
There is a compounding subtlety that makes short payback even more valuable than the linear math suggests: cash recovered early is cash that can be redeployed early. A 12-month payback lets you recycle acquisition capital twice as fast as a 24-month payback, and over a five-year hold that recycling velocity compounds into a dramatically larger ending ARR for the same cumulative capital invested.
This is why growth-equity term sheets in 2026 increasingly treat sub-12-to-15-month payback as a gating criterion, not a nice-to-have. It is not that 12 months is morally superior — it is that 12 months is the number at which the business model can fund its own ambition.
Why 18 Months Is The Venture-Scale Default
If 12 months is the efficiency bar, 18 months is the number that venture-scale SaaS companies should actually plan around for most of their growth life — and understanding why requires separating "most efficient" from "most valuable." Venture-backed companies are not optimizing for capital efficiency in isolation; they are optimizing for terminal market position.
In a winner-take-most or winner-take-a-lot software category, the company that captures the market gets a durable pricing and retention advantage that the runner-up never recovers. That prize justifies spending ahead of pure efficiency — but only within a band, and 18 months is the practical edge of that band for Series B and C companies.
Here is the underwriting logic a Series B or C investor applies. They want to see that the incremental dollar of sales and marketing spend is buying durable ARR, not renting temporary revenue. An 18-month payback, *paired with* solid gross retention (say 88-92%+) and NRR above 105-110%, demonstrates exactly that: the customer sticks around well beyond the payback window, and the account base expands.
Under those conditions, the investor's capital is funding genuine enterprise value creation. They will underwrite an 18-month payback all day, because the LTV-to-CAC ratio it implies — typically in the healthy 3x-5x range when retention is solid — clears their return threshold with room to spare.
What 18 months also does is give the go-to-market organization room to do its job properly. A company forced to a strict 12-month payback at Series B often has to under-invest in the motions that have a longer payback but a higher ceiling — outbound enterprise sales, brand, partnerships, category creation.
Eighteen months gives the team the latitude to build a multi-channel engine and a real enterprise motion while still staying inside a defensible efficiency range. It is the target that says "we are growing deliberately and we can prove the spend is productive," which is exactly the story Series B and C is supposed to tell.
The caution: 18 months is a *default*, not a license. It is the right plan-around number for a mid-market SaaS company in active growth mode with decent retention. It is not the right number if your retention is weak (push toward 12), and it is not the right ceiling if your retention is elite and your contracts are long (you have earned room toward 24).
Eighteen months is where you start the conversation, not where you end it.
When 24 Months Is Actually Fine
A 24-month CAC payback is not automatically a red flag — in a specific and recognizable class of businesses it is completely healthy, and finance leaders who reflexively condemn any payback over 18 months will give bad advice to enterprise SaaS companies. The question is never the number in isolation; it is whether the customer economics underneath the number support it.
For enterprise SaaS, they often do.
Consider the profile where 24 months works. The company sells to large enterprises with annual contract values in the high five figures to six figures and up. Contracts are multi-year — two or three years is typical, and a meaningful share are prepaid annually or for the full term.
Gross revenue retention is 92-96%+, because enterprise buyers go through long procurement cycles, embed the product deeply into workflows, and do not casually churn. Net revenue retention is 115-130%+, driven by seat expansion, module upsell, and usage growth inside large accounts.
Gross margins are healthy, 78-85%+. In that world, the average customer relationship lasts not two years but six, eight, ten years, and the revenue from that relationship grows materially every year. Recouping fully-loaded CAC in 24 months still leaves the overwhelming majority of a long, expanding, high-margin lifetime as pure value creation.
The LTV-to-CAC ratio is excellent even though the payback period looks long.
There is also a cash-timing nuance that makes enterprise 24-month paybacks less scary than they appear: multi-year and annual-prepaid contracts collapse the cash payback even when the revenue-recognized payback looks long. If an enterprise customer pays $300K up front for a three-year deal and CAC was $200K, the company is cash-positive on that customer on day one, even though on a monthly-revenue-recognition basis the "payback" reads as roughly 24 months.
We will treat this honestly in the multi-year contract section below, but the headline is that for enterprise businesses the revenue-recognized payback systematically overstates the real cash risk.
The discipline 24 months demands is that you must *earn* it with evidence. If you are going to run and defend a 24-month target, you need to be able to put the retention curve, the contract-length distribution, the NRR cohort analysis, and the gross-margin math on the table and show that the long payback is more than recovered by the long, expanding lifetime.
Enterprise SaaS companies that can do that should not apologize for a 24-month payback. The danger is the company that runs a 24-month payback *without* the enterprise economics — which is the subject of the next section.
When 24 Months Is A Death Sentence
The same 24-month payback that is healthy for an enterprise franchise is fatal for an SMB SaaS company, and the reason is brutally simple arithmetic: in SMB, the customer is frequently gone before you have recouped the cost of acquiring them. When that happens, the business is structurally unprofitable on a per-customer basis no matter how fast it grows — in fact, the faster it grows, the faster it dies, because every new cohort deepens the hole.
Walk the math. A typical SMB SaaS company sells month-to-month or on annual contracts to small businesses, with gross revenue retention somewhere in the 75-82% range — small businesses fail, switch tools, cut costs, and churn at rates enterprise buyers never approach. An 80% annual GRR implies an average customer lifetime on the order of five years *in aggregate*, but the cohort decays steeply and unevenly: a large fraction of any cohort is gone within the first 12-18 months.
Now layer a 24-month payback on top. You are spending two years to recoup CAC from a customer base where a substantial share of the cohort has already churned before month 24 ever arrives. The cohort, in cash terms, never repays.
You acquired revenue that left before it paid you back.
The viability condition is that payback must be comfortably shorter than the period over which the cohort actually pays. For SMB SaaS with 78-82% GRR, that means payback realistically needs to be in the 6-12 month range — recoup the customer fast, while they are still here. A 24-month target in that context is not aggressive; it is a slow-motion bankruptcy that a healthy growth rate will mask for a year or two before the cohort math becomes undeniable in the cash flow statement.
This is the single most common way a "growing" SMB SaaS company turns out to have been destroying value the whole time: the blended numbers and the new-logo growth looked fine, but the unit economics never closed because payback exceeded the real, churn-adjusted customer lifetime.
The takeaway is that the *same number means opposite things* depending on the retention underneath it, and this is the single most important idea in the entire CAC-payback discussion. You cannot evaluate a payback target without simultaneously evaluating the GRR it is paired with.
A 24-month payback at 96% GRR is a fine enterprise business. A 24-month payback at 80% GRR is a company that will run out of money. Anyone who quotes you a payback target without asking about your retention is giving you advice that is, at best, a coin flip.
The Retention-Adjusted Payback Concept
Everything in the previous two sections points to one principle that deserves its own treatment: CAC payback is meaningless as a standalone number — it is only interpretable as a pair with gross revenue retention. A "true" payback target is not a number; it is a number-with-a-retention-context, and finance leaders who report payback without reporting GRR alongside it are reporting a metric that cannot be evaluated.
The intuition is that payback measures *how long until you recoup CAC*, and GRR measures *how long the customer stays to pay you*. The metric only makes sense when you compare those two horizons. If payback is 14 months and the cohort half-life is six years, you are wonderful.
If payback is 14 months and a third of the cohort is gone by month 12, you are in trouble. The payback number did not change between those two cases — the retention did, and the retention is what determined whether the number was good.
A practical way to operationalize this is the retention-adjusted or "true" payback view. Crude CAC payback divides CAC by gross-margin-adjusted new MRR and stops there, implicitly assuming the MRR persists. A retention-adjusted view discounts future months by the probability the customer is still there to pay — it asks "how many months of *expected, survival-weighted* gross-margin revenue does it take to recoup CAC?" At high GRR the adjusted number is barely different from the crude number.
At low GRR the adjusted number can be 1.3x-2x the crude number, or in severe cases the cohort never recoups at all and the adjusted payback is effectively infinite. That gap between crude and adjusted payback *is* the churn problem, made visible.
The board-reporting implication is concrete: never present a payback figure without GRR next to it, and ideally without NRR as well. A board that sees "CAC payback: 16 months" learns almost nothing. A board that sees "CAC payback: 16 months | GRR: 91% | NRR: 118%" can actually evaluate the business — they can see that the recoupment window sits comfortably inside a durable, expanding customer relationship.
The pairing is not optional context; it is the metric. Internally, set your target as a pair: "16-month gross payback, but only because we hold 91%+ GRR — if GRR slips below 88%, the payback target must come down to compensate." That conditional framing is what turns payback from a vanity number into a real operating constraint.
The Gross-Margin Adjustment
One of the most common ways teams quietly fool themselves on CAC payback is computing it against raw revenue instead of gross-margin-adjusted revenue, and the error is large enough to flip a business from "healthy" to "underwater" on paper without anyone noticing. The correct denominator in a CAC payback calculation is not new ARR or new MRR — it is new MRR multiplied by gross margin. The reason is that the only revenue available to recoup customer acquisition cost is the revenue that survives the cost of actually delivering the service.
The hosting, the support, the customer success headcount, the third-party data and API costs, the payment processing — all of that is consumed before a single dollar is available to pay back CAC.
The size of the distortion depends on your gross margin, and it is not small. Consider a company with $10K of fully-loaded CAC per customer and $1K of new MRR per customer. Computed against raw MRR, payback looks like 10 months — comfortably inside any reasonable target.
Now apply a 75% gross margin: the gross-margin-adjusted MRR is $750, and the true payback is 13.3 months. Apply a 65% gross margin — common for SaaS with heavy infrastructure or services components — and the true payback is 15.4 months. The "10-month" business was actually a 15-month business the whole time.
A team that reported the raw number to its board, and set targets against it, was operating with a 50% error baked into its most important efficiency metric.
This matters most for the businesses that can least afford the error. Companies with services-heavy revenue, usage-based infrastructure costs, AI products with significant inference or model costs, or thin-margin segments are exactly the ones where the gross-margin adjustment is largest — and exactly the ones where an unadjusted payback number creates the most dangerous false comfort.
An AI-native SaaS company running 55-60% gross margins because of model costs has a fundamentally different payback reality than a classic 80-85%-margin SaaS company, and comparing their raw paybacks is meaningless.
The discipline is simple to state and easy to skip: always compute payback on gross-margin-adjusted revenue, use a consistent and defensible gross-margin definition, and make sure the gross-margin number you use is the real one — fully burdened with COGS including customer success if you treat CS as a delivery cost, not a stripped-down "platform margin" that flatters the result.
When you benchmark your payback against peers or against the 12/18/24 anchors, confirm everyone is using the gross-margin-adjusted version. A team that skips this adjustment is not measuring CAC payback at all; it is measuring a more optimistic cousin of it and calling it by the wrong name.
Fully-Loaded CAC — What Must Be Included
The numerator of the CAC payback calculation is customer acquisition cost, and the second-most-common way teams fool themselves — after skipping the gross-margin adjustment — is computing CAC on a stripped-down basis that excludes real costs of acquiring customers. A payback target is only as honest as the CAC number underneath it, and CAC must be fully loaded: it must capture the total cost of the go-to-market machine that produced the new customers in the period.
What "fully loaded" means in practice, line by line. Sales compensation — base salaries of account executives, SDRs, and any closing or sales-assist roles. Sales commissions and variable comp — including accelerators and SPIFs, recognized appropriately to the period.
Marketing program spend — paid acquisition, events, content production, webinars, ABM programs, the whole demand-generation budget. Marketing team salaries — demand gen, product marketing, content, marketing ops. SDR and BDR fully-loaded cost — these are acquisition costs even though they sit "before" the AE; excluding them is a classic understatement.
Sales and marketing tools — CRM, sales engagement, intent data, marketing automation, attribution, call recording, the entire martech and salestech stack. Sales leadership and management — the VP of Sales, the CMO, sales managers, RevOps headcount that supports acquisition.
Allocated overhead — a reasonable allocation of facilities, IT, recruiting, and other shared costs attributable to the GTM org. Sometimes onboarding/implementation cost — if you treat the initial onboarding as part of landing the customer rather than serving them, a portion belongs here; be consistent about which side of the line you put it on.
The reason discipline matters here is that every excluded cost makes payback look shorter than it is, and the exclusions compound. A team that counts only marketing program spend and AE commissions — a depressingly common "CAC" definition — might report a 9-month payback on a business whose fully-loaded payback is 17 months.
They will set growth plans, comp plans, and board expectations against a number that is nearly double-counting its own efficiency. When the cash does not materialize the way the model said it would, the gap traces straight back to a CAC definition that was missing half the cost base.
Two practical guardrails. First, reconcile CAC to the P&L: the sum of everything you call CAC should tie, within a reasonable allocation tolerance, to the actual sales and marketing line in your financials over the same period. If your "CAC" implies a sales and marketing spend far below what the income statement shows, you are excluding real costs.
Second, document the definition and freeze it: write down exactly what is in and out, get finance and the GTM leadership to agree, and do not quietly change it between board meetings. A payback target is only meaningful if the CAC it is built on is stable, comprehensive, and reconciled.
Fully-loaded is not conservatism — it is just accuracy.

👉 Quick Call with Kory White, Fractional CRO · See Kory on LinkedIn · CRO Syndicate
Blended vs New-Business vs Segment Payback
Once CAC and gross-margin-adjusted revenue are defined correctly, the next decision is *which* payback you are actually measuring — and this is where blended numbers do real damage. There are at least three meaningfully different payback figures a company can compute, and conflating them is how problems hide.
Blended payback takes total sales and marketing spend over a period and divides it by the total new gross-margin revenue added, across all segments, channels, and motions. It is the easiest to compute and the least useful for decision-making, because it averages together businesses with completely different economics.
A blended payback can look healthy while a self-serve motion with a three-month payback subsidizes an enterprise outbound motion with a 30-month payback that is actually broken — or, worse, while a fine enterprise motion is being dragged down in the average by an SMB segment that is structurally unprofitable.
The blend tells you the company-level average; it tells you nothing about which parts of the machine are working.
New-business payback isolates the cost and revenue of acquiring genuinely new logos, separating it from the cost of expanding or renewing existing customers. This matters because expansion revenue is usually far cheaper to acquire than new-logo revenue — a customer success manager driving an upsell is a fraction of the cost of an AE landing a new account.
If you fold expansion into a blended payback, you make new-logo acquisition look more efficient than it is, because cheap expansion is averaging down expensive acquisition. New-business payback answers the question that actually drives growth investment decisions: "when I spend a dollar to go get a customer I do not have, how long until I get it back?"
Segment payback breaks the calculation down by the dimensions that actually have different economics — SMB vs mid-market vs enterprise, inbound vs outbound vs PLG vs partner, by product line, by geography. This is where the real operating insight lives. Segment payback is what tells you that your mid-market motion is your engine, your enterprise motion is a deliberate long-payback investment that is on track, and your SMB motion is quietly bleeding and needs either a pricing fix, a channel fix, or an exit.
The operating discipline that follows: report all three, set targets at the segment level, and never let the blend be the only number anyone looks at. A single company-wide payback target is a fiction — a healthy company has *different* payback targets for different segments because the segments have different retention, different ACVs, and different cost-to-acquire.
The blend is a useful summary statistic for the board headline, but the segment-level targets are the actual management tool. If your company has one payback target and it is the blended one, you have a dashboard that is structurally incapable of telling you where the problem is.
The Payback Target By Segment
Because payback economics differ by customer size, the target itself should differ by segment — and the pattern is consistent enough across SaaS to state as a working framework. The driver of the pattern is the interaction of three things that all move together as you go up-market: ACV rises, retention rises, and cost-to-acquire rises.
The right payback target balances those against each other.
SMB: 6-12 months. Small-business customers have low ACVs, short sales cycles, and — critically — the weakest retention, with GRR commonly in the 75-85% range. Because the cohort decays fast, you must recoup CAC fast: the viability condition is that payback finishes well before the bulk of the cohort has churned.
A 6-12 month target is not aggressive in SMB; it is mandatory. SMB motions that cannot get payback under 12 months usually have a pricing problem (ACV too low for the cost-to-serve and cost-to-acquire), a channel problem (using a sales motion where a self-serve motion is required), or both.
SMB done right tends to be PLG or low-touch inbound precisely because those are the only channels with a cost structure compatible with a sub-12-month payback.
Mid-Market: 12-18 months. Mid-market customers carry meaningfully higher ACVs, stickier usage, and better retention — GRR often 85-92%. The sales motion is more involved (real AEs, longer cycles, sales engineering on larger deals), so cost-to-acquire is higher, but the stronger retention and larger ACV support a longer recoupment window.
Twelve to 18 months is the healthy band, with the better end of it (12-15) being a genuinely strong mid-market business and the upper end (15-18) being acceptable when NRR is doing real work.
Enterprise: 18-24 months. Enterprise customers have the highest ACVs, the longest and most expensive sales cycles (multi-stakeholder, procurement, security review, sometimes a year-plus), and the best retention — GRR frequently 92-96%+ with NRR well above 115%. The high cost-to-acquire pushes payback out, but the long, expanding, high-retention customer lifetime more than absorbs it.
An 18-24 month target is appropriate, with the understanding from earlier that the upper end of that range must be backed by the retention and contract evidence.
The framework's value is that it makes the blended number interpretable. A company with a 16-month blended payback is doing fine if it is 60% mid-market at 14 months and 40% enterprise at 20 months. The same 16-month blend is alarming if it is 50% SMB at 22 months propped up by 50% enterprise at 10 months — because the SMB half is broken and the enterprise half is suspiciously, probably unsustainably, good.
Set the target per segment, hold each segment to its own bar, and use the segment mix to explain the blend rather than letting the blend hide the segments.
The Payback Target By Channel
Just as payback targets vary by customer segment, they vary by acquisition channel — and the channel dimension is often more actionable than the segment dimension, because channel mix is something a go-to-market leader can deliberately shift quarter to quarter. Each channel has a characteristic cost structure, and that cost structure dictates a characteristic payback range.
PLG / self-serve: under 6 months. Product-led and self-serve acquisition has the lowest cost structure of any channel — no AE comp on the deal, minimal or no human touch, acquisition cost dominated by product, onboarding, and a thin layer of marketing. The payback target should be correspondingly aggressive: under six months, often under three.
If a PLG motion cannot get payback well under six months, the product is not actually doing the selling and the "PLG" label is hiding a sales-assisted motion with PLG-level pricing — an unprofitable combination.
Inbound (marketing-sourced, sales-closed): 9-15 months. Inbound leads come in warm, so cost-to-acquire is moderate — marketing program spend plus a closing AE, but no expensive prospecting. The payback target lands in the 9-15 month range depending on segment and ACV. Inbound is usually the efficiency backbone of a mid-market SaaS company: cheaper than outbound, more scalable than partnerships, and capable of hitting a healthy payback at decent volume.
Outbound (SDR-sourced, sales-closed): 15-24 months. Outbound carries the full cost stack — SDR or BDR prospecting cost, AE closing cost, sales engineering, sales management, and the tooling to support it all — with no warm-lead discount. Outbound payback is structurally the longest, typically 15-24 months.
That is not a flaw; outbound exists to reach customers who will never raise their hand, often the largest and highest-LTV accounts. But it must be managed as a deliberate long-payback investment, justified by the ACV and retention of the accounts it lands, and not allowed to drift past 24 months without scrutiny.
Partner / channel: variable. Partner-sourced acquisition has wildly variable economics. A mature partner ecosystem that delivers pre-qualified deals can have an extremely short payback — you pay a referral fee or margin share instead of a full GTM cost stack. An immature partner program that requires heavy partner enablement, co-marketing, and channel management investment before it produces anything can have a payback that looks terrible for two years and then inflects.
Partner payback has to be evaluated on its own maturity curve, not against a fixed number.
The strategic point: channel mix is a payback lever. A company whose blended payback is drifting up can often pull it down not by cutting spend but by shifting mix — leaning harder into PLG and inbound, tightening the outbound bar, and being honest about which channels are carrying the average.
Reporting payback by channel turns an abstract efficiency metric into a concrete reallocation decision.
How Growth Stage Shifts The Target
The right CAC payback target is not static across a company's life — it tightens as the company matures, and trying to hold a Series A company to a Series C standard, or letting a Series C company operate on Series A laxity, are equal and opposite mistakes. The target should move with the stage.
Seed: don't over-index — just measure. At seed stage the company often does not have enough customers, enough cohort history, or a stable enough motion to compute a meaningful payback number at all. The sample is tiny, the CAC is dominated by founder-led selling that does not scale, and the inputs are too noisy to set a real target against.
The right posture at seed is to *instrument* payback — build the tracking, define CAC and gross margin honestly from the start — but not to manage to a hard number. Optimizing payback prematurely at seed usually means starving the experimentation needed to find the motion that works.
Series A: 18-24 months is acceptable. By Series A the company has a repeatable-ish motion and enough data for the number to mean something, but it is still early in building the GTM engine. Investors and boards will accept a payback in the 18-24 month range here, understanding that the company is still ramping reps, still finding channel-market fit, and still investing in motions that have not matured.
The job at Series A is to show the number is *trending the right way* and that the unit economics close, even if they are not yet tight.
Series B: under 18 months. Series B is where efficiency expectations sharpen. The company is supposed to have proven the motion and now be scaling it; an investor underwriting a B round wants to see payback under 18 months and improving, with the retention and gross-margin discipline in place.
Series B is the stage where the 18-month default genuinely becomes the operating target for most companies.
Series C and beyond / PE: under 12-15 months. By Series C, and certainly for any company a PE or growth-equity firm is underwriting, payback should be in the 12-15 month range or better. At this stage the company is expected to be substantially self-funding its growth, the motion should be mature and efficient, and the capital being raised should be accelerant, not life support.
A Series C company still running a 24-month payback has a story problem it must answer directly.
The throughline: payback discipline is a maturity gradient, not a switch. Each stage should show a tighter number than the last, and the trajectory matters as much as the level. A board evaluating a company does not just want to know the payback is 16 months — it wants to know it was 22 a year ago and is heading toward 13.
A flat or worsening payback across stages is a signal that the GTM engine is not actually getting more efficient as it scales, which is the thing the entire venture model is betting on.
The Magic Number Cross-Check
CAC payback is not the only lens on go-to-market efficiency, and one of the most useful disciplines is to cross-check it against the SaaS Magic Number, because the two metrics are, fundamentally, two views of the same underlying reality — and when they disagree, the disagreement is informative.
The Magic Number is typically computed as the net new ARR added in a period divided by the sales and marketing spend in the prior period (the lag reflects that this quarter's spend produces next quarter's revenue). A Magic Number around 0.75 or above is generally considered efficient; above 1.0 is strong; below 0.5 suggests the GTM engine is struggling to convert spend into growth.
It is, in essence, a measure of how much ARR each dollar of S&M buys.
CAC payback measures the same efficiency from the inverse direction: instead of "how much ARR per dollar of spend," it asks "how many months of gross-margin revenue to recoup the spend." The two are mathematically linked — a high Magic Number and a short payback are two descriptions of the same efficient engine; a low Magic Number and a long payback describe the same inefficient one.
Roughly speaking, if you know the Magic Number and the gross margin, you can back into an implied payback, and vice versa. They are not independent metrics; they are the same metric in different units.
So why compute both? Because the cross-check catches errors and reveals composition problems. If your CAC payback looks great but your Magic Number looks weak, something is inconsistent — perhaps your CAC definition is too narrow (making payback look short) while your Magic Number, computed off total S&M from the P&L, is telling the truth.
The discrepancy is a flag to go reconcile the inputs. Conversely, the Magic Number captures *all* net new ARR including expansion, while a well-constructed new-business payback isolates new logos — so a strong Magic Number alongside a weak new-business payback tells you expansion is carrying the company and new-logo acquisition is the actual problem.
That is a genuinely useful diagnostic.
The practical recommendation: report both, expect them to tell a consistent story, and treat any divergence as a signal to investigate rather than a number to explain away. The Magic Number is the quick, P&L-anchored sanity check; CAC payback is the more granular, cohort-anchored operating metric.
Used together, they are far harder to fool than either one alone — which is exactly why disciplined boards ask for both.
The Rule of 40 Interaction
The Rule of 40 — the principle that a healthy SaaS company's revenue growth rate plus its profit margin should sum to at least 40 — is the single most important context for interpreting whether a given CAC payback is acceptable, because it captures the fundamental trade-off that a payback number in isolation hides: efficiency and growth are substitutes, within limits, and a longer payback can be entirely fine if it is buying enough growth.
Here is the logic. A long CAC payback depresses near-term profitability — you are spending cash now to acquire customers who will not repay you for many months. That spend shows up as burn, which hurts the margin side of the Rule of 40 equation.
But that same spend, if it is productive, is buying growth — which helps the growth side of the equation. The question the Rule of 40 forces is whether the growth you are buying with the long payback is enough to compensate for the efficiency you are giving up. If a company runs a 24-month payback but is growing 60% a year, it can still clear 40 even at a deeply negative margin, and the long payback is arguably a rational choice to capture a market.
If a company runs a 24-month payback and is growing 15% a year, it cannot clear 40, the long payback is not buying enough growth to justify itself, and the company has an efficiency problem it can no longer outrun.
This is why "is a 24-month payback acceptable?" is genuinely unanswerable without the growth rate. The same payback is a smart aggressive bet in a fast-growing land grab and a fatal inefficiency in a slow-growing one. The Rule of 40 is the equation that makes the trade-off explicit: it lets you ask not "is my payback good?" but "is my payback good *given how fast I am growing*?" — which is the question that actually matters.
The trade-off math also runs the other way, and this is where the Rule of 40 protects against over-optimizing. A company can clear 40 by being extremely profitable and barely growing — a 10% grower at a 35% margin clears 40 — but for a venture-backed company that profile is usually a failure of ambition, not a success.
The Rule of 40 says that profile is "allowed," but it does not say it is what your investors are paying for. The right reading is that the Rule of 40 defines a *feasible frontier* of growth-and-efficiency combinations, and CAC payback is one of the main dials that moves you along that frontier.
A longer payback pushes you toward the growth-heavy end; a shorter payback pushes you toward the efficiency-heavy end. Your job is to choose the point on the frontier that fits your stage, your market, and your capital situation — and to make sure that wherever you sit, growth-plus-margin still clears 40.
A long payback that keeps you on the frontier is a strategy. A long payback that drops you below the frontier is a problem.
Setting The Target — A Decision Framework
Everything to this point has been context. Here is the synthesis: a concrete procedure that takes your specific inputs and outputs your specific CAC payback target. The framework has five inputs and produces one number with a defensible rationale attached.
Input 1 — Gross Revenue Retention. This is the master input, because it sets the ceiling on how long a payback you can survive. GRR above 92% earns you room toward the long end (up to 24 months). GRR 85-92% supports a mid-range target (roughly 12-18 months).
GRR below 85% forces a short target (12 months or under); GRR below 80% forces it under 12 and means SMB-style discipline is non-negotiable.
Input 2 — Gross Margin. This scales the calculation and reality-checks it. High gross margin (80%+) means the gross-margin-adjusted payback is close to the headline number and you have full latitude. Lower gross margin (60-70%, common for AI-native or services-heavy SaaS) means the true payback is materially longer than the raw number, so you must target a *shorter* raw payback to land at a healthy real one — and be honest that your structural payback ceiling is lower than a high-margin peer's.
Input 3 — Net Revenue Retention. NRR shortens the *effective* payback. NRR above 120% means expansion is materially funding your recoupment and you can tolerate a longer gross payback. NRR around 100% means new-logo economics have to stand entirely on their own.
NRR below 100% means expansion is not helping and gross churn is actively working against you — tighten the target.
Input 4 — Growth Rate. Via the Rule of 40, a high growth rate (50%+) buys tolerance for a longer payback because the payback is demonstrably purchasing growth. A modest growth rate (sub-25%) removes that tolerance — a long payback that is not buying fast growth is just inefficiency, and the target must come down.
Input 5 — Capital Runway and Environment. Short runway, or a near-term raise into a disciplined market, forces a shorter target — you cannot afford a payback that depends on bridge capital you may not get on good terms. Long runway or a strong balance sheet gives you room to run a deliberately longer payback for market capture.
The synthesis. Start from the segment/channel baseline (SMB 6-12, mid-market 12-18, enterprise 18-24; PLG sub-6, inbound 9-15, outbound 15-24). Then adjust: strong GRR, high NRR, fast growth, and long runway all push the target *longer* within and toward the top of the range; weak GRR, low margin, NRR at or below 100%, slow growth, and short runway all push it *shorter*.
The output is not just a number — it is a number plus the sentence that justifies it: *"Our target is a 15-month fully-loaded, gross-margin-adjusted new-business CAC payback, because we hold 90% GRR, 80% gross margin, 116% NRR, and are growing 45% — and that target drops to 12 months if GRR falls below 87%."* That sentence is the deliverable.
A target without that rationale is a guess; a target with it is a management decision you can defend to any board.
The Danger Of Optimizing Payback Too Hard
Having spent the entire entry building the case for payback discipline, it is essential to spend a section on the opposite failure, because it is real, common, and in some ways more dangerous: optimizing CAC payback too hard can permanently cap a company's ceiling. Payback is a constraint, not a goal, and a company that treats it as the goal will systematically make decisions that look smart on the efficiency dashboard and are catastrophic for terminal value.
The mechanism is straightforward. The fastest way to improve CAC payback is to stop doing the things that have a long payback — which means cutting outbound, cutting brand and category investment, cutting partnerships, cutting the enterprise motion, and leaning entirely on the cheapest, fastest-payback channels.
Do that and your payback number will improve next quarter. It will look like a win. But the long-payback motions you cut were the ones reaching the largest accounts, building the durable brand moat, and capturing the parts of the TAM that competitors will now take instead.
You have traded the company's long-term ceiling for a better short-term efficiency optic. The dashboard says you are healthier; the trajectory says you just shrank your future.
This shows up in specific, recognizable pathologies. Starving outbound: the company stops prospecting the enterprise accounts that take 18-24 months to pay back, and two years later discovers a competitor has locked up the upmarket segment. Killing category creation: brand and thought-leadership spend has the longest and least-attributable payback of anything, so it is the first thing an efficiency-obsessed CFO cuts — and the company slowly loses the inbound advantage that brand was quietly generating.
Under-pricing the long game: the company refuses to invest in a new product line, a new geography, or a new segment because the initial payback looks ugly, even though every one of those investments looks ugly at the start and good at scale. Short-termism in comp design: sales comp gets re-rigged to reward only the fast, easy, short-payback deals, and reps rationally stop chasing the big, slow, valuable ones.
The discipline is to hold both ideas at once: payback must be defensible, and payback must not be the optimization target. The right framing is that payback is a *guardrail* — a range you stay inside to ensure the business is financeable and the unit economics close — while growth, market capture, and terminal value are what you actually optimize *within* that guardrail.
A company that says "we will not let blended payback exceed 18 months, and within that constraint we will invest as aggressively as possible in capturing the market" has the relationship right. A company that says "we will drive payback as low as it will go" has confused the seatbelt for the steering wheel, and it will arrive, very efficiently, at a smaller destination than it could have reached.
Multi-Year Contract Effects
Multi-year and prepaid contracts change the CAC payback picture dramatically, and a finance team that does not account for them honestly will either overstate or understate its real position depending on which payback definition it is using. The core fact is that there is a difference between revenue-recognized payback and cash payback, and multi-year prepaid deals make that difference enormous.
Consider the mechanics. An enterprise customer signs a three-year contract for $300K total and pays the full amount, or the first year of $100K, up front. CAC to land the deal was $180K.
On a revenue-recognition basis, the customer generates roughly $100K of ARR per year, so a CAC-payback-on-ARR calculation might read as something like 18-22 months once you gross-margin-adjust it. But on a cash basis, the company collected $100K-$300K on day one against $180K of CAC — it is either immediately cash-positive on the customer or very close to it.
The "payback period" on a revenue-recognized basis tells a story of an 18-month wait; the cash reality is that the customer funded most or all of their own acquisition cost before the company had to wait for anything.
This is why enterprise businesses with strong prepaid multi-year mixes can run revenue-recognized paybacks that look long and still be in excellent cash health — and why it is a genuine analytical error to evaluate such a business purely on the recognized-revenue payback number. It is also why, for these businesses, the cash conversion cycle and the prepaid mix percentage belong on the dashboard right next to the payback figure.
The honesty requirement cuts both ways, though, and this is the part teams get wrong. The cash-timing benefit of a prepaid deal is real, but it does not change the fundamental economics of whether the customer is profitable — that still depends on retention and total lifetime value relative to total CAC.
A company should not use the favorable cash optics of prepaid contracts to wave away a genuinely long economic payback. If the customer churns at the end of year one despite having prepaid, you collected their cash but you did not build a durable asset. The right way to handle multi-year effects is to report *both* views: the revenue-recognized, gross-margin-adjusted payback (which tells you about the economic durability of the customer relationship) *and* the cash payback or cash conversion timing (which tells you about the financing burden of growth).
Use the cash view to understand your capital needs; use the recognized view to understand your unit economics. Conflating them — in either direction — produces a distorted picture. The disciplined move is to be explicit about which payback you are quoting and why, every single time.
Expansion-Adjusted / Net Payback
The standard CAC payback calculation considers only the revenue from the initial sale — the new MRR at the moment of landing the customer — and holds it flat. But in a healthy SaaS business with NRR above 100%, that assumption systematically understates how fast the customer actually repays, because the customer's spend *grows* over the payback window.
Accounting for that growth produces the expansion-adjusted, or "net," CAC payback — and for expansion-heavy businesses it can be dramatically shorter than the headline number.
The mechanism: in a business with strong net revenue retention, a customer who starts at $1,000 of MRR is, on average, paying meaningfully more than $1,000 of MRR six and twelve months later, through seat expansion, usage growth, module upsell, and tier upgrades. The standard payback calculation ignores all of that and pretends the customer pays $1,000/month forever.
The net payback calculation instead asks: "given that this cohort's revenue is growing at the NRR rate, how many months until cumulative gross-margin revenue covers CAC?" For a company with 130% NRR, the cohort's monthly revenue is materially higher by month 12 than at month zero, so the cumulative revenue crosses the CAC line sooner — sometimes 20-35% sooner than the unadjusted calculation suggests.
This is not a trick to flatter the numbers — it is a more accurate reflection of reality *for businesses where the expansion is real and reliable.* A company with a long, proven track record of 120%+ NRR is genuinely recouping CAC faster than its standard payback implies, and ignoring that fact understates the quality of the business and can lead to under-investment in acquisition.
For these companies, the net payback view is a legitimate and important lens, and it is increasingly how sophisticated investors evaluate expansion-led businesses.
The discipline, as always, is honesty about which businesses have earned the net view. Net payback is appropriate when expansion is durable, broad-based, and proven across many cohorts — not when it is concentrated in a few accounts, not when it is new and unproven, and not when "NRR above 100%" is masking high gross churn offset by aggressive upsell to the survivors.
A company with 80% GRR and 105% NRR has a fragile expansion story; leaning on net payback there would hide the gross-churn problem rather than illuminate it. The recommended practice is to report the standard gross-margin-adjusted payback as the primary, conservative metric, and to report the expansion-adjusted net payback as a secondary metric *for businesses with the retention track record to justify it* — clearly labeled, so no one confuses the optimistic view for the conservative one.
Net payback is a real and valuable view; it is just not the default, and it must never be used to paper over weak gross retention.
Five Real Public-Company References
The 12/18/24 anchors are not theoretical — they are visible, with some triangulation, in the disclosed economics of public SaaS companies across the segment spectrum. Public companies do not all disclose CAC payback directly, but enough disclose the components — sales and marketing spend, net new ARR, gross margin, retention — that the payback profile can be reasonably inferred.
Five reference points across the range:
HubSpot — a mid-market-leaning platform with a strong blended motion spanning self-serve, inbound, and a growing upmarket sales effort. HubSpot's disclosed metrics over recent years — healthy gross margins in the low-to-mid 80s, solid retention, and a marketing-efficient inbound-heavy acquisition model — are consistent with a CAC payback that sits in the efficient mid-market band, roughly the 12-18 month zone.
HubSpot is a useful reference for what a well-run multi-channel mid-market business looks like: efficient enough to be self-sustaining, with the inbound engine doing a lot of the work.
Salesforce — the archetypal enterprise SaaS franchise. Salesforce runs a heavy, expensive enterprise sales motion with long cycles, but pairs it with very strong gross retention, high NRR driven by its multi-cloud expansion machine, and large multi-year contracts. Its acquisition cost is high in absolute terms, which pushes the payback toward the long end — the enterprise 18-24 month zone — but the durability and expansion of its customer base is exactly the profile that *justifies* a long payback.
Salesforce is the reference case for "24 months is fine if you are this kind of company."
Monday.com — a product-led-leaning company that built an efficient self-serve and low-touch acquisition engine before layering on a sales-assisted upmarket motion. Monday's disclosed efficiency metrics — strong growth alongside improving margins and a notably efficient go-to-market — point to a payback on the shorter end of the spectrum, reflecting the PLG-influenced cost structure.
It is a reference for how a PLG foundation pulls the blended payback down even as a company moves upmarket.
Klaviyo — a marketing-automation platform serving a large base of e-commerce businesses, with a mix that includes a meaningful SMB and mid-market component. Klaviyo's economics reflect the discipline required when serving smaller customers: efficient acquisition and strong product-driven retention are what make the model work, and its payback profile reflects the need to recoup smaller customers relatively quickly.
It is a reference for the SMB/mid-market efficiency requirement.
Bill.com — serving small and mid-sized businesses with a financial-operations platform, Bill.com's model depends on efficient acquisition and the stickiness that comes from being embedded in a customer's payments and AP workflows. Its profile illustrates how a company serving smaller businesses must keep payback tight and lean on product stickiness to compensate for the inherently weaker retention of the SMB segment.
The pattern across all five: payback tracks segment exactly as the framework predicts — shorter for PLG and SMB-exposed models, longer for enterprise franchises — and in every case the payback length is matched to the retention and contract structure underneath it. The public companies that endure are the ones where that match holds.
The Payback Dashboard And Cadence
A CAC payback target only changes behavior if it is instrumented, reported, and reviewed on a disciplined cadence — a target that lives in a board deck once a quarter and nowhere else is decoration. The operating practice is a payback dashboard with defined fields, a defined review rhythm, and a finance reconciliation that keeps the inputs honest.
The fields the dashboard must carry. Fully-loaded CAC (with the definition documented and frozen). New gross-margin-adjusted MRR/ARR, separated into new-business and expansion. The gross-margin-adjusted, fully-loaded payback as the headline number — reported blended *and* by segment *and* by channel.
GRR and NRR, sitting immediately adjacent to payback so the pairing is never lost. The Magic Number as the cross-check. Growth rate and an implied Rule of 40 reading.
The trend line — this period versus prior periods — because trajectory is as important as level. For enterprise-heavy businesses, the prepaid mix and a cash-payback view alongside the recognized-revenue view.
The cadence. Payback is reviewed *monthly* at the operating level — the RevOps and finance teams should be looking at the segment and channel breakdowns every month, because that is the resolution at which problems are catchable and reallocation decisions get made. It is reviewed *quarterly* with the leadership team and the board at the blended-plus-segment level, framed against the target and the trend.
The monthly view is the management tool; the quarterly view is the accountability and narrative tool.
The finance reconciliation. The single thing that keeps a payback dashboard from drifting into fiction is a periodic reconciliation, run by finance, that ties the CAC inputs back to the actual P&L. The sum of everything counted as customer acquisition cost should reconcile, within a documented allocation tolerance, to the sales and marketing line in the financial statements over the same period.
The gross margin used should reconcile to the actual COGS in the financials. The new ARR should reconcile to the bookings and revenue records. This reconciliation is unglamorous and it is the difference between a payback metric a board can trust and one that quietly diverges from reality until a fundraise or an audit exposes the gap.
Run it at least quarterly.
The deeper point is that a payback target without a dashboard and a cadence is an aspiration, not a control. The companies that actually manage to their payback target are the ones where the number is visible monthly, broken down to a level that drives decisions, paired with retention so it is interpretable, cross-checked against the Magic Number so it is honest, and reconciled to the P&L so it is real.
The instrumentation is the discipline.
How To Move Payback From 24mo → 15mo
Setting a target is the easy part; moving the actual number is the work. A company that finds itself at a 24-month payback and needs to get to 15 has a set of concrete levers, and the important thing to understand is that they work on different parts of the equation and on different timelines. There is no single fix — there is a portfolio of moves.
Sales compensation redesign. Comp is one of the fastest-acting levers because it changes rep behavior within a quarter. If commission structures reward booking any deal equally, reps will chase whatever closes easiest, regardless of payback. Re-rigging comp to reward retention-adjusted, full-payment, or higher-ACV deals — and to penalize the heavily discounted, short-term, churn-prone deals — shifts the *mix* of what gets sold toward shorter-payback business.
This also includes rationalizing the cost side: over-built sales management layers, bloated SDR-to-AE ratios, and accelerators that pay out faster than cash comes in all inflate CAC.
Channel mix shift. As covered earlier, channels have structurally different paybacks. Deliberately shifting acquisition mix toward PLG, self-serve, and inbound — and holding outbound to a tighter bar or focusing it only on the accounts whose ACV justifies the long payback — pulls the blended number down.
This is a mix decision a GTM leader can execute over two or three quarters.
Pricing and packaging. The denominator of payback is gross-margin revenue per customer. Raising prices, restructuring packaging to drive higher initial ACV, moving customers onto annual rather than monthly billing, and reducing the prevalence of free or near-free entry tiers all increase the revenue side of the equation directly.
Pricing is one of the highest-leverage payback levers and one of the most underused.
Discount discipline. Uncontrolled discounting silently lengthens payback because it shrinks the gross-margin revenue per customer while leaving CAC unchanged. Instituting discount approval thresholds, tracking realized discount rates by rep and segment, and resetting the discounting culture can recover meaningful payback with no change to the cost structure at all.
Ramp acceleration. A large, hidden component of CAC is the cost of reps who are not yet productive. Cutting time-to-productivity through better onboarding, better enablement, better territory design, and better lead routing means more of the sales payroll is producing revenue rather than ramping — which lowers the effective CAC per closed deal.
Gross-margin improvement. Because payback is computed on gross-margin-adjusted revenue, improving gross margin shortens payback even with no change to CAC or pricing — through infrastructure cost optimization, support efficiency, automation of delivery, and renegotiation of third-party costs.
The realistic expectation: moving from 24 to 15 months is a multi-quarter program, not a single initiative, and it works best as a coordinated portfolio — comp and discount discipline acting fast, channel mix and pricing acting over a few quarters, ramp and gross margin compounding over a year.
Pick the levers that match your specific diagnosis (a discounting problem and a channel-mix problem call for different moves), sequence them, and track the payback trend monthly so you can see which levers are actually moving the number.
Board And Investor Framing
How you *present* CAC payback to a board or to investors is almost as important as the number itself, because the credibility of the number — and of the management team — is established in the framing. A payback figure presented carelessly invites skepticism; the same figure presented with discipline builds trust.
Lead with the definition. Before showing the number, state how it is computed: fully-loaded CAC, gross-margin-adjusted revenue, new-business versus blended, the gross-margin assumption used. This is not pedantry — it preempts the first question any sophisticated investor will ask, and it signals that the team is not playing definitional games.
A team that shows a payback number without defining it is, in an experienced investor's eyes, probably hiding something.
Always present payback paired with retention. Never show payback alone. Show it next to GRR and NRR, every time, so the board can actually interpret it. "16-month payback" is a number; "16-month payback against 91% GRR and 119% NRR" is an evaluable business.
The pairing also demonstrates that management understands *why* the payback is acceptable, which is the real thing the board is assessing.
Show the trend and the segment breakdown. A single point-in-time blended number is the weakest possible presentation. Show the trajectory — where payback was a year ago, where it is now, where it is heading — and break it down by segment so the board can see which parts of the engine are driving the blend.
This turns the slide from a vanity metric into a strategic discussion.
Commit to a target you can actually hit, and frame it conditionally. When the board asks "what's your payback target," the strong answer is not a bare number — it is the conditional version from the decision framework: "Our target is 15 months, given our current 90% GRR and 116% NRR; if retention softens, we'll tighten the target to compensate." That framing demonstrates that the team understands payback as a function of the business, not a wish.
It also protects credibility: a team that commits to a flat number and misses it looks worse than a team that committed to a conditional target and adjusted transparently.
Be honest about the long-payback investments. If part of the spend is a deliberate long-payback bet — building an enterprise motion, entering a new segment — say so explicitly, carve it out, and show the core motion's payback separately. Boards reward deliberate, well-articulated investment; they punish long paybacks that look like accidents.
The difference between "our enterprise motion runs a 22-month payback by design and here's the LTV math that justifies it" and a blended number that is quietly dragged up by an unexplained enterprise drag is entirely a difference of framing — and it is the difference between a board that backs the strategy and a board that loses confidence in the team.
5-Year Outlook
The "right" CAC payback target is not fixed in time — it will shift over the next five years, and the dominant force shifting it is AI-driven CAC compression. The thoughtful finance leader sets today's target with one eye on where the structural economics are heading.
AI is compressing the cost side of CAC. The clearest near-term effect is that AI is making the go-to-market machine cheaper to run. AI SDRs and AI-assisted prospecting are reducing the cost of pipeline generation. AI-assisted marketing — content production, campaign optimization, personalization at scale — is lowering the cost per lead.
AI sales tools are improving rep productivity, compressing ramp time, and automating the administrative load that used to consume selling hours. AI-driven onboarding and self-serve experiences are lowering the human cost of landing and activating customers. Each of these pushes fully-loaded CAC down, and lower CAC means shorter payback at the same revenue per customer.
Mechanically, the AI-equipped go-to-market org of 2030 should be able to hit a given payback target with materially less spend than the 2026 org.
But the bar moves with the capability. The catch is that CAC compression is not a private advantage for long — it diffuses across the whole industry. When everyone's AI-assisted GTM is cheaper, the competitive equilibrium re-prices, and investors and boards will simply expect *shorter* paybacks as the new normal.
What is a strong 14-month payback in 2026 may be an unremarkable, expected number by 2030. The companies that benefit are not the ones that merely adopt AI tooling — that becomes table stakes — but the ones that adopt it faster and more thoroughly than their competitors, capturing the efficiency gain as a temporary edge before the bar resets.
Retention and gross margin become even more decisive. Two countervailing forces deserve attention. First, AI-native products often carry meaningfully lower gross margins because of model and inference costs — which, as covered earlier, lengthens the true payback for a given raw number.
So even as AI compresses CAC, it may compress gross margin, and the net effect on payback depends on which moves more. Second, as CAC compresses industry-wide and acquisition becomes cheaper for everyone, *retention* becomes the harder-won and more differentiating advantage. When everyone can acquire efficiently, the durable businesses are the ones that *keep* customers — which means GRR and NRR will matter even more relative to payback in how investors evaluate companies.
The likely 2030 picture. The probable trajectory is that the anchor targets ratchet down — the "efficient" bar moves from 12 months toward something shorter, the "default" from 18 toward something like 12-15, and a 24-month payback becomes defensible in an even narrower set of enterprise circumstances.
But the *structure* of the analysis — payback read against retention, adjusted for gross margin, segmented by motion, cross-checked against Magic Number and Rule of 40 — does not change. The numbers move; the framework endures. The finance leader who has internalized the framework will simply re-anchor it as the environment shifts, which is exactly the point of having a framework rather than a memorized number.
Final Framework
Pulling the entire entry into a single operating synthesis — the decision tree, the diagnostic checklist, and the improvement roadmap.
The decision tree to set YOUR target. Start at your segment and channel baseline: SMB 6-12 months, mid-market 12-18, enterprise 18-24; PLG sub-6, inbound 9-15, outbound 15-24. Then run the five adjustments. Is GRR above 92%?
Move toward the long end. Below 85%? Move to the short end; below 80%, go under 12 and treat SMB-style discipline as non-negotiable.
Is gross margin below 70%? Tighten the raw target so the true, adjusted payback still lands healthy. Is NRR above 120%?
You have earned some room toward a longer gross payback. At or below 100%? New-logo economics must stand alone — tighten.
Are you growing 50%+? The Rule of 40 buys you tolerance for a longer payback. Growing under 25%?
It does not — tighten. Is runway short or a disciplined-market raise imminent? Tighten.
The output is a number *plus its justifying sentence*, the conditional form: "Our target is X months, because GRR/margin/NRR/growth are Y, and it drops to Z if GRR falls below W."
The diagnostic checklist. Run these questions on your current payback practice. Is CAC fully loaded — comp, commissions, marketing program and salaries, SDR cost, tools, leadership, allocated overhead — and reconciled to the P&L? Is payback computed on gross-margin-adjusted revenue, not raw ARR?
Are you separating new-business, expansion, and blended payback? Are you reporting it by segment and channel, not just blended? Is GRR — and NRR — presented immediately alongside it every time?
Are you cross-checking against the Magic Number? Are you reading it against growth via the Rule of 40? Is there a monthly operating cadence and a quarterly board cadence?
Any "no" is a gap to close before the target means anything.
The improvement roadmap. If the number needs to come down, deploy the levers in sequence by speed: discount discipline and comp redesign act within a quarter; channel-mix shift and pricing/packaging act over two to three quarters; ramp acceleration and gross-margin improvement compound over a year.
Run them as a coordinated portfolio matched to your specific diagnosis, and track the payback trend monthly to see what is working.
The one-sentence verdict. There is no universal right CAC payback target — but for the median $5M-$200M ARR SaaS company in the disciplined capital environment of 2026, the answer clusters hard: 12 months is the efficient, financeable, self-funding bar; 18 months is the healthy venture-scale default; 24 months is the outer edge that only elite retention and contract structure can justify — and the single most important rule is that you can never evaluate any of those numbers without the gross revenue retention sitting right next to it. Set your target as a function of your own economics, instrument it honestly, defend it to your board with the retention pairing attached, and never let the metric become the goal it was only ever meant to guard.
Decision Tree: From Your Inputs To Your Payback Target
The Payback-vs-Retention Viability Matrix
FAQ
What do the 12, 18, and 24-month payback anchors each represent? Twelve months is the efficient, PE/growth-equity-grade bar that lets growth self-fund and is the default for Series C+ in a disciplined market. Eighteen months is the healthy venture-scale default that Series B/C investors underwrite for mid-market SaaS.
Twenty-four months is the outer edge, defensible only with elite retention and enterprise ACVs.
How do you compute CAC payback the disciplined way? Use fully-loaded CAC — sales comp, commissions, marketing, SDR cost, tools, sales leadership, and allocated overhead — divided by gross-margin-adjusted new MRR, not raw ARR. Using raw ARR instead of gross-margin-adjusted MRR overstates how fast you actually recoup the cost.
The point is a board-credible number derived from your own economics.
Why is a 24-month payback a death sentence for SMB SaaS? SMB SaaS typically runs 75-82% gross revenue retention, so the customer churns before you recoup CAC at 24 months. The same 22-month payback that compounds beautifully for a vertical SaaS selling five-year hospital contracts at 96% GRR will bankrupt a month-to-month SMB tool.
Same number, opposite verdicts.
What changed about acceptable payback after the ZIRP era? During roughly 2013-2021, capital was cheap and a 24-to-30-month payback was routinely waved through in board decks and Series B/C diligence. After 2022 rate hikes repriced risk, public SaaS multiples compressed and the efficiency bar moved up the funnel.
Payback now has to land at 12-18 months for most companies to clear an investor or board bar.
What are the segment and channel payback targets? By segment: SMB 6-12 months, Mid-Market 12-18 months, Enterprise 18-24 months. By channel: PLG/self-serve under 6 months, inbound 9-15 months, outbound 15-24 months. Cross-check whichever target you set against the Magic Number and the Rule of 40, since a longer payback is only tolerable if growth is high enough to clear 40.
Sources
- Bessemer Venture Partners — State of the Cloud and the 5 C's of Cloud Finance — CAC payback period definitions, the 12-18 month healthy benchmark, and the post-2022 efficiency reset framework. Https://www.bvp.com/atlas
- Bessemer Venture Partners — Scaling to $100 Million — Benchmark efficiency metrics for SaaS companies across growth stages, including CAC payback by stage.
- OpenView Partners — SaaS Benchmarks Report — Annual benchmark data on CAC payback, net revenue retention, and gross retention segmented by ACV and go-to-market motion.
- KeyBanc Capital Markets (formerly Pacific Crest) SaaS Survey — Long-running annual survey of private SaaS company metrics including CAC payback and CAC by channel.
- ICONIQ Growth — Topline Growth and Operational Efficiency Reports — Growth-stage SaaS benchmark data on CAC payback, Magic Number, and burn multiple.
- David Skok — For Entrepreneurs: SaaS Metrics 2.0 — Foundational framework for CAC, LTV, CAC payback period, and the months-to-recover-CAC concept. Https://www.forentrepreneurs.com/saas-metrics-2/
- Brad Feld and Foundry — The Rule of 40 for SaaS — Origin and application of the Rule of 40 growth-plus-profit framework.
- Bain & Company — Rule of 40 analysis for software companies — Analysis of the growth-efficiency trade-off frontier and how CAC payback moves a company along it.
- a16z — 16 Startup Metrics and the SaaS unit-economics canon — Definitions of CAC, fully-loaded CAC, the dangers of understated CAC, and payback period. Https://a16z.com/16-startup-metrics/
- Lenny's Newsletter / Lenny Rachitsky — CAC payback and SaaS benchmark compilations — Practitioner benchmark aggregation on payback targets by segment and stage.
- SaaS Capital — Retention and Growth Benchmark Research — Research on gross and net revenue retention by company size and the link between retention and viable payback periods.
- Scale Venture Partners — Scaling Go-to-Market Efficiency — Magic Number methodology and its relationship to CAC payback.
- HubSpot Inc. — SEC filings (Form 10-K, Form 10-Q) — Disclosed gross margin, sales and marketing spend, revenue retention, and growth metrics. Https://ir.hubspot.com
- Salesforce Inc. — SEC filings (Form 10-K) — Disclosed enterprise go-to-market economics, retention, RPO, and multi-year contract structure. Https://investor.salesforce.com
- Monday.com Ltd. — SEC filings (Form 20-F) and investor materials — Disclosed go-to-market efficiency, net dollar retention, and PLG-influenced cost structure.
- Klaviyo Inc. — SEC filings (Form 10-K, S-1) — Disclosed customer economics, retention, and acquisition efficiency for an SMB-and-mid-market-exposed model.
- Bill Holdings Inc. (Bill.com) — SEC filings (Form 10-K) — Disclosed SMB-focused go-to-market economics and retention dynamics.
- Meritech Capital — Public SaaS company benchmarking and the Meritech comp set — Comparative analysis of public SaaS efficiency metrics including implied CAC payback.
- Battery Ventures — OpenCloud / Software benchmark reports — Growth-stage efficiency benchmarks and the post-ZIRP repricing of efficiency expectations.
- Insight Partners — ScaleUp go-to-market benchmark data — Segment-level CAC payback and retention benchmarks for growth-equity-stage companies.
- Mostly Metrics / CJ Gustafson — SaaS finance metric breakdowns — Practitioner-level treatment of fully-loaded CAC, gross-margin-adjusted payback, and the blended-vs-new-business distinction.
- The SaaS CFO / Ben Murray — CAC payback period calculation guides — Detailed methodology for computing gross-margin-adjusted, fully-loaded CAC payback.
- Tomasz Tunguz — Theory / Redpoint SaaS analyses — Long-running analyses of CAC payback trends, capital efficiency, and the cost of capital's effect on payback tolerance.
- Bessemer — Burn Multiple and capital efficiency frameworks (David Sacks origination of burn multiple) — Companion efficiency metric to CAC payback used in 2023-2026 diligence.
- Gartner and Forrester — B2B sales cycle and cost-of-sale benchmarks — Data on enterprise vs SMB sales cycle length and cost-to-acquire driving payback differences by segment.
- McKinsey & Company — B2B growth and go-to-market efficiency research — Analysis of channel cost structures (PLG, inbound, outbound, partner) and their efficiency profiles.
- Federal Reserve — interest rate policy and its documented effect on venture and growth-equity capital markets 2022-2026 — Macro context for the post-ZIRP efficiency reset.
- PitchBook-NVCA Venture Monitor — Data on venture funding terms, valuations, and the shift toward efficiency-gated term sheets 2022-2026.
- Carta — State of Private Markets reports — Data on private company financing terms and the tightening of efficiency expectations across stages.
- Public Comparables — Datadog, Snowflake, ServiceNow, Atlassian, Zoom investor disclosures — Additional cross-segment reference points for go-to-market efficiency, retention, and contract structure.
Numbers
The Three Anchor Targets
- Efficient / PE-grade bar: 12 months
- Healthy venture-scale default: 18 months
- Outer edge (elite-retention-justified only): 24 months
- 2021 ZIRP-era tolerance that has since been repriced: 24-30 months
- 2026 practical bar for the median Series A-C SaaS company: 12-18 months
Payback Target By Segment
- SMB: 6-12 months (GRR commonly 75-85%)
- Mid-Market: 12-18 months (GRR commonly 85-92%)
- Enterprise: 18-24 months (GRR commonly 92-96%+)
Payback Target By Channel
- PLG / self-serve: under 6 months (often under 3)
- Inbound (marketing-sourced, sales-closed): 9-15 months
- Outbound (SDR-sourced, sales-closed): 15-24 months
- Partner / channel: variable by program maturity
Payback Target By Growth Stage
- Seed: instrument it, do not manage to a hard number (inputs too noisy)
- Series A: 18-24 months acceptable
- Series B: under 18 months
- Series C+ / PE: under 12-15 months
The Gross-Margin Adjustment (worked example, $10K CAC / $1K new MRR)
- Computed on raw MRR: 10.0 months
- At 75% gross margin: 13.3 months (true)
- At 65% gross margin: 15.4 months (true)
- Error from skipping the adjustment: ~33-54% understatement
Fully-Loaded CAC — Components That Must Be Included
- Sales base compensation (AEs, SDRs, sales-assist roles)
- Sales commissions and variable comp (incl. Accelerators, SPIFs)
- Marketing program spend (paid, events, content, ABM)
- Marketing team salaries (demand gen, product marketing, ops)
- SDR/BDR fully-loaded cost
- Sales and marketing tools (CRM, sales engagement, intent, automation, attribution)
- Sales and marketing leadership and management (VP Sales, CMO, managers, RevOps)
- Allocated overhead (facilities, IT, recruiting attributable to GTM)
- Onboarding/implementation cost (if treated as cost of landing, not serving)
- Typical understatement from a "program spend + AE commission only" CAC: a 9-month reported payback can be a 17-month fully-loaded payback
Retention Pairing — Why The Number Is Meaningless Alone
- 24-month payback at 96% GRR: healthy enterprise business
- 24-month payback at 80% GRR: structurally insolvent
- Retention-adjusted ("true") payback vs crude payback at low GRR: 1.3x-2x longer, or effectively infinite
- Board reporting rule: never present payback without GRR (and ideally NRR) adjacent
The Magic Number Cross-Check
- Magic Number ~0.75+: efficient
- Magic Number >1.0: strong
- Magic Number <0.5: GTM engine struggling
- Magic Number and CAC payback are inverse views of the same efficiency
The Rule of 40 Interaction
- Rule of 40: revenue growth rate + profit margin >= 40
- 24-month payback + 60% growth: can clear 40 — long payback is a rational land-grab bet
- 24-month payback + 15% growth: cannot clear 40 — long payback is unjustified inefficiency
- 10% growth + 35% margin: clears 40 but usually signals a failure of ambition for venture-backed cos
Healthy LTV-to-CAC Implied By The Anchors
- Typical healthy LTV:CAC range: 3x-5x
- 12-month payback business: LTV:CAC typically well above 3x
- 18-month payback with solid retention: typically 3x-5x
- 24-month payback only clears 3x with elite (95%+ GRR, 120%+ NRR) retention
Multi-Year / Prepaid Contract Effect (worked example)
- $300K three-year contract, $100K-$300K collected up front, $180K CAC
- Revenue-recognized payback: ~18-22 months (gross-margin-adjusted)
- Cash payback: day one or near it
- Disciplined practice: report both views, never conflate them
Expansion-Adjusted / Net Payback
- At 130% NRR, net payback can run 20-35% shorter than the unadjusted figure
- Valid only for businesses with durable, broad-based, proven expansion
- 80% GRR + 105% NRR: fragile expansion story — do NOT lean on net payback
Decision Framework — The Five Inputs
- Input 1: Gross Revenue Retention (the master input — sets the payback ceiling)
- Input 2: Gross Margin (scales and reality-checks the calculation)
- Input 3: Net Revenue Retention (shortens the effective payback)
- Input 4: Growth Rate (via Rule of 40, buys tolerance for a longer payback)
- Input 5: Capital Runway and Environment (short runway forces a shorter target)
Moving Payback 24mo -> 15mo — Lever Timelines
- Discount discipline: acts within a quarter
- Sales comp redesign: acts within a quarter
- Channel mix shift: 2-3 quarters
- Pricing and packaging: 2-3 quarters
- Ramp acceleration: compounds over ~a year
- Gross-margin improvement: compounds over ~a year
- Realistic full 24->15 program: multi-quarter coordinated portfolio, not one initiative
Dashboard And Cadence
- Operating review of payback by segment and channel: monthly
- Leadership and board review (blended + segment): quarterly
- Finance reconciliation of CAC inputs to the P&L: at least quarterly
- Reconciliation tolerance: CAC sum should tie to the S&M line within a documented allocation tolerance
5-Year Outlook
- AI SDRs, AI-assisted marketing, AI sales tools: structurally compress fully-loaded CAC
- AI-native products: often 55-65% gross margin (model/inference cost) vs 80-85% classic SaaS
- Net effect: CAC compression diffuses industry-wide; the bar resets shorter
- Likely 2030 anchors: efficient bar shorter than 12mo, default toward 12-15mo, 24mo defensible in an even narrower set of cases
- The framework (payback read against retention, margin-adjusted, segmented, cross-checked) endures even as the numbers move
Counter-Case: When The Payback Target Is The Wrong Thing To Fixate On
Everything above argues for taking CAC payback seriously. But there is a real and opposite failure mode — treating payback as the master metric when, for a given company at a given moment, it is the wrong thing to optimize, or even to stare at. A serious finance leader should know when payback discipline becomes payback dogma.
Counter 1 — Pre-PMF, the payback number is noise and optimizing it is harmful. Before product-market fit, a company does not have a repeatable acquisition motion, a stable CAC, or a customer base large enough for cohort math to mean anything. The "payback" computed at this stage is a tiny-sample artifact dominated by founder-led selling that will not scale.
Worse, managing to a payback target pre-PMF actively damages the company: it discourages the wide, expensive, inefficient experimentation needed to *find* the motion that works. A seed-stage team that optimizes payback is optimizing the efficiency of a machine it has not yet built.
The right metric pre-PMF is evidence of genuine pull — retention, engagement, organic growth, willingness to pay — not the efficiency of an acquisition engine that does not exist yet.
Counter 2 — In a genuine winner-take-all land grab, a long payback can be the correct strategic choice. Some markets really do consolidate around a single winner, and the durable pricing power, retention advantage, and ecosystem lock-in that the winner captures dwarf any near-term efficiency consideration.
In that specific situation, deliberately running a long payback to capture the market before a competitor does is not undisciplined — it is the rational move, provided the company has the capital to sustain it and the market truly has winner-take-all dynamics. The error here is symmetric: a company that refuses to spend aggressively in a true land grab because its payback would lengthen may win the efficiency metric and lose the market.
The judgment call is whether the winner-take-all thesis is real — it often is not, and "land grab" is frequently a rationalization for undisciplined spending. But when it is real, payback is subordinate to speed of capture.
Counter 3 — A "good" payback can mask a new-logo growth collapse. This is the most insidious case. A company's blended CAC payback can look healthy — even *improve* — precisely because the company has quietly stopped acquiring new logos and is coasting on cheap expansion revenue from its existing base.
Expansion has a short payback; if the mix shifts hard toward expansion, the blended number gets *better* even as the new-business engine dies. A finance leader staring only at blended payback sees a green light while the actual growth story is collapsing underneath. The fix is the new-business-vs-blended discipline from the core — but the deeper lesson is that a payback number moving in the "right" direction is not automatically good news.
You have to know *why* it moved. Improving payback driven by a dying top of funnel is a crisis wearing a healthy costume.
Counter 4 — Optimizing payback can drive a short-termism that permanently caps the company's ceiling. Covered at length in the core, but it belongs in the counter-case because it is the central risk of taking this metric too seriously. The levers that improve payback fastest — cutting outbound, cutting brand, cutting category creation, cutting the enterprise motion, re-rigging comp toward easy deals — are the same levers that shrink the company's terminal addressable market.
A management team rewarded for payback improvement will, rationally, dismantle the long-payback investments that were quietly building the company's future. The metric improves; the company gets smaller. Payback must be a guardrail you stay inside, not a target you drive toward — and a board that incentivizes payback improvement without also protecting the long-payback strategic bets is engineering its own ceiling.
Counter 5 — At small scale, the inputs are too noisy to set a meaningful target. Even post-PMF, a company with a few dozen customers, a couple of quarters of cohort history, and a CAC that swings 40% quarter to quarter on the timing of a single big hire or a single big deal does not have a payback number stable enough to manage to a tight target.
Setting a precise target on noisy inputs creates false precision — and worse, it creates pressure to hit a number that is mostly measurement error. At small scale the honest posture is to track payback as a *directional* signal, watch the trend over enough quarters for the noise to average out, and resist the temptation to make sharp operating decisions off a number that is mostly variance.
Counter 6 — The target can become a definitional game instead of a discipline. Because payback depends entirely on how CAC and gross margin are defined, a team under pressure to "hit" a payback target can hit it on paper by quietly narrowing the CAC definition or inflating the gross-margin assumption — no real efficiency change, just a redefinition.
When the target becomes the thing being managed, the definitions become the thing being gamed. The metric then actively misleads everyone, including the team itself. This is a reason to hold the *definition* sacred and frozen, reconcile it to the P&L, and be suspicious of any payback improvement that coincides with a definitional change.
Counter 7 — Sometimes the binding constraint is simply not payback. A company can have a perfectly healthy payback and still be failing — because its real problem is a flat top of funnel, a product gap, a competitive displacement, a churn spike concentrated in a key segment, or a pricing model that caps expansion.
Payback is one diagnostic among several, and a leadership team that has made payback the headline metric can spend quarters optimizing it while the actual binding constraint goes unaddressed. The discipline is to ask, every planning cycle, "what is the *one* thing most limiting our growth right now?" — and to accept that the honest answer is often not CAC payback at all.
The honest verdict. CAC payback is a genuinely important metric and the 12/18/24 framework is a real and useful map — for a post-PMF SaaS company of meaningful scale, operating in a normal competitive market, raising or reporting in a disciplined capital environment, it should absolutely be instrumented, paired with retention, segmented, and managed.
But it is a guardrail and a diagnostic, not a destiny. It is the wrong thing to fixate on pre-PMF, in a true land grab, at sub-scale where the inputs are noise, when a "good" number is hiding a top-of-funnel collapse, when fixating on it drives a short-termism that caps the company, or when the actual binding constraint lies elsewhere entirely.
Take payback seriously. Do not let it become the only thing you take seriously. The companies that get this right treat payback as the seatbelt — non-negotiable, always on — while keeping their hands on the steering wheel of growth, market position, and terminal value.
Related Pulse Library Entries
- q91 — What's a healthy CAC payback by customer segment? (The companion entry — q91 covers payback *by segment*; this entry q98 is specifically about choosing the *target*, 12 vs 18 vs 24, and the decision framework behind it.)
- q92 — How do you calculate fully-loaded CAC? (Deep dive on the numerator referenced throughout this entry.)
- q93 — What is a good LTV-to-CAC ratio for SaaS? (The companion ratio metric; payback and LTV:CAC are two efficiency lenses.)
- q94 — How do you measure gross revenue retention vs net revenue retention? (The retention metrics this entry insists must be paired with payback.)
- q95 — What is the SaaS Magic Number and how do you use it? (The cross-check metric for CAC payback.)
- q96 — How does the Rule of 40 work for SaaS companies? (The growth-efficiency trade-off framework referenced in the Rule of 40 section.)
- q97 — What is a healthy burn multiple by stage? (Companion capital-efficiency metric in 2023-2026 diligence.)
- q99 — How do you build a SaaS unit economics model? (The model that ties CAC, payback, retention, and LTV together.)
- q100 — What gross margin should a SaaS company target? (The gross-margin input to the payback calculation.)
- q101 — How do you forecast net new ARR? (The denominator-side input to payback and Magic Number.)
- q88 — How do you set sales compensation to drive the right behavior? (The comp-redesign lever for moving payback.)
- q89 — How do you think about discount discipline in SaaS? (The discounting lever for moving payback.)
- q90 — How do you choose between PLG, inbound, and outbound? (The channel-mix decision that drives channel-level payback.)
- q102 — How do you price and package a SaaS product? (The pricing lever for moving payback.)
- q103 — How do you reduce sales rep ramp time? (The ramp-acceleration lever for moving payback.)
- q104 — How do you present unit economics to your board? (Companion to the board-framing section.)
- q105 — What metrics should be on a SaaS CFO dashboard? (The dashboard context for the payback cadence section.)
- q106 — How did the end of ZIRP change SaaS investing? (Macro context for the capital-environment section.)
- q107 — What do growth-equity investors underwrite in diligence? (The investor-posture context for the 12-month PE bar.)
- q108 — How do you model multi-year and prepaid contracts? (Deep dive on the multi-year contract effects section.)
- q109 — How will AI change SaaS go-to-market economics by 2030? (The 5-year-outlook context for CAC compression.)
- q110 — What is cohort analysis and how do you use it for retention? (The cohort math underlying retention-adjusted payback.)
- q111 — How do you segment a SaaS customer base for reporting? (The segmentation discipline behind segment-level payback targets.)
- q112 — When should a SaaS company move upmarket? (The strategic decision that shifts segment mix and payback.)
- q113 — How do you build an outbound sales motion? (The longest-payback channel discussed in the channel section.)
- q114 — How do you build a product-led growth motion? (The shortest-payback channel discussed in the channel section.)