


"Pipeline is the product." — LinkedIn Banner
Quality
Certified
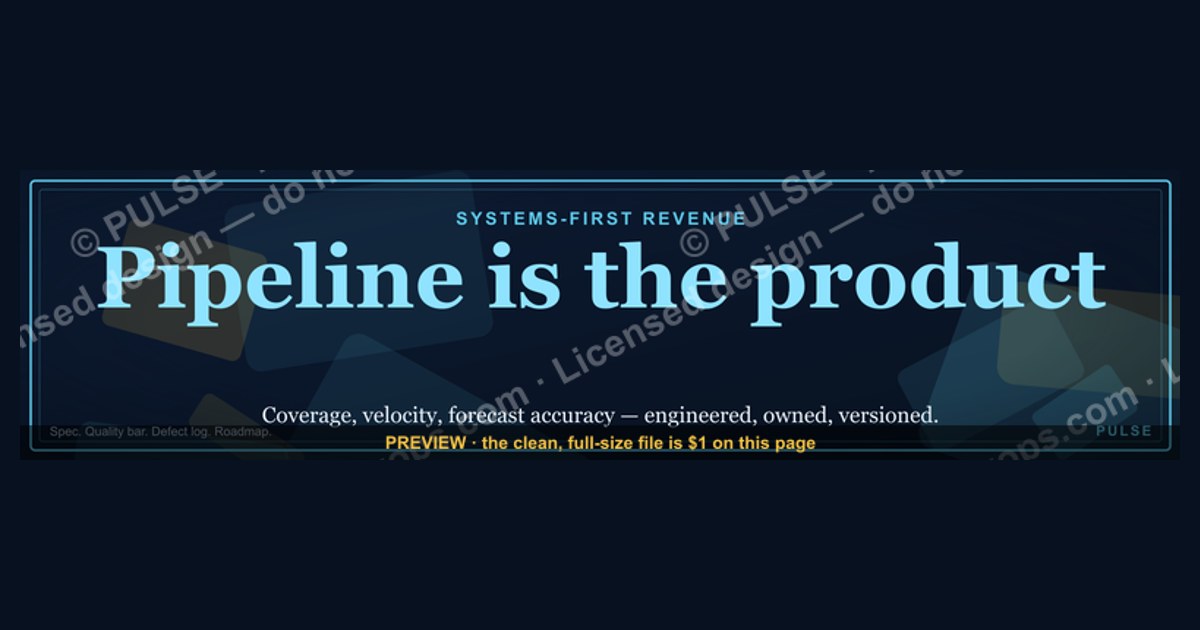

"Pipeline is the product" means the pipeline itself — not the closed deal — is the thing you build, measure, and improve. On a LinkedIn banner it signals a systems-first revenue operator: someone who treats coverage, velocity, and forecast accuracy as engineering problems with owners, backlogs, and release cycles rather than as monthly heroics.
What it is and why it matters
The slogan is a compression of a real operating model. In a transactional world, the product was the thing you shipped and pipeline was the plumbing that carried it to buyers. In a recurring-revenue world that inverts: the product ships continuously, revenue arrives in slices over years, and the only durable asset is the machine that keeps qualified demand flowing into it. Under that framing, "pipeline" stops being a CRM report and starts being a thing with a spec, a quality bar, a defect log, and a roadmap.
Why the distinction is more than semantics: products get budget, staffing, and iteration cycles. Reports get looked at once a week and complained about. When a revenue leader says pipeline is the product, they are claiming the first bucket of resourcing for the demand system — dedicated ops headcount, tooling spend, an experiment cadence, and a definition-of-done for every stage. That is a materially different posture from "sales needs more leads."
On a LinkedIn banner specifically, the phrase is doing personal-brand work. A banner is roughly 1584×396 pixels of prime real estate directly under a profile's name, visible on every profile view, and it is one of the few places on the platform where you can state a philosophy without it reading as a post. Recruiters skimming forty profiles for a VP of Sales role register that line in under a second. It sorts you: process operator, not closer-by-charisma. That sorting is the entire point of banner copy.

The adjacent meaning matters too, and it's worth being honest that the phrase has two lineages. In data and platform engineering, "pipeline is the product" has meant something almost identical for years — the ETL or CI/CD pipeline is the deliverable your internal customers actually consume, so it gets SLAs, on-call rotation, and versioning rather than being treated as glue code. Revenue teams borrowed the ergonomics of that idea: instrument the stages, alert on decay, own the reliability. If you use the banner, expect data engineers to read it their way and revenue people to read it theirs. Both readings are correct and both flatter you.
The practical consequence is a change in what gets celebrated. Teams that adopt this genuinely stop applauding "biggest deal of the quarter" as a standalone event and start applauding "stage-two-to-three conversion improved for the third consecutive month." One is a lottery ticket. The other is a product release.
The step-by-step process
Turning the slogan into an operating cadence takes about a quarter. The sequence below is deliberately boring, because the failure mode of this philosophy is treating it as inspiration rather than process.

Step one — define the unit. Write down what one qualified opportunity is, in language a new rep could apply without asking. Not "shows interest." Something closer to: identified budget owner, an articulated problem in a category you serve, a timeline, and a next meeting on the calendar. Most teams discover during this exercise that half their pipeline doesn't meet their own written bar. That discovery is the point.
Step two — instrument the stages. Every stage needs an entry criterion, an exit criterion, and a timestamp. If you cannot answer "how long does a deal sit in stage three" from your CRM without a manual export, you don't have a product, you have anecdotes. Most CRMs support stage-duration reporting natively; the blocker is usually inconsistent stage hygiene, not tooling.
Step three — set the baseline. Pull four numbers: coverage ratio, average stage-to-stage conversion, average cycle length, and forecast accuracy versus actuals for the last two or three closed quarters. Do not fix anything yet. Baselines you take after you start improving are worthless.
Step four — build the backlog. List every artifact and motion that touches the pipeline: outbound sequences, discovery frameworks, demo scripts, pricing pages, mutual action plans, follow-up cadences, handoff protocols. Rank each by estimated conversion impact against effort. You now have a product backlog, and it looks like one.

Step five — run the release cycle. Pick one to three items per month. Ship, measure against baseline, keep or kill. Document the learning either way — the killed experiments are the ones that stop your successor from repeating your mistakes.
Step six — publish the scorecard. Weekly, same format, same four dimensions, red/yellow/green. Visibility is what converts a philosophy into a norm.
The loop back from scorecard to backlog is the part people skip. Without it you get a one-time cleanup project that decays in two quarters.
Costs, timelines, and typical ranges
Adopting this properly is cheaper than most transformation initiatives and slower than most leaders expect.
Time to first signal: roughly 30 to 45 days. That is long enough to run one experiment cycle and see stage-conversion movement on short-cycle deals. If your average sales cycle is 90 days or more, your first credible read on velocity changes lands closer to two full cycles out — six months for enterprise motions. Leaders who promise the board a pipeline turnaround inside one quarter on a six-month cycle are promising something arithmetic won't deliver.
Coverage ratios: the widely cited working range is 3x to 5x quota in qualified pipeline, and where you sit inside it should be a function of your win rate, not a copied benchmark. The arithmetic is direct: if you close 25% of qualified opportunities, you need roughly 4x. If you close 40%, 2.5x is sufficient and chasing 5x means your reps are working junk. Teams that carry 5x coverage with a 15% win rate don't have healthy pipeline, they have an inflated denominator.

Forecast accuracy: mature teams generally land within roughly 10% of called number by end of quarter. Teams starting this work often find themselves 25% to 40% off, in both directions. Over-forecasting is the common one, but chronic sandbagging is equally a defect — it means your stage definitions aren't being applied consistently.
Headcount cost: the first dedicated revenue-ops hire typically covers a sales org somewhere in the range of 15 to 40 reps before a second is needed, depending on system complexity and how many tools are in the stack. Below roughly ten reps, this is usually a fractional or part-time responsibility owned by a sales leader who blocks a half-day a week for it — and honestly, that half-day is the highest-leverage time on their calendar.
Tooling: a CRM you already own plus disciplined stage hygiene gets you most of the way. Conversation intelligence, forecasting layers, and enrichment tools add real value but add it on top of process, never in place of it. The failure pattern is buying a forecasting tool to fix a stage-definition problem. Budget the process work first; the tools are the amplifier.
Where the real cost sits: it isn't software, it's the political cost of enforcing stage exit criteria against a rep who wants a stalled deal to stay in commit. That enforcement, repeated maybe a dozen times in the first quarter, is what actually makes the system real.
Where teams get it wrong

Mistaking the banner for the practice. The most common failure is a leader who puts the line on their LinkedIn profile and changes nothing about their Monday pipeline review. The phrase becomes a costume. Anyone in your network who actually runs this way can tell within one conversation, because they'll ask what your stage-three-to-four conversion is and you won't have it.
Optimizing coverage as a standalone number. Coverage is the easiest metric to game — loosen qualification and it triples overnight. It should never be looked at without win rate and cycle length beside it. A single-metric target on a system with four interacting variables produces exactly the distortion you'd predict.
Treating pipeline generation as marketing's job. In the product framing, marketing owns the inputs, sales owns the conversion mechanics, and success owns expansion and referral. If any one of those three thinks pipeline is someone else's product, the handoffs rot. The specific symptom is arguing about lead quality in QBRs instead of agreeing on a shared qualified-opportunity definition and auditing against it monthly.
Never killing anything. Product teams deprecate features. Revenue teams almost never deprecate channels, sequences, or events. If your backlog only ever grows, you're not running a product, you're accumulating. Every quarter should retire at least one motion that isn't earning its cost.

Sanitizing the defect log. Pipeline decay — deals that go dark, stages that stall, forecast misses — is your bug tracker. Teams that reframe every miss as "timing" learn nothing. The useful practice is a short, blameless post-mortem on lost or stalled deals above a dollar threshold, with the finding written into the backlog rather than into a slide.
Instrumenting so heavily nobody updates the CRM. The mirror-image failure. If your stage definitions require twelve required fields, reps will pattern-match their way through them and your data will be confidently wrong — worse than missing. Three to five meaningful required fields per stage is usually the ceiling before compliance quietly collapses.
Ignoring the downstream half. Pipeline as product tends to get applied only to new logo. Renewal and expansion pipeline deserves identical treatment — arguably more, since it converts at multiples of new-business rates. Teams running this framing well have a renewal pipeline with stages, coverage, and a scorecard, not a spreadsheet of dates.
Decision framework: when to choose what
Not every team should be running the full apparatus, and the honest answer depends on stage and cycle length.

Pre-product-market-fit, under roughly ten deals closed: don't build the machine yet. You don't have enough data for stage conversion rates to mean anything, and premature process locks in a qualification bar built on guesses. Do exactly one thing from this framework: write down what a qualified opportunity is, and revise it monthly as you learn. That's it.
Early repeatability, ten to a hundred deals: instrument stages and take a baseline. Run one experiment a month. Skip the scorecard ceremony — a shared doc reviewed in your existing weekly is enough. Adding meetings at this stage costs more than the visibility gains.
Scaling, multiple reps and segments: the full loop earns its keep. Backlog, monthly release cycle, weekly scorecard, dedicated ops ownership. This is where the framing pays for itself, because you're now trying to make a system perform consistently across people with different natural styles.
Enterprise, long cycles, committee buying: everything above, plus per-stage instrumentation on the multi-threading dimension — how many stakeholders are engaged, and whether that count is growing. On a nine-month cycle, stage conversion is too lagging to steer by alone; you need leading indicators inside the stage.
As for the banner itself: it's a fit if you can back it in conversation. If you're job-searching into a RevOps, sales-ops, or CRO seat, it does real sorting work in your favor. If you're an individual contributor whose value is relationship depth rather than systems, a different line represents you better — the banner should be true, not aspirational.
The quarterly deprecation review at the bottom is the discipline that keeps the whole thing from becoming bureaucracy. Anything that can't show its contribution gets cut.
Related questions

Does this phrase mean the same thing in data engineering?
Nearly. There, "pipeline is the product" means your ETL or CI/CD pipeline is what internal customers actually consume, so it earns SLAs, versioning, and on-call ownership rather than being treated as disposable glue code. Same posture, different pipeline.
What are the right LinkedIn banner dimensions?
LinkedIn personal profile banners render at 1584×396 pixels. Keep text well inside the center band — the profile photo overlaps the lower left, and mobile crops the edges more aggressively than desktop. Vector source scales cleanly if you re-export later.
Is coverage ratio or win rate the better health metric?
Neither alone. They're a pair: required coverage is roughly the inverse of your win rate. High coverage with a low win rate signals loose qualification, not health. Read them together with cycle length and you have a usable picture.
How long before this changes forecast accuracy?
Expect two full sales cycles before forecast accuracy visibly tightens. On a 60-day cycle that's about four months; on a nine-month enterprise cycle, closer to eighteen. Stage-conversion improvements show up much sooner, often within 30 to 45 days.
Should the banner say something different for an individual contributor?

If your value is relationship depth or category expertise rather than systems design, yes — pick a line that's true of you. Banner copy that oversells gets tested in the first interview question and costs more credibility than a generic banner would have.
FAQ
What does "Pipeline is the product" actually mean?
It means the pipeline — not any individual closed deal — is the artifact you're building. Every prospecting motion, qualification standard, and forecast ritual is a feature of that artifact, subject to measurement and iteration. Closing is the outcome; the pipeline is the thing you engineer to make outcomes predictable.
Is it a slogan or an operating model?
Both, and the gap between them is where credibility lives. As a banner line it signals a systems-first identity. As an operating model it means a real backlog, a monthly release cycle, and a published scorecard. If you use the line without the practice, expect the mismatch to surface fast in conversation with anyone who runs it for real.
Who typically puts this on a LinkedIn banner?

Revenue leaders, fractional CROs, sales operations and RevOps practitioners, and demand-generation leaders. It's most common among people whose differentiation is repeatability rather than individual closing ability — and it reads as a sorting signal to recruiters looking for exactly that profile.
Does treating pipeline as the product de-emphasize closing?
No — it makes closing less dramatic. The argument is that a well-specified pipeline converts more predictably, so the close becomes the expected end of a known process rather than a monthly rescue mission. Teams running this well usually see cycle length and forecast variance drop before win rate moves.
What metrics belong on a pipeline scorecard?
Four dimensions cover most situations: coverage against target, stage-to-stage velocity, quality measured as qualified-to-closed-won conversion, and predictability measured as forecast versus actual. Grade each red, yellow, or green weekly. The grading matters more than metric precision — it forces a shared conversation about which dimension is actually broken.
Can an early-stage startup with no pipeline apply this?
Yes, but only the first step. Write down what a qualified opportunity is for your specific market and revise it monthly as evidence arrives. Skip the scorecard, the backlog, and the release cadence until you've closed enough deals for conversion rates to carry signal — usually somewhere past the first dozen.
Sources
- https://martinfowler.com/articles/continuousIntegration.html — Martin Fowler on continuous integration, the origin of the treat-the-pipeline-as-a-product posture in engineering
- https://cloud.google.com/architecture/devops — Google Cloud's DevOps research and capabilities library on measuring and improving delivery systems
- https://www.linkedin.com/help/linkedin/answer/a570679 — LinkedIn Help on profile background image requirements and dimensions
- https://itrevolution.com/product/the-devops-handbook/ — The DevOps Handbook, IT Revolution Press, on treating internal delivery systems as products
- https://www.thoughtworks.com/radar — ThoughtWorks Technology Radar, ongoing assessment of pipeline and platform-as-product practices
- https://aws.amazon.com/architecture/well-architected/ — AWS Well-Architected Framework, operational excellence pillar
- https://hbr.org/2017/03/the-sales-learning-curve — Harvard Business Review on the sales learning curve and when repeatable process starts to pay
- https://www.mckinsey.com/capabilities/growth-marketing-and-sales/our-insights — McKinsey growth, marketing and sales insights on revenue operating models
Related on PULSE
- "Pipeline is the product." — LinkedIn Banner
- "Sell the problem, not the product." — LinkedIn Banner
- Product Marketing Lead — LinkedIn Banner
- Product Launch (GTM) — Title Slide
- "Sell the Problem, Not the Product" — Quote Card
- "Sell the problem, not the product." — Quote Card
This page will be disappearing soon. Save it to your device for $1 — or read it free while it is here.
@Kory-White- · if Venmo asks, the last 4 of my number are 2012
This page is gone.
This one is off the shelf now. $1 keeps it on your phone for good — the whole page, pictures and diagrams included.
 graphic“Bring the energy every call.” — LinkedIn Banner
 graphicWhat do top-performing graphic designers do differently in 2027?
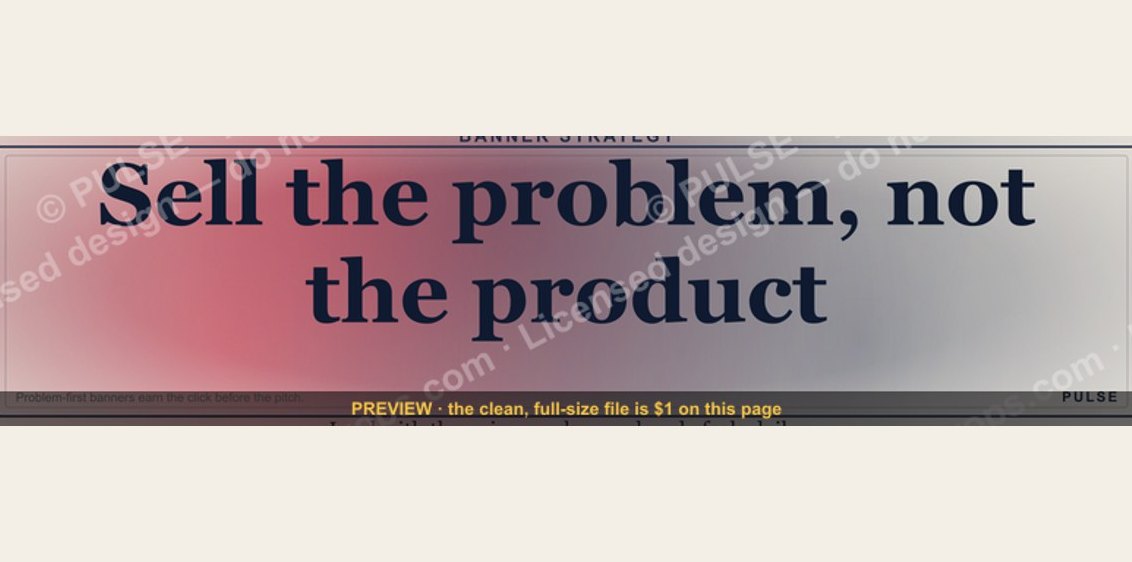 graphic“Sell the problem, not the product.” — LinkedIn Banner
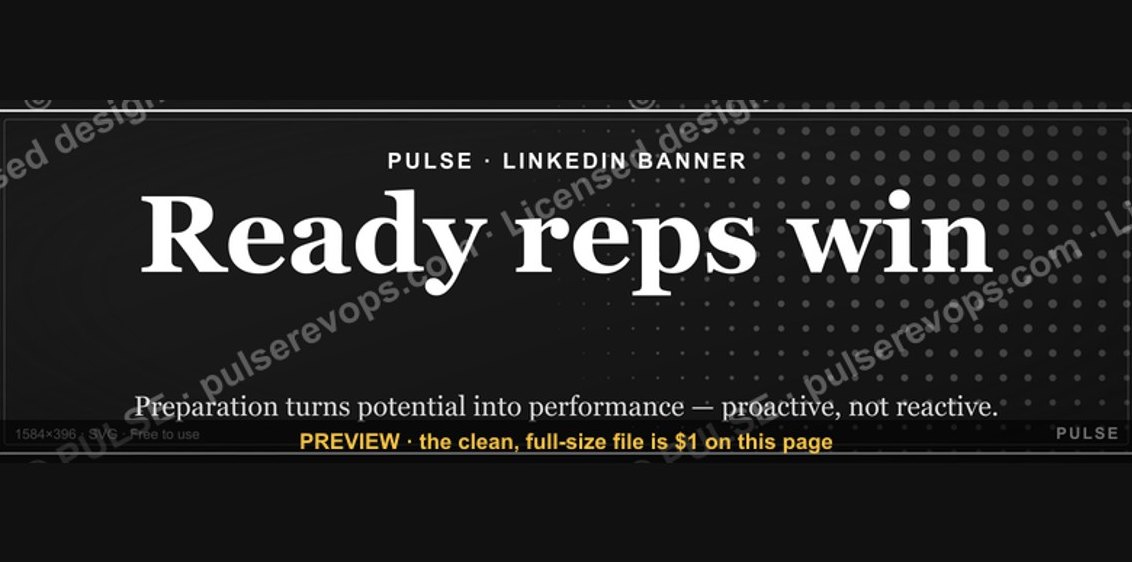 graphicReady reps win. — LinkedIn Wallpaper
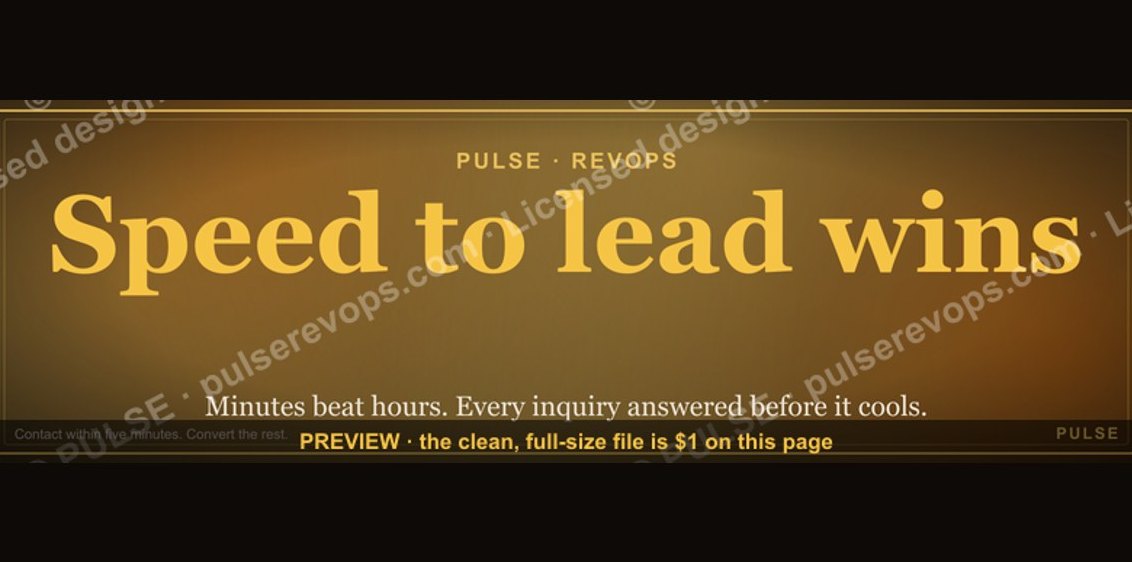 graphicSpeed to lead wins. — LinkedIn Wallpaper
 graphicSales Coach — LinkedIn Banner
 graphicInspect. Qualify. Commit. — LinkedIn Wallpaper
 graphicFractional CRO — LinkedIn Banner
 graphic“Sell things worth buying.” — LinkedIn Banner
 graphicRevOps Manager — LinkedIn Banner