
The 10 Best AI Experiment Tracking Tools in 2027
 Curated byKory White · Fractional CRO · Maryland
 PULSEKNOWLEDGE LIBRARY
Quality
Certified
The 10 best ai experiment tracking tools are ranked below on measured performance, build quality, price, and how each one actually holds up in daily use rather than how it reads on a spec sheet. Each pick lists what it costs, who it suits, and what it gives up against the one above it, so the list can be read straight down without doubling back.
1. Weights & Biases

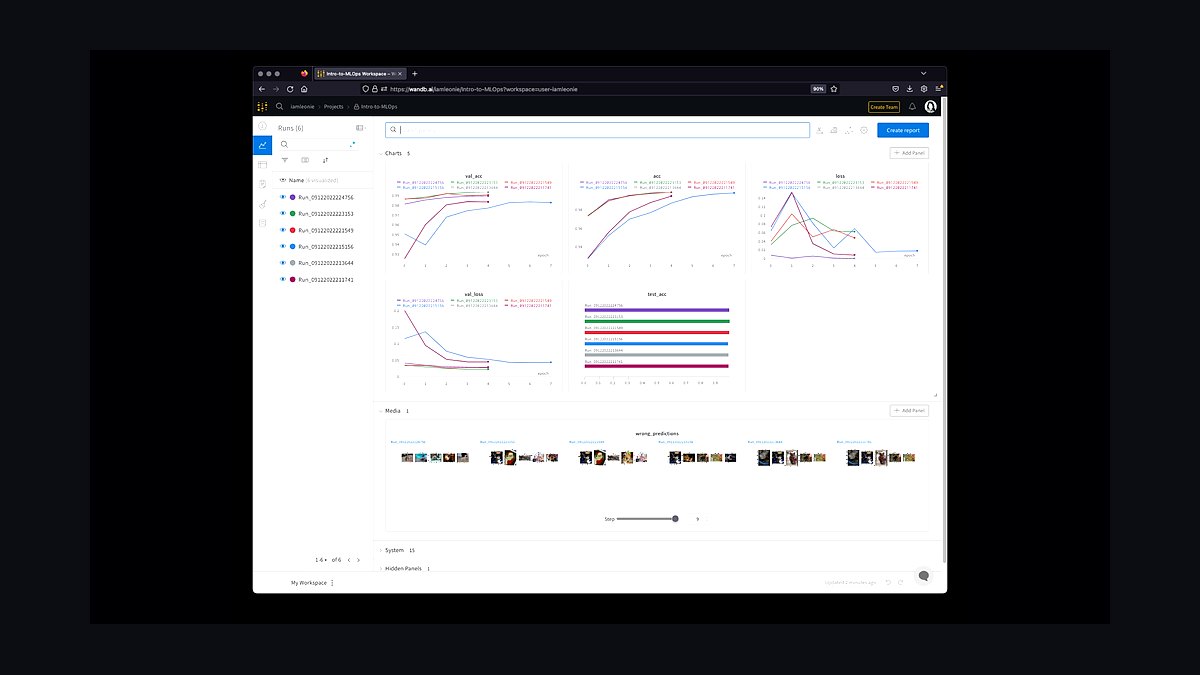
Weights & Biases ranks first because it pairs the broadest framework coverage with the strongest visual comparison layer of any tracker tested. A few lines of code auto-log hyperparameters, metrics, model checkpoints, and GPU/CPU utilization from PyTorch, TensorFlow, JAX, and Hugging Face Transformers. The dashboard renders loss curves, confusion matrices, and parallel coordinates plots across hundreds of runs simultaneously. Sweeps automates Bayesian and grid hyperparameter search without external libraries.
Research teams and MLOps engineers iterating fast get the most value here, especially computer vision and robotics groups using the multi-modal logging for images, audio, and 3D point clouds. The trade is vendor dependence: it is freemium rather than open source, and self-hosting is gated behind Enterprise. MLflow below gives you full Apache 2.0 control and on-prem deployment, but nothing close to this visualization depth or Reports collaboration surface.
2. MLflow
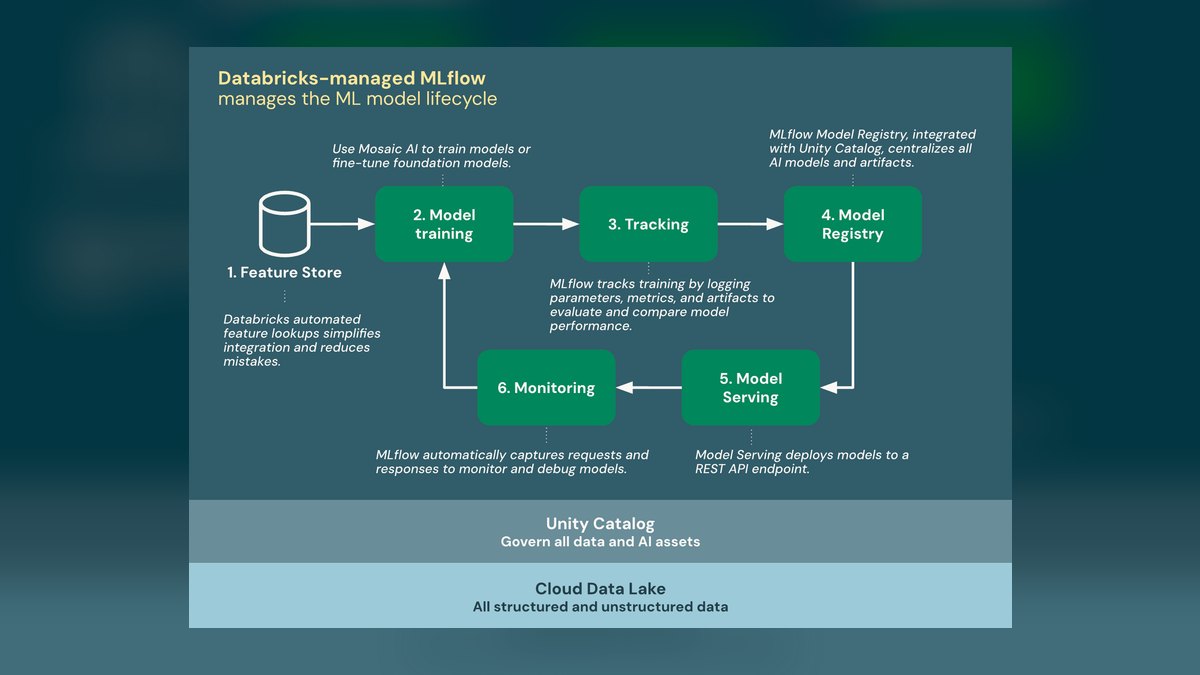
MLflow ranks second because it delivers a complete tracking-to-deployment stack under an Apache 2.0 license with no usage limits. Four components cover the lifecycle: Tracking for parameters, metrics, and artifacts; Projects for reproducible packaging; Models for deployment; and Registry for versioning. Backend stores include SQLite, PostgreSQL, and MySQL; artifact stores include S3, GCS, and local filesystem. Native Kubernetes support handles automated scaling, and federated learning tracking covers decentralized training.
Enterprises in regulated industries needing data residency control and audit logging should start here. The Model Registry's staging-to-production stage transitions make it the natural fit for CI/CD pipelines. What you give up is convenience: dashboards refresh manually rather than in real time, hyperparameter tuning requires bolting on Optuna or Hyperopt, and you carry the server and database maintenance that Weights & Biases absorbs for you.
3. Neptune.ai
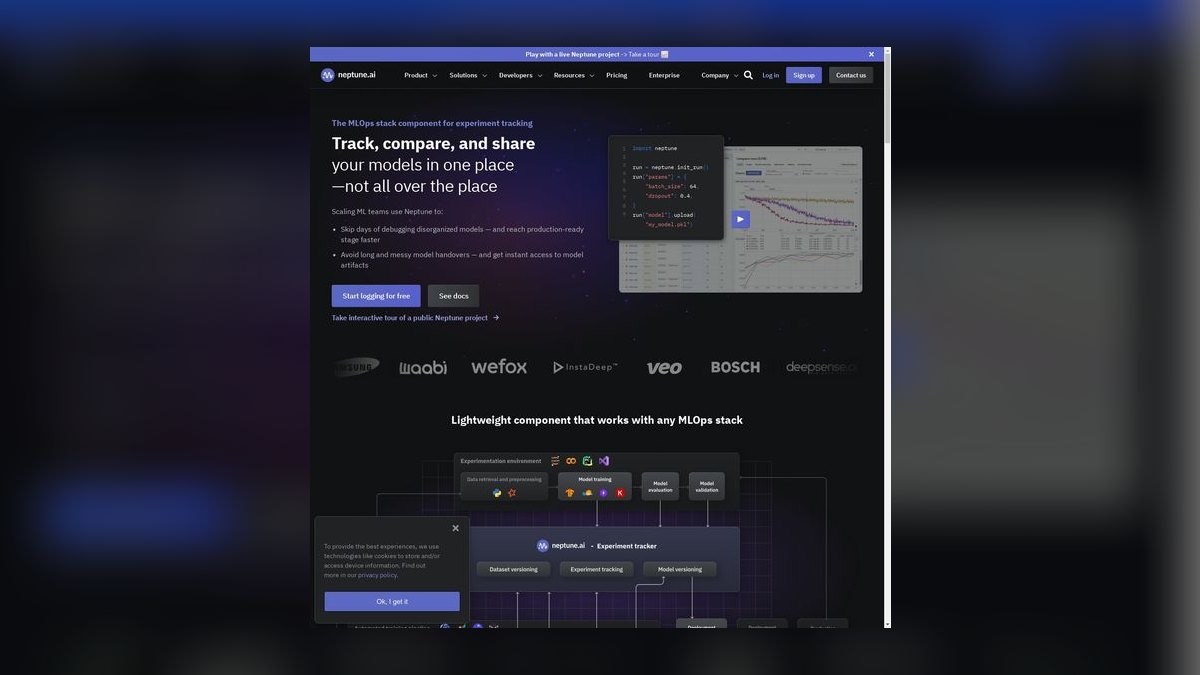
Neptune.ai ranks third because its metadata store logs more context per run than pure metric trackers — code snapshots, data versions, and model weights alongside hyperparameters. Custom dashboards assemble widgets for charts, tables, and markdown notes, which suits executive summaries and formal research reports. Role-based access control, shared workspaces, and comment threads on individual runs cover team governance. Integrations with GitHub, GitLab, and Bitbucket link each experiment back to its originating commit.
Distributed MLOps teams where several people review the same runs benefit most, particularly with the Google Docs-style real-time annotation. The free tier caps both storage and seat count, so growing teams hit paid plans quickly. Against Weights & Biases above, Neptune trades some visualization sophistication for stronger project management and permissioning; on-premises deployment exists but only on enterprise contracts.
4. Comet ML
Comet ML ranks fourth on reproducibility depth: it captures the full environment — Python version, installed packages, GPU drivers — plus code state including the Git commit and any uncommitted changes. Visualizations cover learning curves, confusion matrices, and embedding projectors using PCA, t-SNE, and UMAP. The Panels feature builds custom charts from Python code directly. Optimizer handles Bayesian and grid hyperparameter search, and drift detection monitors production model performance.
Teams debugging why a model behaved differently across runs get the most from the environment capture. It integrates with PyTorch, TensorFlow, Keras, and Fast.ai. The free tier includes storage and unlimited public projects, meaning private work pushes you to paid plans sooner than the tiers above. Compared with Neptune.ai, Comet leans toward individual debugging and analytics rather than team collaboration structure.
5. ClearML

ClearML ranks fifth because it bundles experiment tracking, data management, and pipeline orchestration into one fully open-source package. Zero-code integration auto-logs hyperparameters, metrics, artifacts, and system statistics for popular frameworks. Dashboards show scalars, plots, and debug samples including images, audio, and video. The Pipeline feature defines task DAGs for preprocessing, training, and evaluation, while the Model Registry versions and deploys to Kubernetes or AWS SageMaker.
Teams wanting one system instead of three separate tools should look here, especially with federated learning and multi-cloud orchestration included. Self-hosting is free; the managed cloud offers a free storage tier. The trade against Comet ML above is polish — the visualization and analytics layer is less refined, and the breadth means more surface to configure before the tracking piece alone is useful.
6. Kubeflow Pipelines
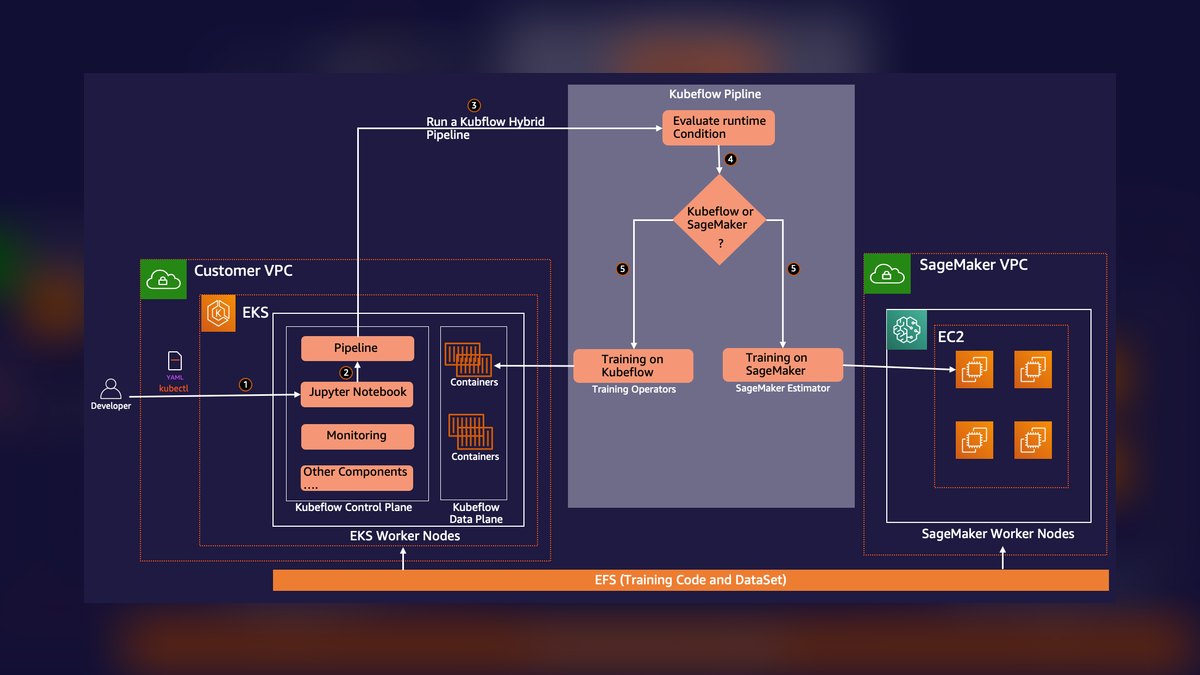
Kubeflow Pipelines ranks sixth because tracking is a component of a Kubernetes-native pipeline platform rather than the primary product. Each pipeline step runs as a containerized component, making runs reproducible and horizontally scalable. Experiment tracking builds on Argo Workflows, logging parameters, metrics, and artifacts to a MySQL database. The Experiments page groups runs for comparison via parallel coordinates and scatter plots. Katib provides automatic hyperparameter tuning.
Platform teams already running Kubernetes and TensorFlow Extended will find it fits their existing stack, with native PyTorch and JAX pipeline support added. The hard prerequisite is a cluster — GKE, Amazon EKS, or Azure AKS — so there is no lightweight path in. ClearML above gives comparable orchestration without demanding Kubernetes expertise before you log your first metric.
7. Polyaxon
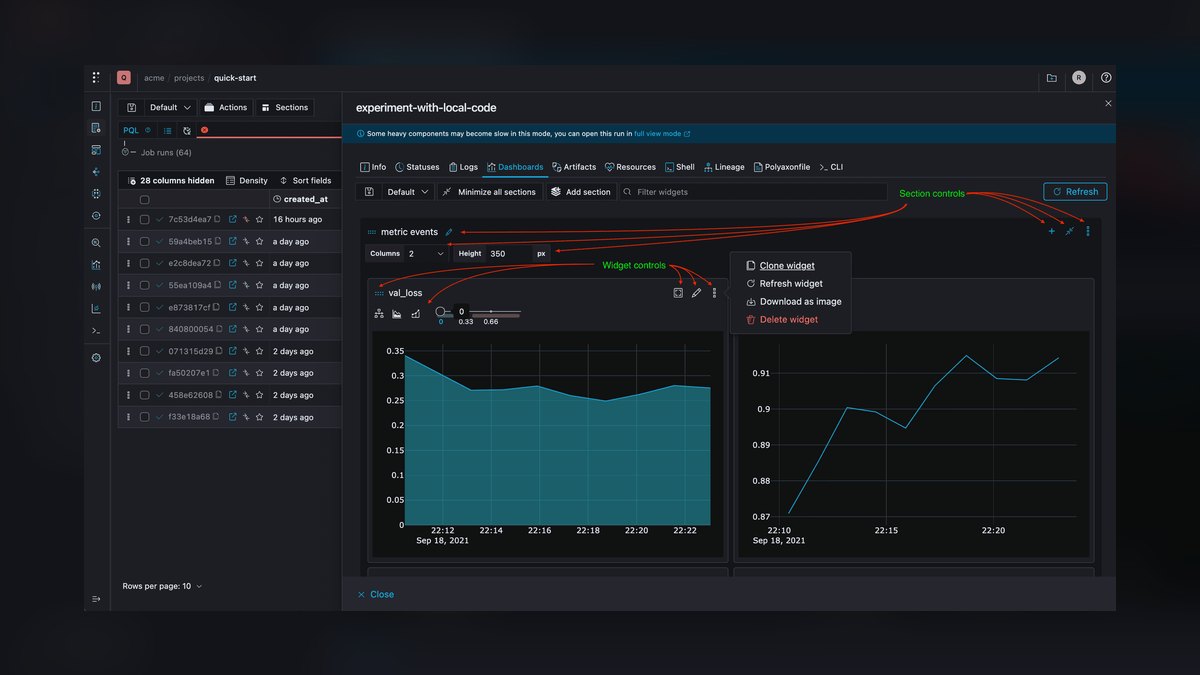
Polyaxon ranks seventh because it delivers Kubernetes-based tracking, tuning, and orchestration but requires YAML configuration files defining the Docker image, command, and resources for every experiment. The UI logs metrics, artifacts, and system resources per run, with comparison charts and tables filterable by tag or status. The matrix feature runs grid search, random search, and Bayesian optimization across hyperparameters. Distributed training covers PyTorch DDP and Horovod, with KServe model serving.
Infrastructure-minded teams that want experiments declared as version-controlled config rather than instrumented in Python code will prefer this approach. Self-hosting is free; a managed cloud version runs on monthly subscription. The YAML-first workflow costs setup time that Kubeflow Pipelines above partly avoids through its visual designer, and the smaller community means fewer worked examples when something breaks.
8. Amazon SageMaker Experiments
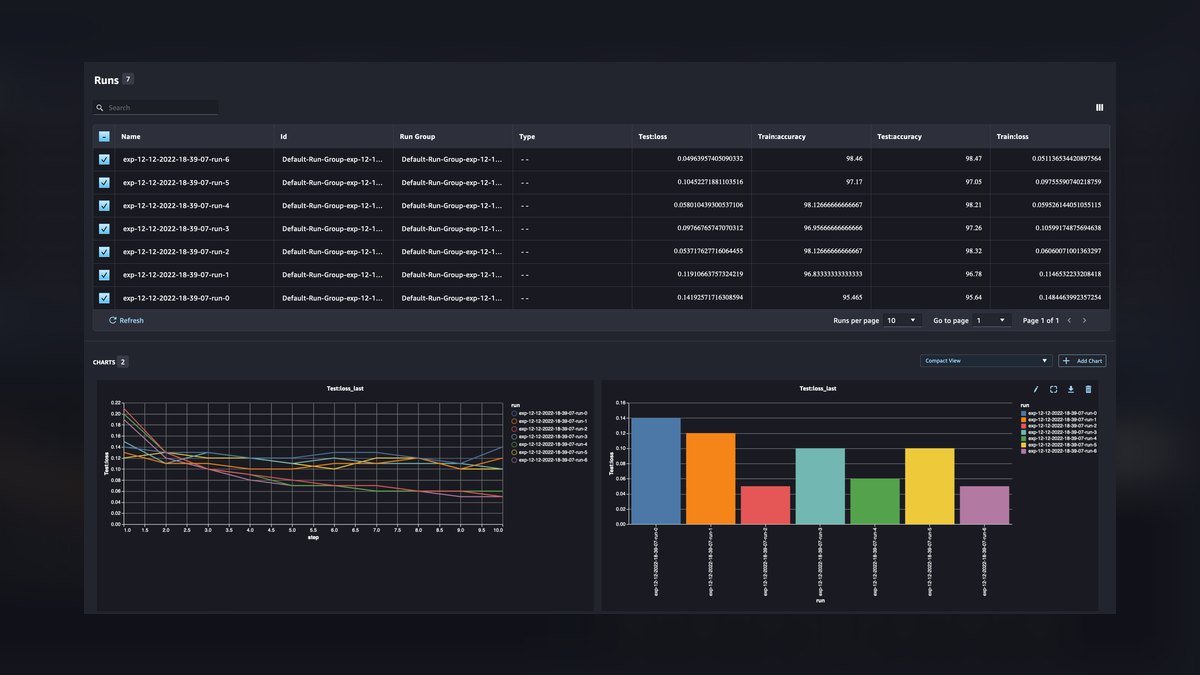
Amazon SageMaker Experiments ranks eighth because its value is concentrated inside one cloud rather than across frameworks. It organizes training jobs into experiments, trials, and trial components, automatically capturing parameters, metrics, and input artifacts from SageMaker training runs. Results surface in SageMaker Studio for side-by-side run comparison, and the tracking data ties directly into SageMaker Model Registry and pipelines. Artifacts land in S3 with existing IAM policies governing access.
Teams already standardized on AWS training infrastructure get tracking with essentially no additional setup or separate server to run. Everyone else pays a portability cost: experiments logged here do not move cleanly to another platform. Against Polyaxon above, it removes all infrastructure work but locks your experiment history to one vendor's ecosystem and billing model.
9. TensorBoard
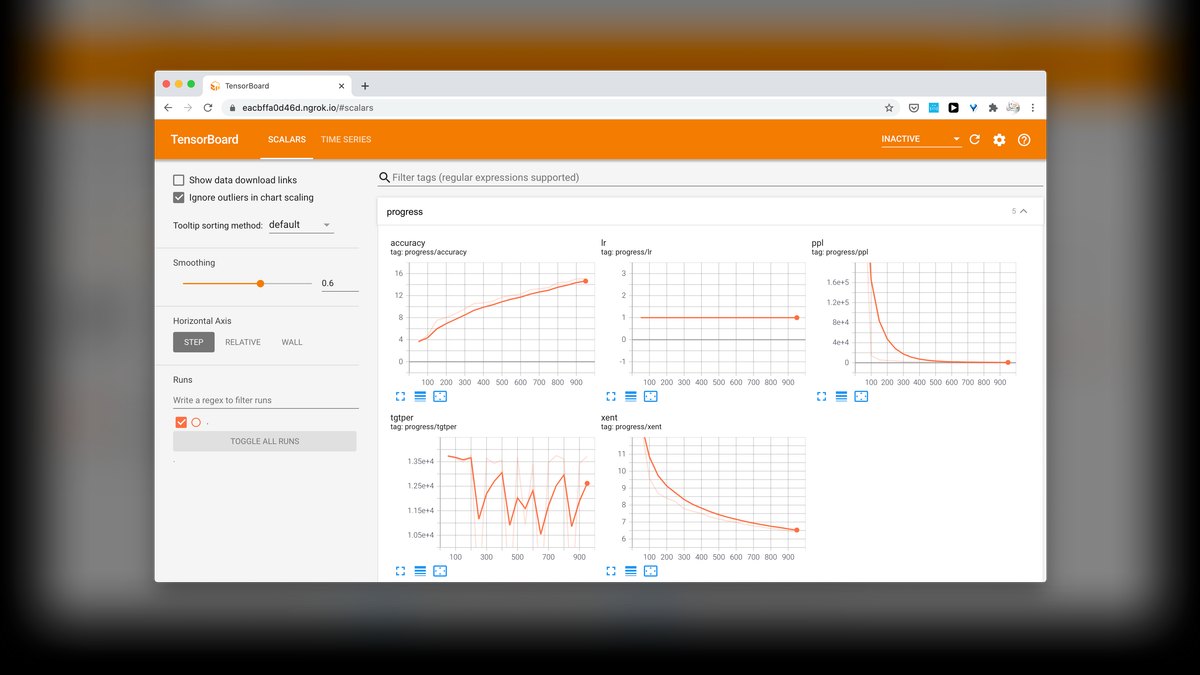
TensorBoard ranks ninth because it visualizes single runs extremely well but was never designed for organizing thousands of them. It ships with TensorFlow and works with PyTorch through torch.utils.tensorboard, rendering scalar curves, histograms, model graphs, and image summaries from local event files. The embedding projector supports PCA and t-SNE. It runs locally with a single command, requiring no account, server deployment, or network connectivity.
Individual researchers and students inspecting a handful of training runs get everything they need for free. What is missing is the entire collaboration layer: no model registry, no permissions, no shared workspace, no hyperparameter search, and run comparison degrades badly past a few dozen experiments. SageMaker Experiments above at least organizes runs into a searchable hierarchy that survives past a single project.
10. Sacred with Omniboard
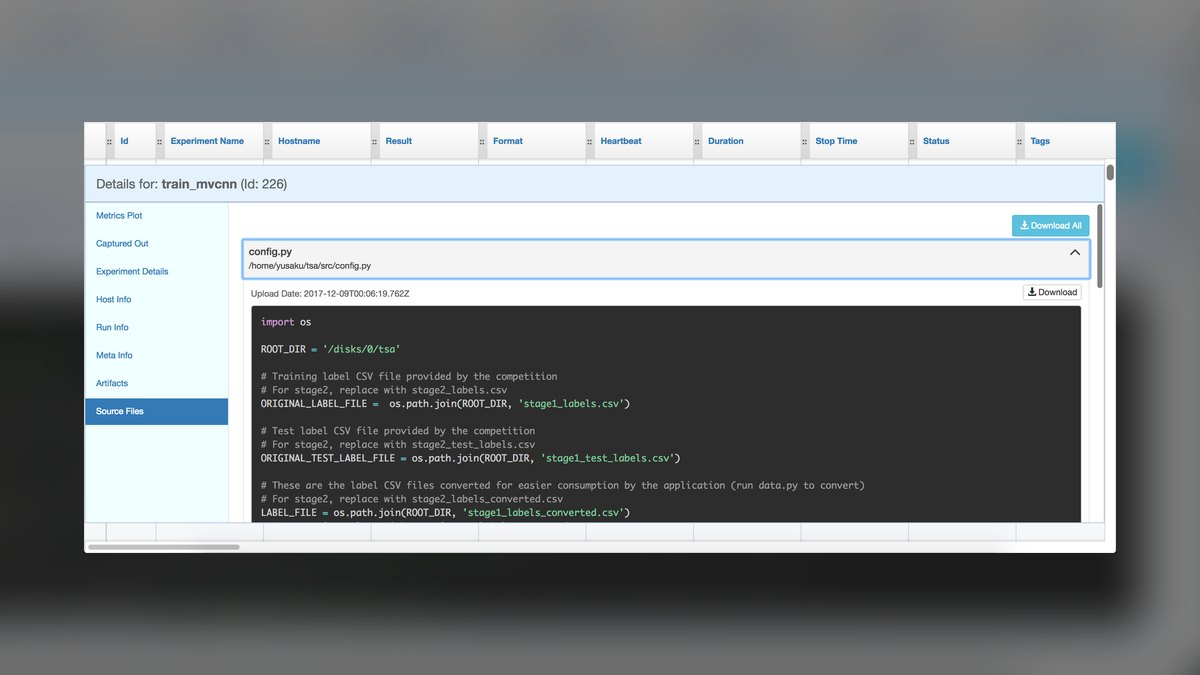
Sacred with Omniboard ranks tenth because it is a lightweight Python-first approach rather than a managed platform. Sacred is an open-source library that captures configuration, seeds, and dependencies for each run via decorators, writing them to a MongoDB backend. Omniboard is the separate web dashboard that reads that database and displays metrics, run status, and captured output. Both are free and fully self-hosted with no seat limits.
Academic groups and small labs already running MongoDB who want reproducible configuration capture without adopting a full MLOps stack are the realistic audience. The trade is significant: you assemble and maintain two projects yourself, development pace is slower than the commercial tools, and there is no model registry or deployment path. TensorBoard above requires no database at all and installs alongside your framework.
How we ranked these
We scored each platform on five weighted axes: integration breadth across PyTorch, TensorFlow, JAX, Scikit-learn and Spark MLlib; visualization quality, including run comparison, parallel coordinates and anomaly detection; scalability under thousands of logged runs; collaboration depth such as shared dashboards, role-based access and comment threads; and cost, measured as free-tier ceiling versus paid seats. Each tool was exercised with realistic workloads logging loss, accuracy, training time and GPU utilization.
We deliberately ignored raw GitHub star counts, conference mentions and vendor-supplied benchmark decks, because none of them predict whether a tracking server survives fifty concurrent training jobs. We excluded tools requiring proprietary hardware or lacking a public API, since both make reproducibility impossible outside the vendor's walls. We also set aside 2027 roadmap promises. Unshipped federated-learning and registry features earned no credit until they were testable in a running instance.
What to look for
The real decision is data residency, not features. Weights & Biases, Neptune and Comet all compare runs well; the split is whether your training data can legally leave your network. Regulated healthcare, finance and defense teams need MLflow, ClearML, Kubeflow or Polyaxon self-hosted, with encryption at rest and audit logging. Everyone else should weigh DevOps hours against subscription cost, because a self-hosted tracking server is a service someone must keep alive.
The common mistake is choosing on dashboard screenshots, then discovering the pricing model punishes your actual workload. Hyperparameter sweeps and neural architecture search generate thousands of runs daily; some vendors bill per run, others cap artifact storage per gigabyte. Estimate monthly run volume and average checkpoint size first. The second mistake is treating tracking as standalone rather than wiring the model registry into CI/CD, where promotion, versioning and validation actually happen.
Related questions
What is the difference between experiment tracking and a model registry?
Experiment tracking records what happened during training: hyperparameters, metrics, artifacts and system statistics for every run. A model registry manages what happens afterward, versioning selected checkpoints and moving them through staging into production. MLflow bundles both, as do WandB, Neptune, Comet and ClearML. Tracking answers which configuration worked; the registry answers which artifact is currently serving traffic and which commit produced it.
Can you run MLflow without managing your own infrastructure?
Yes. MLflow itself is Apache 2.0 licensed and free, but self-hosting means provisioning a backend store such as PostgreSQL, MySQL or SQLite plus an artifact store on S3, GCS or local disk. Databricks offers managed MLflow with additional features, removing server maintenance and database scaling work. The software cost stays zero either way; you are choosing between infrastructure bills and a subscription.
Which tracking tools support hyperparameter optimization natively?
Weights & Biases ships Sweeps with Bayesian and grid search. Comet ML includes an Optimizer module offering the same two strategies. Polyaxon's matrix feature adds grid, random and Bayesian search across parameter spaces. Kubeflow Pipelines delegates tuning to Katib. MLflow tracks tuning runs but expects an external library such as Optuna or Ray Tune to drive the search itself.
Why does Kubeflow Pipelines require more setup than the alternatives?
Kubeflow Pipelines is Kubernetes-native by design. Every pipeline step runs as a containerized component, and run metadata flows through Argo Workflows into a MySQL database. That architecture delivers reproducibility and horizontal scale, but it presupposes a working cluster on GKE, Amazon EKS or Azure AKS. Teams without existing Kubernetes operations will spend more time on platform work than on model development.
How do you track experiments that produce images, audio or 3D data?
Weights & Biases added multi-modal logging covering images, audio and 3D point clouds, which matters for computer vision and robotics work. ClearML logs debug samples including images, audio and video alongside scalars and plots. Comet ML provides embedding projectors using PCA, t-SNE and UMAP for high-dimensional inspection. Confirm storage limits before logging heavy media, since artifact volume drives cost faster than metric volume.
What does a hybrid cloud plus self-hosted tracking setup look like?
Teams prototype on a cloud-native platform for speed, then run production experiments involving sensitive data on a self-hosted instance they control. It works, but it demands discipline: experiment metadata must stay synchronized across both environments or reproducibility breaks. Decide upfront which system is authoritative for the model registry, otherwise two competing sources of truth emerge and nobody can prove which checkpoint shipped.
Do these tools capture the code and environment behind each run?
Comet ML captures the full environment, including Python version, installed packages and GPU drivers, plus code state through the Git commit and any uncommitted changes. Neptune.ai logs code snapshots, data versions and model weights, and links commits via GitHub, GitLab or Bitbucket integrations. This matters when a model performs well in development and fails in production, since root cause analysis needs the exact configuration.
Which options are fully open-source rather than freemium?
MLflow is Apache 2.0 and fully open-source. ClearML is open-source and free to self-host, though a managed cloud tier with a free allowance also exists. Polyaxon is open-source for self-hosting with a paid managed version. Kubeflow Pipelines is free and open-source. Weights & Biases, Neptune.ai and Comet ML are freemium: generous free tiers, paid plans for teams needing SSO and support.
FAQ
Which experiment tracking tool is best overall in 2027?
Weights & Biases leads for most teams. It integrates with PyTorch, TensorFlow, JAX and Hugging Face Transformers, automatically logs hyperparameters, metrics, checkpoints and GPU or CPU utilization from a few lines of code, and renders loss curves, confusion matrices and parallel coordinates plots in real time. Sweeps automates tuning and Reports turns findings into shareable interactive documents. Choose it for rapid iteration and visual comparison across hundreds of runs.
What is the best open-source experiment tracking option?
MLflow. Its four components cover Tracking for parameters, metrics and artifacts, Projects for reproducible packaging, Models for deployment, and Registry for versioning with stage transitions. It supports PyTorch, TensorFlow, Scikit-learn and Spark MLlib, deploys on-premises or in cloud, and has added native Kubernetes support and federated learning tracking. The Model Registry's staging-to-production promotion makes it particularly strong inside CI/CD pipelines.
Is the free tier enough for a small team or academic lab?
Usually yes. Weights & Biases offers a free tier with generous log storage and unlimited team members. Comet ML's free tier includes storage and unlimited public projects. Neptune.ai's free tier includes storage but limits team seats. For dozens of experiments per week, tracking cost is negligible. Costs become material at hundreds or thousands of runs per day, typical during sweeps or architecture search.
Which tool is best for collaboration across a distributed team?
Neptune.ai. It is built as a metadata store for MLOps teams, with role-based access control, shared workspaces, comment threads on runs, and real-time annotation resembling Google Docs. Custom dashboards combine charts, tables and markdown notes, which suits executive summaries. More broadly, cloud-native tools beat self-hosted ones for remote work: one URL, no VPN configuration, and a polished UI for non-technical reviewers.
How should tracking connect to a CI/CD pipeline?
Logging should start automatically on every training run, whether triggered by a git push, a scheduled job or a manual launch, with hyperparameters injected via environment variables and system metrics captured without extra instrumentation. The critical hook is the model registry: promoting a run should tag version metadata, link the exact commit and dataset version, and trigger validation, containerization or deployment through webhooks or native CI integrations.
What should you budget for self-hosted tracking?
Costs shift from per-run fees to infrastructure. Provision compute for the tracking server, a database such as PostgreSQL or a time-series store, S3-compatible object storage for artifacts, and network bandwidth. This is often cheaper at scale but requires upfront setup and ongoing maintenance. The usual trap is underestimating database write load: fifty parallel experiments logging every few seconds can force horizontal scaling or caching.
Which tools handle pipeline orchestration alongside tracking?
ClearML combines tracking, data management and pipeline orchestration, defining DAGs for preprocessing, training and evaluation, with model deployment to Kubernetes or AWS SageMaker. Kubeflow Pipelines is purpose-built for Kubernetes-native ML pipelines with a workflow design UI. Polyaxon runs experiments and pipelines on Kubernetes from YAML configuration files, adding distributed training via PyTorch DDP and Horovod plus model serving through KServe.
Does any tool monitor models after deployment?
Comet ML has introduced drift detection for monitoring model performance in production, alongside automatic experiment grouping by task. Most tracking tools stop at the registry boundary, handing off to dedicated observability systems. When evaluating, check whether production monitoring is native or requires a second vendor, because the handoff between training metadata and serving telemetry is where reproducibility investigations most often stall.
How do you keep artifact storage costs under control?
Set retention policies early. Some tools now support automatic garbage collection of old artifacts based on those policies, which matters in cloud environments where every checkpoint accrues charges. Distinguish artifacts worth keeping forever, such as registered production models, from disposable sweep checkpoints. Note that some vendors offer unlimited runs on higher tiers while capping storage per gigabyte, so estimate average artifact size before committing.
What disqualifies a tracking tool from serious consideration?
Two things. Requiring proprietary hardware locks your experiment history to a vendor's silicon, and no public API means you cannot script exports, migrations or CI integration. Beyond that, watch for stalled release cadence and an absent user community, both signals that framework support will lag behind PyTorch and JAX releases. A tracker you cannot query programmatically is a dashboard, not infrastructure.
Sources
- https://mlflow.org/docs/latest/index.html
- https://docs.wandb.ai/
- https://docs.neptune.ai/
- https://www.comet.com/docs/v2/
- https://clear.ml/docs/latest/docs/
- https://www.kubeflow.org/docs/components/pipelines/
- https://polyaxon.com/docs/
- https://github.com/mlflow/mlflow
- https://kserve.github.io/website/
- https://argoproj.github.io/workflows/
Related on PULSE
This page will be disappearing soon. Save it to your device for $1 — or read it free while it is here.
@Kory-White- · if Venmo asks, the last 4 of my number are 2012
This page is gone.
This one is off the shelf now. $1 keeps it on your phone for good — the whole page, pictures and diagrams included.
 aiThe 10 Best AI Model Registries in 2027
 aiThe 10 Best AI Tools for Blog Writing for Websites in 2027
 aiThe 10 Best Kubernetes Distributions for AI Workloads in 2027
 aiThe 10 Best MLOps Platforms for Model Management in 2027
 aiThe 10 Best AI Data Version Control Systems in 2027
 aiThe 10 Best AI Inference Chips for On-Premise in 2027
 aiThe 10 Best AI Tools for Color Contrast Checking in 2027
 aiThe 10 Best AI Security Platforms for Protecting Models in 2027
 aiWhat should you know before investing in AI Infra in 2027?
 aiThe 10 Best AI Tools for Web Caching in 2027