
“Show up. Follow up. Close.” — Quote Card
 Curated byKory White · Fractional CRO · Maryland
 PULSEKNOWLEDGE LIBRARY
Quality
Certified
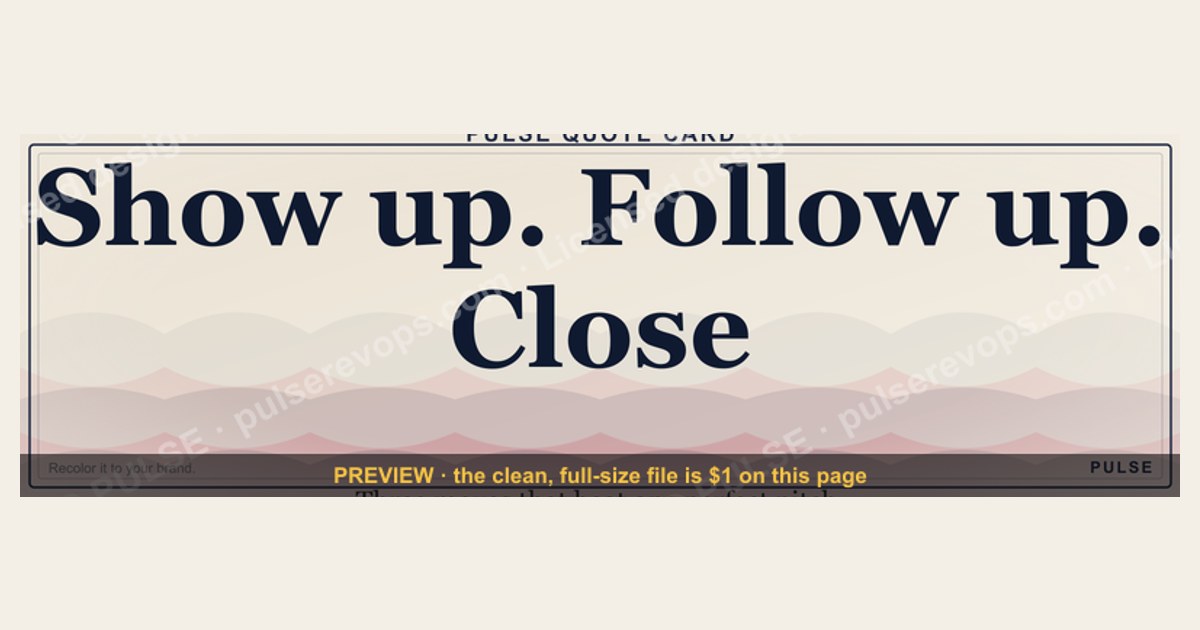
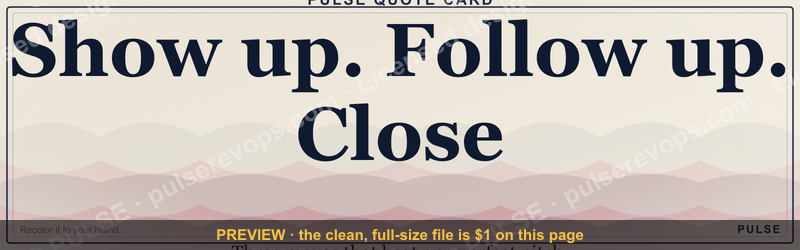
This is a downloadable quote card — a 1600x500 px PNG banner that reads "Show up. Follow up. Close." in bold type on a clean background, built for sales and RevOps teams. It states the three habits that decide most deals: Show up on time, Follow through consistently, Close the loop every time.
The scenario: a quarter lost to three broken habits
Picture a ten-person sales team that finished Q1 at 71% of quota. Nothing dramatic happened. No competitor undercut them, no product gap opened up, no pricing shock hit the market. When the manager pulled the activity data, the pattern was almost embarrassing in its simplicity.
Reps were Showing up to first calls — discovery attendance ran near 96%. Then the second touch fell off a cliff. Of 240 qualified opportunities created in the quarter, only 138 received a second documented contact within seven days. Of those 138, roughly 60% got a third touch. By the fifth touch, the number was down to about 40 opportunities. The funnel didn't leak at the top; it leaked in the middle, in the gap between showing up once and following up repeatedly.
The closing motion had its own failure mode. Deals that reached verbal agreement sat untouched for an average of nine days before anyone sent paperwork. In that window, three of the largest opportunities went dark entirely — not lost to a competitor, just lost to silence. The buyer's internal champion moved on, the budget cycle rolled over, and the deal evaporated.

This is the exact problem the quote card addresses. It is not a motivational poster about hustle. It is a compressed process reminder: the three sequential behaviors that, when any one breaks, kill deals that were otherwise winnable. The card exists because teams forget the middle step most often, and the middle step is where the majority of revenue quietly dies.
The scenario also explains why a static graphic helps at all. Sales teams do not lack information about follow-up best practices. They lack a persistent, low-friction reminder sitting in the place they look every day — the top of a dashboard, a Slack channel header, a printed card taped to a monitor. A quote card works because it is ambient, not because it is novel.
How the mechanism actually works
The slogan maps to three distinct funnel stages, each with its own failure mode, its own leading indicator, and its own fix. Treating them as one blob is why most coaching on this topic fails.

Show governs the top of funnel: attendance, punctuality, preparation, and the decision to actually take the meeting rather than reschedule it a third time. The leading indicator is meeting-held rate — meetings that occur divided by meetings booked. Healthy teams run 80-90%. Teams below 70% have a scheduling or qualification problem, not a motivation problem.
Follow governs the middle: the cadence of touches after the first conversation. The leading indicator is touches-per-opportunity within the first 14 days. The failure mode is the "one and done" rep who logs a great discovery call and then waits for the buyer to respond.
Close governs the end: the speed and completeness of the paperwork, signature, and handoff motion. The leading indicator is days-from-verbal-to-signed. Every day of delay adds measurable slippage risk.

The three stages are sequential but not independent. Weak Follow behavior makes Close harder because the buyer's urgency decays. Weak Show behavior makes Follow pointless because you never built enough context to follow up on. The card puts all three in one line precisely because they compound.
The diagram makes the compounding visible. A deal can fail at any of five checkpoints, and the quote card is a shorthand for the three behavioral clusters that govern them. Notice that only one of the five checkpoints is about persuasion. The other four are about process discipline. That ratio is the whole point.
There is a second mechanism worth naming: the card works as a shared vocabulary. When a manager says "your Follow is thin this week," the rep knows exactly which metric to look at. Shared language shortens coaching conversations and makes them less personal. The card is a coordination device as much as a reminder.

Real numbers, ranges, and benchmarks
The numbers below are the ranges practitioners typically see when they instrument these three behaviors. They are not universal constants — team size, deal size, and sales cycle length all shift them — but they are useful sanity checks.
Show metrics. Meeting-held rate for inbound-sourced meetings typically lands between 75% and 90%. For outbound-sourced meetings, expect 60% to 80%, because outbound buyers are less committed at booking. No-show rates above 25% usually indicate a qualification problem rather than a reminder problem. Punctuality matters less than people think, but starting more than five minutes late correlates with shorter meetings and lower next-step commitment rates.
Follow metrics. The classic finding in sales research is that most reps give up after one or two attempts while most deals require five to eight touches. In practice, teams that instrument this see touches-per-opportunity in the first 14 days clustering around 1.8 for underperformers and 3.5 to 4.5 for top quartile. The gap between those two numbers is usually worth more than any messaging improvement. Response rates decay sharply: a second touch might get a 20-30% reply rate, a fifth touch might get 8-12%, but the fifth touch is still net-positive because the denominator is smaller.

Close metrics. Days-from-verbal-to-signed varies enormously by contract complexity. Simple SMB agreements: 2-5 days. Mid-market with legal review: 7-21 days. Enterprise with procurement: 30-90 days. The actionable benchmark is not the absolute number but the variance — if your average is 14 days but your standard deviation is 20 days, you have a process problem, not a speed problem. Deals that sit more than 10 days past verbal without a documented next step slip at roughly double the rate of deals that move within 48 hours.
Composite view. A team that improves meeting-held rate by 10 points, touches-per-opportunity by 1.5, and verbal-to-signed time by 30% will typically see win-rate improvement in the 8-15 point range without changing headcount, territory, or pricing. That is the arithmetic case for treating this card as an operational tool rather than decoration.
Where the numbers break down. Very long enterprise cycles compress the relevance of 14-day touch windows. High-velocity transactional sales compress the relevance of 48-hour close windows because everything happens in one call. Adjust the thresholds to your cycle, but keep the three-stage structure.
Trade-offs and alternatives
The quote card is not the right tool for every team, and pretending otherwise is how you end up with a laminated slogan nobody reads.
Trade-off one: simplicity versus specificity. "Show up. Follow up. Close." is memorable precisely because it is vague. The moment you add thresholds and definitions, it stops being a card and becomes a one-pager. The card is the hook; the one-pager is the operating manual. Use both, but do not try to make the card do the manual's job.

Trade-off two: motivation versus measurement. Some teams respond to slogans; others find them patronizing. If your team is already disciplined and the problem is pipeline volume, the card adds nothing. If your team is talented but sloppy on cadence, the card plus a dashboard is a strong combination.
Trade-off three: universal versus role-specific. The three verbs apply cleanly to account executives. They apply less cleanly to SDRs, who mostly Show and Follow but rarely Close. They apply differently to customer success, where the sequence is more like onboard, adopt, renew. Customize the wording for the role or accept that the card is an AE artifact.
Alternatives worth considering. A cadence checklist embedded in the CRM is more enforceable than a card. A weekly pipeline review that explicitly asks "how many touches did this deal get?" is more diagnostic. A close-plan template is more actionable at the end of the cycle. The card's unique value is ambient persistence — it sits in peripheral vision all day. If you already have strong process enforcement, the card is redundant.

The decision tree matters because it prevents the most common mistake: deploying a card against a problem it cannot solve. A card cannot fix a territory with no leads. It can fix a territory with plenty of leads and inconsistent follow-through.
Common pitfalls and how to avoid them
Pitfall one: treating the card as a substitute for process. Printing the card and doing nothing else produces zero behavior change. Pair it with a metric the team can see weekly. The card reminds; the metric enforces.
Pitfall two: over-defining the verbs. If you turn the card into a twelve-page playbook, nobody reads either one. Keep the card at three words. Put the definitions in the CRM where they belong.
Pitfall three: using it as a performance-management weapon. The moment "your Follow is weak" becomes a written warning, reps stop trusting the shared vocabulary. Keep the card as a coaching frame, not a disciplinary tool.
Pitfall four: ignoring the middle verb. Teams over-index on Show because it is easy to measure and on Close because it is exciting. Follow is the boring middle that actually moves win rates. If you only fix one thing, fix the middle.
Pitfall five: letting the card age. A card posted in January and never mentioned again is invisible by March. Reference it in pipeline reviews, tie it to real deals, and refresh the visual every couple of quarters.

Pitfall six: applying it to the wrong role. As noted above, the three verbs fit quota-carrying closers best. For SDRs, consider a two-verb variant. For CS, consider a different sequence entirely.
Pitfall seven: measuring touches without measuring quality. A rep can hit four touches by sending four generic check-ins. Touch count is a necessary but not sufficient metric. Pair it with reply rate or meeting-booked rate so volume does not mask low relevance.
Pitfall eight: assuming the buyer experiences your cadence the way you do. From the buyer's side, five touches in ten days can feel like pressure. Space touches according to deal stage and buyer signal, not according to a rep's anxiety level. The card says Follow, not "follow relentlessly."
Related questions
What does the quote card actually say?
It reads "Show up. Follow up. Close." in bold type on a clean background, sized at 1600x500 px as a downloadable PNG. The three phrases map to the three sequential behaviors that govern most sales cycles.
Who is this quote card for?
Account executives, sales managers, and RevOps teams who want an ambient reminder of cadence discipline. It fits best on teams that already have leads and pipeline but inconsistent follow-through.
Can I customize the wording?
Yes. The card is a template. Teams commonly swap in role-specific verbs — for example, "Book. Brief. Bridge." for SDRs — or add a team name and quarter. Keep it to three short phrases so it stays readable at banner size.
Is this a motivational poster?
No. It is an operational reminder. The value comes from pairing it with a metric the team reviews weekly, not from inspiration. Used alone, it changes nothing.
Where should I put it?
Dashboard headers, Slack or Teams channel banners, printed cards at desks, and the top of a pipeline review deck are the four highest-visibility placements. Pick one primary location so it does not become wallpaper.
FAQ
What exactly is this quote card? It is a downloadable 1600x500 px PNG banner that reads "Show up. Follow up. Close." in bold type. It is designed as an ambient reminder for sales teams, sized to fit dashboard headers, channel banners, and printed desk cards without cropping.
Why these three verbs and not something more specific? Because specificity is what makes slogans forgettable. Three short verbs fit in peripheral vision and survive repetition. The detailed definitions — touch counts, time windows, thresholds — belong in your CRM and your playbook, not on the card.
How do I measure whether the card is working? Pick one metric per verb. Meeting-held rate for Show, touches-per-opportunity in the first 14 days for Follow, and days-from-verbal-to-signed for Close. Review all three monthly. If none move in 90 days, the card is not your bottleneck.
Can I use this for a team that is not in sales? Partly. The structure — show up, follow through, finish — generalizes to recruiting, customer success, and project delivery. The specific metrics do not. Rewrite the verbs for the role and pick metrics that fit that role's cycle.
Does the card replace a cadence playbook? No. The card is the reminder; the playbook is the instruction. Teams that try to compress the playbook into the card end up with a card nobody reads and a playbook nobody wrote. Keep them separate.
What if my team finds it cheesy? Then skip the card and instrument the metrics instead. The card is one delivery mechanism for a set of behaviors, not the behaviors themselves. A team that tracks touches-per-opportunity weekly does not need a banner to remember the middle verb.
Sources
- HubSpot Sales Statistics
- Salesforce State of Sales Report
- Gartner Sales Research
- Harvard Business Review: The End of Solution Sales
- McKinsey: The New Face of Sales
- CSO Insights / Korn Ferry Sales Research
- Sales Enablement Collective Resources
Related on PULSE
- Sales cadence design: how many touches is too many
- Meeting-held rate: the metric most teams ignore
- Days-from-verbal-to-signed: diagnosing close-process slippage
- Coaching the middle of the funnel without micromanaging
- Building a one-page sales playbook your team will actually use
This page will be disappearing soon. Save it to your device for $1 — or read it free while it is here.
@Kory-White- · if Venmo asks, the last 4 of my number are 2012
This page is gone.
This one is off the shelf now. $1 keeps it on your phone for good — the whole page, pictures and diagrams included.
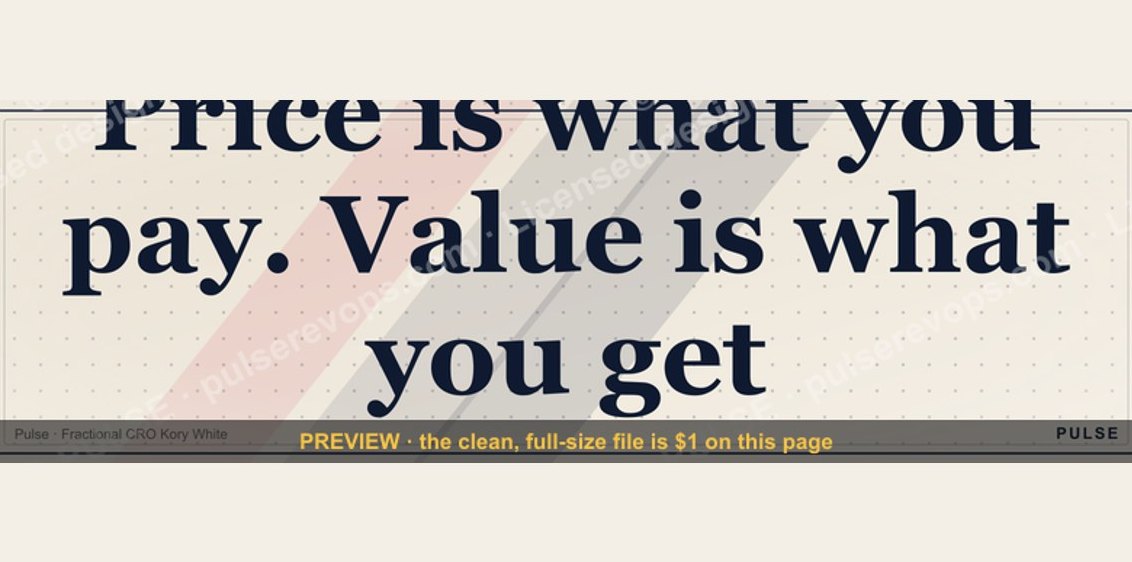 graphic“Price is what you pay. Value is what you get.” — Quote Card
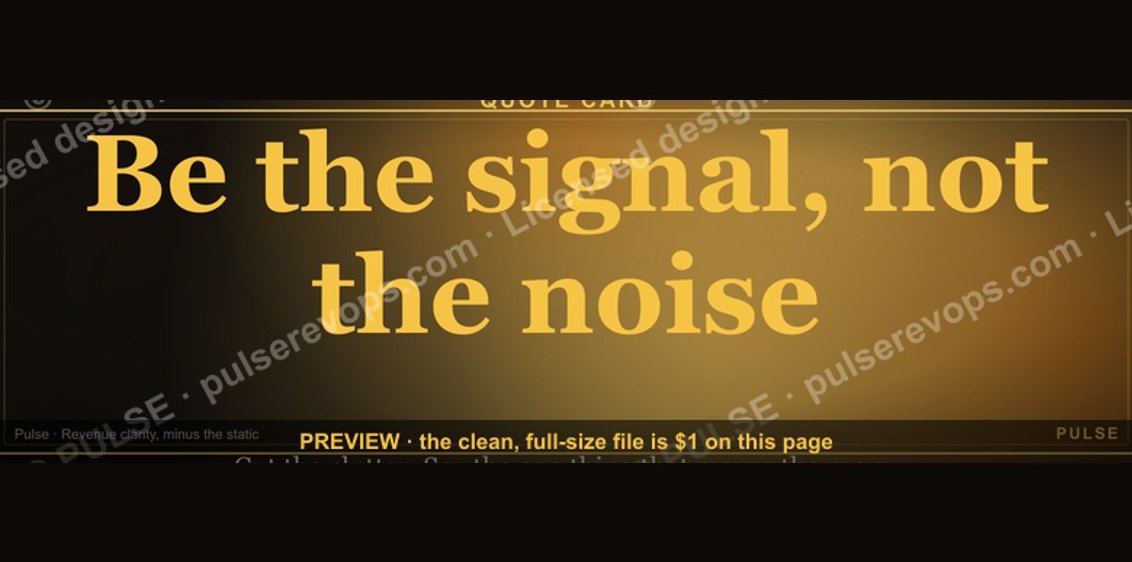 graphic“Be the signal, not the noise.” — Quote Card
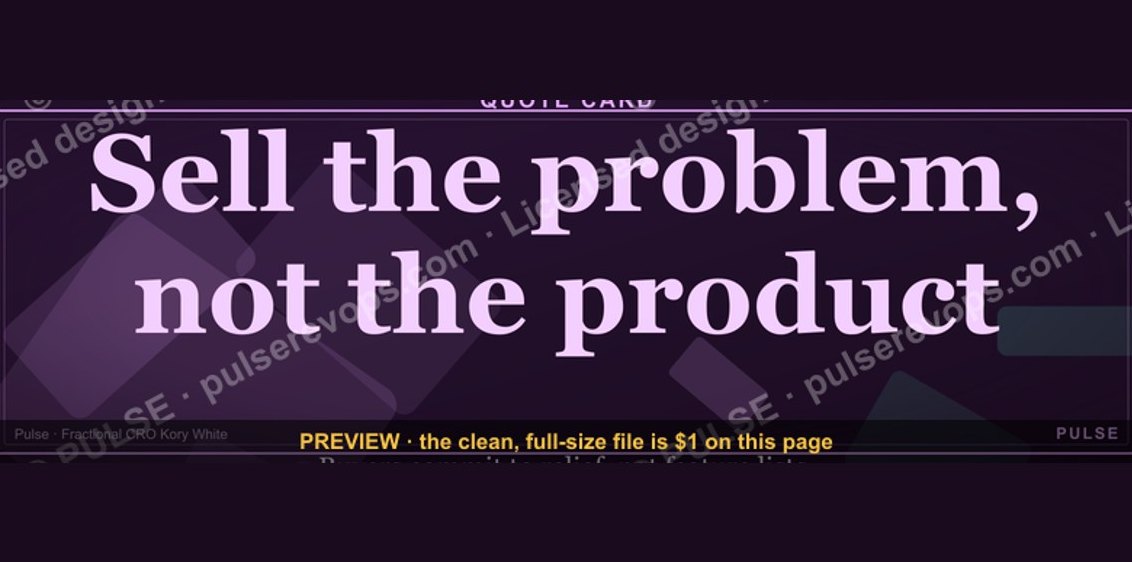 graphic“Sell the problem, not the product.” — Quote Card
 graphic“Pipeline Cures All” — Quote Card
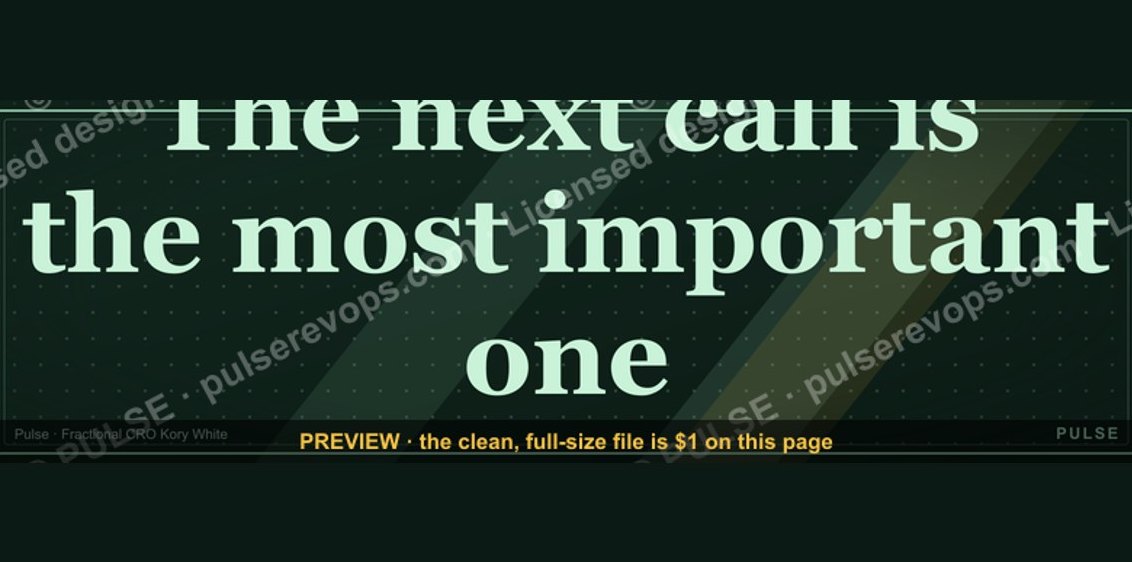 graphic“The next call is the most important one.” — Quote Card
 graphic“Qualify hard. Close easy.” — Quote Card
 graphic“Pressure off. Pipeline on.” — Quote Card
 graphic“Hire slow. Ramp fast.” — Quote Card
 graphic“Trust compounds. So does pipeline.” — Quote Card
 graphic“Don't pitch. Diagnose.” — Quote Card