
“ACTIVITY PIPELINE REVENUE” — Sales Floor Print
 Curated byKory White · Fractional CRO · Maryland
 PULSEKNOWLEDGE LIBRARY
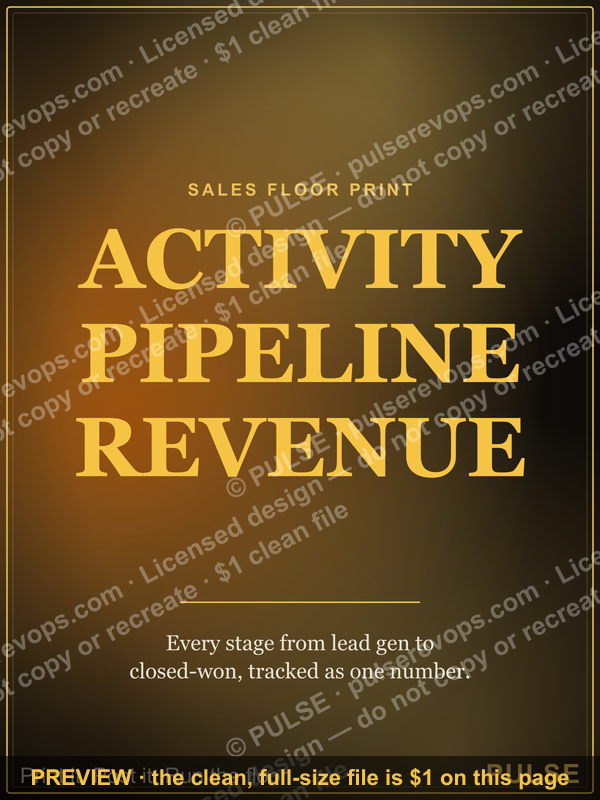
"Activity Pipeline Revenue" on a Sales Floor Print typically refers to the projected or actual revenue generated from sales activities within a defined pipeline, such as leads, opportunities, or deals in progress. This metric aggregates the total value of all active sales stages, often ranging from early-stage prospects to closed-won deals, and is used to forecast near-term revenue. The specific figure depends on your CRM or sales tracking system, and it may be calculated based on weighted probabilities or raw totals.
“ACTIVITY PIPELINE REVENUE” — Sales Floor Print

A bold printable poster — "ACTIVITY PIPELINE REVENUE" stacked in the Pulse accent gradient. Print it for the sales floor or your home office to keep energy up.
Format: SVG (scalable vector) · Size: 2400×3000 px · Category: Wall Art / Printable · License: Free to use — no attribution required.
Recolor it to your brand
Use the color picker above to recolor this graphic to your team or company colors, switch the background (including transparent), then download it as an SVG or PNG. No sign-up, no watermark.
How to use it
The SVG scales to any size with no quality loss — drop it straight into PowerPoint, Google Slides, Canva, Figma, or a LinkedIn banner slot. The PNG export is ready to upload anywhere that wants a raster image.

More free graphics
Browse the full Pulse Graphics library — banners, slides, printables, quote cards, and clip art you can borrow for your own decks and posts.
Related on PULSE
- Activity to Revenue — Motivational Print
- Activity. Pipeline. Revenue. — LinkedIn Wallpaper
- “Activity creates luck.” — Quote Card
- "Activity creates luck." — LinkedIn Banner
- “Activity creates luck.” — LinkedIn Banner
- “MORE PIPELINE LESS PANIC” — Sales Floor Print
How to Calculate and Validate Activity Pipeline Revenue
Activity pipeline revenue differs from traditional pipeline metrics because it ties directly to specific sales activities rather than just deal stages. To calculate it effectively, you need to track three core components: activity volume, conversion rates, and average deal size.
Start by identifying the key sales activities that drive pipeline progression. Common examples include qualified discovery calls, product demos, proposal submissions, and follow-up touchpoints. For each activity, track historical conversion rates over at least a 3-6 month period to establish reliable baselines. A reasonable conversion range might be: discovery call to demo (20-40%), demo to proposal (30-50%), proposal to closed-won (25-45%), depending on your industry and sales complexity.
The formula is straightforward: Activity Pipeline Revenue = (Number of Activities Completed × Conversion Rate to Next Stage) × Average Deal Size. For instance, if your team completes 50 demos per month with a 35% conversion rate to proposal and an average deal size of $25,000, the activity pipeline revenue from demos would be 50 × 0.35 × $25,000 = $437,500.
Validation is critical. Cross-reference your activity pipeline revenue against actual closed revenue for the same period. A healthy ratio typically falls between 3:1 and 5:1 (pipeline value to closed revenue). If your ratio is lower than 3:1, you may need to increase activity volume. If higher than 8:1, your conversion assumptions might be too optimistic or your team may be generating low-quality pipeline.
Use a rolling 90-day window for validation. Track actual activities completed each week, apply your conversion rates, and compare the resulting pipeline value to what actually closed 60-90 days later. Adjust conversion rates quarterly based on actual performance. Many sales teams find that activity-based forecasting is 15-25% more accurate than stage-based forecasting alone, because activities are more controllable and measurable than subjective stage progression.
Common Pitfalls and How to Avoid Them
Activity pipeline revenue is powerful, but several common mistakes can undermine its accuracy and usefulness. Understanding these pitfalls will help you maintain a reliable metric.
Pitfall 1: Treating All Activities as Equal. Not all discovery calls or demos are created equal. A demo with a decision-maker who has budget authority is worth significantly more than one with a low-level influencer. To avoid this, weight activities by buyer persona and engagement quality. For example, assign a 1.0 weight to C-level demo participants, 0.7 to director-level, and 0.4 to individual contributors. Multiply your activity count by these weights before applying conversion rates.
Pitfall 2: Ignoring Activity Recency. An activity completed 90 days ago has less predictive power than one from last week. Pipeline value decays over time. Implement a time-decay factor: activities older than 30 days might be discounted by 20%, those 30-60 days old by 40%, and anything over 90 days by 60% or removed entirely. This prevents stale activities from inflating your pipeline.
Pitfall 3: Confusing Activity Volume with Pipeline Health. A high volume of low-quality activities can create a false sense of pipeline strength. For instance, 200 cold calls that generate 5 qualified opportunities is less valuable than 50 targeted outreach calls that generate 15 opportunities. Track activity-to-opportunity conversion rates separately. If your conversion rate drops below 10% for any activity type, investigate the root cause rather than just increasing volume.
Pitfall 4: Failing to Account for Sales Cycle Velocity. Activity pipeline revenue assumes activities lead to deals within a predictable timeframe. If your average sales cycle is 90 days but you’re only tracking 30 days of activity data, your pipeline will appear artificially low. Align your activity tracking window to at least match your average sales cycle length. For longer cycles, use a weighted pipeline model that accounts for the probability of closing within the current quarter versus future quarters.
Pitfall 5: Over-Reliance on Historical Conversion Rates. Past performance doesn’t guarantee future results, especially during market shifts, product changes, or team turnover. Recalculate conversion rates monthly based on a rolling 3-month average. If you see a 20% or greater deviation from your baseline, investigate and adjust your assumptions before relying on the metric for forecasting.
To catch these issues early, set up a simple dashboard that tracks actual activity pipeline revenue versus forecasted revenue on a weekly basis. Any variance greater than 15% should trigger a review of activity quality, conversion assumptions, or sales cycle dynamics. This proactive monitoring prevents pipeline surprises and keeps your revenue projections grounded in real activity data.
Integrating Activity Pipeline Revenue into Your Sales Process
Making activity pipeline revenue a practical, daily tool requires more than just a calculation—it needs to be embedded into your team’s workflow and decision-making. Here’s how to operationalize it effectively.
For Sales Reps: Replace vague pipeline reviews with activity-based coaching. Instead of asking “What’s your pipeline look like?” ask “How many qualified demos did you complete this week, and what’s the expected revenue from those activities?” Reps should track their own activity-to-pipeline conversion rates and use them to prioritize their daily efforts. For example, if a rep knows that 10 discovery calls typically generate 3 qualified opportunities worth $90,000 in pipeline, they can set a daily activity target of 10 calls to maintain a healthy pipeline. This shifts focus from passive pipeline management to active pipeline generation.
For Sales Managers: Use activity pipeline revenue to diagnose team performance. If two reps have similar activity volumes but vastly different pipeline values, the issue likely lies in activity quality or conversion skills. Create a weekly “activity efficiency” metric: pipeline revenue generated per activity completed. A healthy range might be $500-$2,000 per activity for B2B SaaS, depending on deal size and complexity. Reps below this range need coaching on targeting, messaging, or qualification. Those above may be neglecting high-volume activities that build long-term pipeline health.
For Forecasting: Build a two-tier forecasting model. Tier 1 uses stage-based pipeline (deals in your CRM) for short-term forecasts (0-30 days). Tier 2 uses activity pipeline revenue for medium-term forecasts (30-90 days). Compare the two: if activity pipeline revenue is significantly higher than stage-based pipeline, you likely have deals that haven’t been properly staged or activities that will convert soon. If it’s lower, your team may be under-investing in pipeline generation. The gap between these two metrics should be no more than 20-30% for a healthy sales process.
For Compensation and Incentives: Consider adding an activity pipeline revenue component to variable compensation. For example, 10-15% of a rep’s commission could be tied to meeting weekly activity pipeline targets, not just closed deals. This encourages consistent pipeline building and reduces end-of-quarter panic. However, be careful not to incentivize activity volume over quality—always pair activity targets with minimum conversion rate thresholds.
For CRM and Reporting: Set up automated activity pipeline revenue reports in your CRM. Most modern CRMs (Salesforce, HubSpot, Pipedrive) allow custom fields and formulas to calculate this. Create a pipeline health score that combines activity volume, conversion rates, and pipeline value. A score below 70 out of 100 should trigger a pipeline generation blitz. Review this score in weekly sales meetings and use it to allocate resources—for example, if the score drops, shift marketing spend toward lead generation or have SDRs increase outreach volume.
The ultimate goal is to make activity pipeline revenue a leading indicator that your team acts on daily, not a lagging report they review monthly. When reps can see the direct link between today’s activities and next quarter’s revenue, they become more intentional, efficient, and consistent in their pipeline building efforts.
Sources
- Salesforce — official documentation on activity pipeline revenue metrics and reporting
- Harvard Business Review — articles on sales pipeline management and revenue forecasting
- Gartner — research reports on sales performance metrics and pipeline analysis
- Forrester Research — industry analysis of sales pipeline strategies and revenue attribution
- American Marketing Association — resources on sales funnel and revenue measurement frameworks
- Investopedia — explanations of revenue pipeline concepts and financial metrics
FAQ
What exactly does “Activity Pipeline Revenue” mean on this sales floor print? It’s a visual metric that ties sales activities (calls, meetings, demos) to the value of deals in your pipeline and the revenue they’re expected to generate. The print helps teams see at a glance how daily actions are influencing overall revenue targets, typically used in sales huddles or war rooms.
How often should we update the numbers on this board? Most teams update it weekly or after each major sales cycle review, though some high-velocity teams refresh it daily. The key is consistency—choose a cadence that matches your sales process so the data stays actionable without becoming overwhelming.
Can this board track both individual rep performance and team pipeline? Yes, it’s designed to show both: individual activity metrics (like calls per rep) alongside the aggregate pipeline value and revenue projections. This lets managers spot coaching opportunities while keeping the whole team focused on the shared revenue goal.
What’s the typical range for pipeline coverage ratio shown on this print? Healthy pipeline coverage usually falls between 3x and 5x your revenue target, though it varies by industry and deal cycle length. The board often highlights this ratio to flag if you’re underinvesting in top-of-funnel activities.
Does this board replace a CRM or is it a supplement? It’s a supplement—a visual, at-a-glance snapshot that complements your CRM’s deeper data. The print is meant for quick team alignment and motivation, not for storing detailed records, so you’ll still rely on your CRM for historical analysis and forecasting.
How do we prevent the board from becoming outdated or ignored? Assign a rotating “board champion” to update it before each team meeting and discuss the numbers for 5–10 minutes. If it’s not referenced in weekly stand-ups, it loses its purpose—so make it a living tool, not just decoration.
This page will be disappearing soon. Save it to your device for $1 — or read it free while it is here.
@Kory-White- · if Venmo asks, the last 4 of my number are 2012
This page is gone.
This one is off the shelf now. $1 keeps it on your phone for good — the whole page, pictures and diagrams included.
 graphic“PROGRESS EVERY DEAL” — Sales Floor Print
 graphic“TRUST THE PROCESS” — Sales Floor Print
 graphic“ONE TEAM ONE NUMBER” — Sales Floor Print
 graphic“EARN THE RIGHT” — Sales Floor Print
 graphic“NEXT CALL WINS” — Sales Floor Print
 graphic“BRING THE ENERGY” — Sales Floor Print
 graphic“Always Be Closing” — Sales Floor Poster
 graphic“MAKE THE CALLS” — Sales Floor Print
 graphic“OWN THE NUMBER” — Sales Floor Print
 graphic“QUOTA IS A FLOOR” — Sales Floor Print