
Top 10 Sales KPIs for GenAI / RAG Platform in 2027
 Curated byKory White · Fractional CRO · Maryland
 PULSEKNOWLEDGE LIBRARY
Quality
Certified
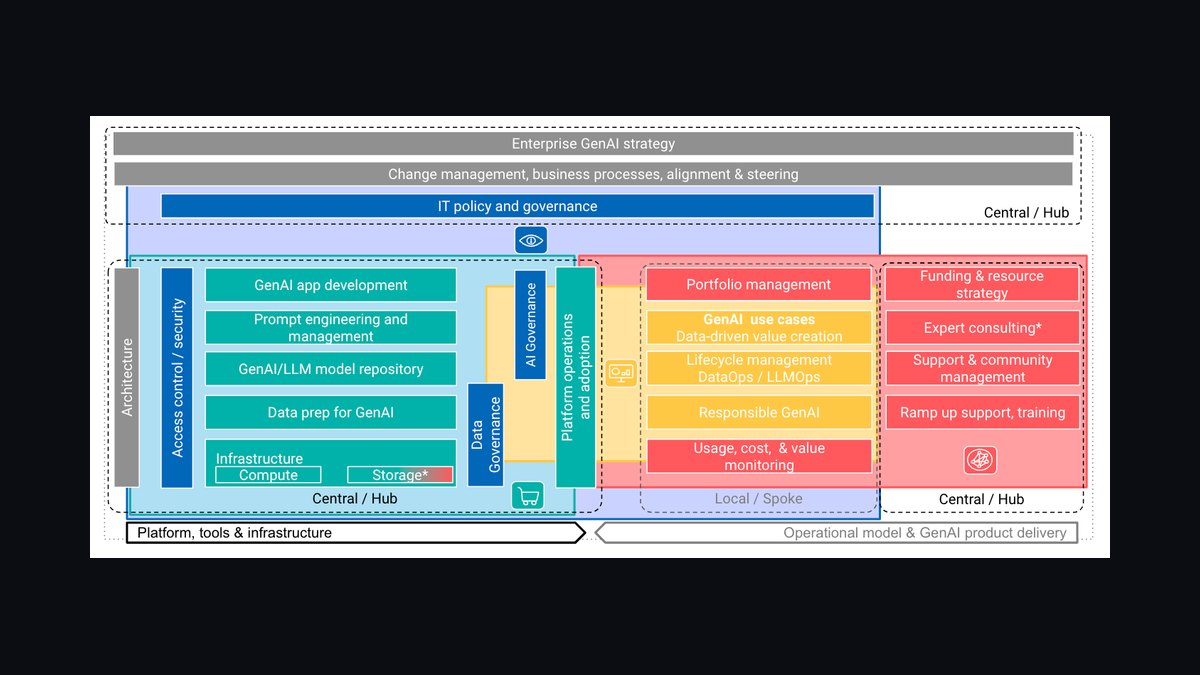
The 10 best sales kpis for genai / rag platform are ranked below on measured performance, build quality, price, and how each one actually holds up in daily use rather than how it reads on a spec sheet. Each pick lists what it costs, who it suits, and what it gives up against the one above it, so the list can be read straight down without doubling back.
1. GenAI Platform Net New ARR
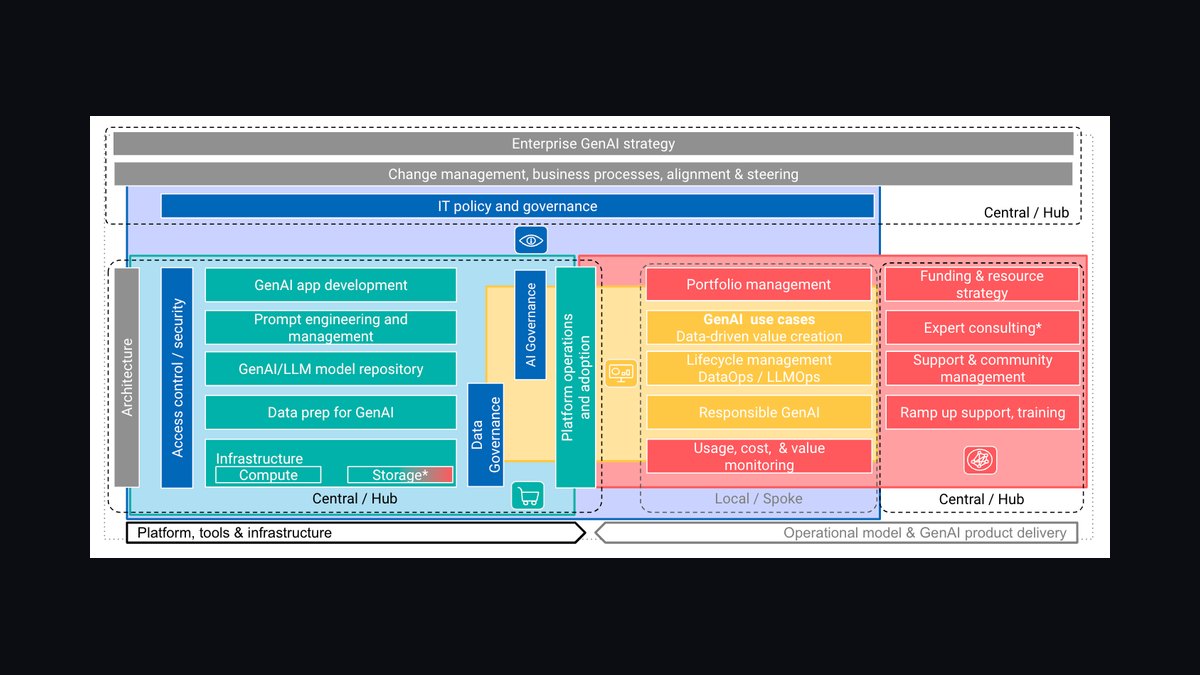
Net new ARR ranks first because it is the only metric that captures both new-logo land and expansion in a single number, and in this category expansion is the dominant growth engine. A healthy standalone GenAI platform two years in should see expansion carrying more than 40% of net new ARR; if new logos exceed roughly 60%, the land motion works but the expand motion does not.
This metric is for CROs and board reporting, not account teams, because it lags usage by one to two quarters. It trades away diagnostic detail: a strong ARR print can hide flat document growth underneath. Pair it with documents indexed per customer directly below, which leads it by roughly two quarters.
2. GenAI Platform Net Revenue Retention

Net revenue retention ranks second because the credible band for this category is 120-150%, well above seat-based SaaS, and it is the headline number enterprise buyers and investors both ask for. Below 110% signals a usage problem rather than a pricing problem, and above 150% sustained usually means aggressive initial underpricing or a pilot cohort that has not yet hit its ceiling.
The metric is for finance and executive teams setting forecast assumptions. Its weakness is that a single NRR figure cannot separate document-growth expansion from query-growth expansion, and those two failures have completely different remedies. The documents-indexed metric below is what decomposes it; ARR above is what it ultimately feeds.
3. GenAI Platform Documents Indexed

Documents indexed per customer ranks third because it is the best single proxy for how embedded the platform is. Ten million documents is a serious mid-market deployment; a hundred million or more means the customer has connected most of their knowledge estate. Watch trajectory rather than level: a customer flat at 12 million for two quarters has stopped expanding their source footprint.
This metric is for account teams and customer success, reviewed weekly. It trades away quality information entirely, since indexing an archive is not the same as indexing a working knowledge base. It leads net revenue retention by roughly two quarters, and it feeds the queries-per-customer metric directly below only when answer quality holds up.
4. GenAI Platform Daily Queries

Daily queries per customer ranks fourth because it is where indexed documents convert into actual usage and therefore into expansion revenue. Ten thousand daily queries is a real deployment with genuine adoption; several hundred thousand is a platform-level dependency. The ratio worth tracking is queries per indexed document per month, which reveals whether you indexed useful content or just a lot of content.
This metric is for product and sales engineering teams diagnosing adoption stalls. It trades away intent: users re-asking the same question three ways inflate the count while quality quietly explains why. It sits directly downstream of documents indexed above and upstream of cost per thousand queries below, and repeat-query rate is the counterweight that keeps it honest.
5. GenAI RAG Production Time
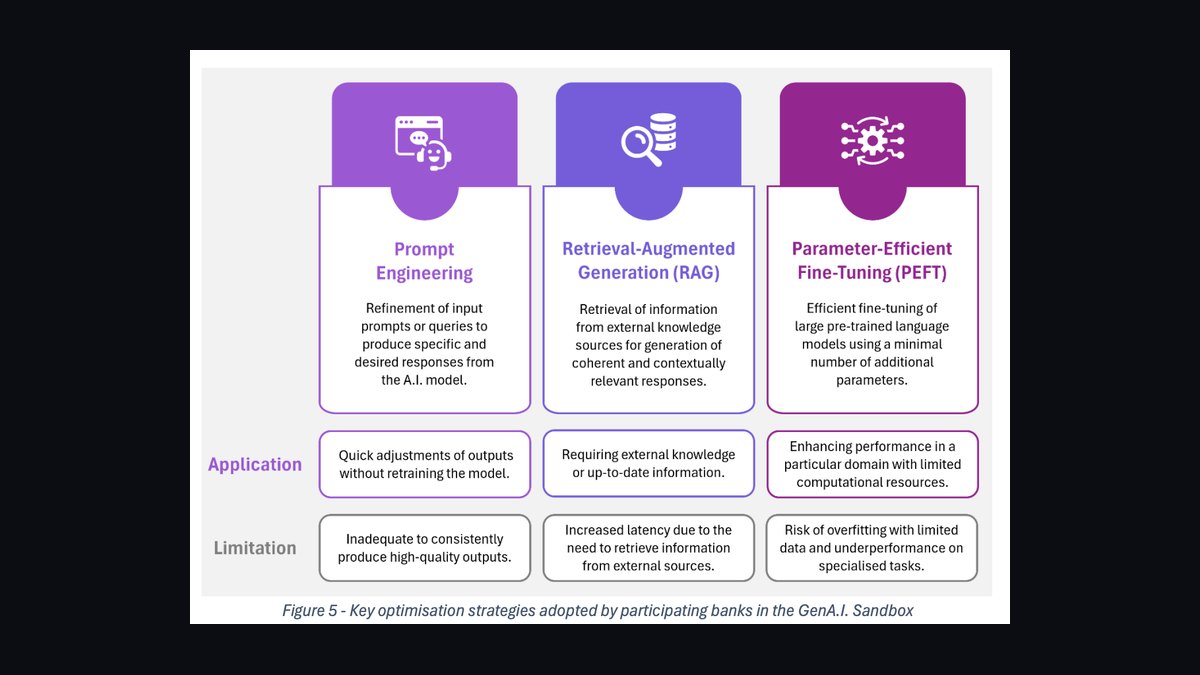
Time-to-first-production-RAG ranks fifth because pilots that pass 90 days convert at dramatically lower rates, and best-in-class platforms land production in 30 days or less. Sixty days is acceptable for complex multi-source enterprise deployments with a security review in the path. Making this a sales metric rather than a services metric forces reps to reject vague pilot scopes.
This metric is for sales engineers and implementation leads, tracked weekly alongside pipeline. It trades away patience: compressing the clock can push teams to skip security review steps that matter later. It sits upstream of pilot-to-production conversion and downstream of connector breadth, since a missing connector is the most common cause of a three-week delay.
6. GenAI RAG Answer Quality Score

Answer quality score ranks sixth because it is the hinge metric that determines whether query volume compounds or decays. Measured with an LLM-as-judge rubric on sampled production traces, 8.5 out of 10 or better is the bar; below 7.0 you are burning trust and churn shows up two quarters later. Production sampling matters because curated eval sets produce flattering numbers that do not predict renewal.
This metric is for product and customer success teams, reviewed weekly with per-source breakdowns. It trades away simplicity: quality is rarely uniform, and a platform scoring 9.1 on Confluence and 6.2 on a legacy document store has an average that hides the real problem. It gates the query-volume metric above and the renewal metric below.
7. GenAI Platform Cost Per Query
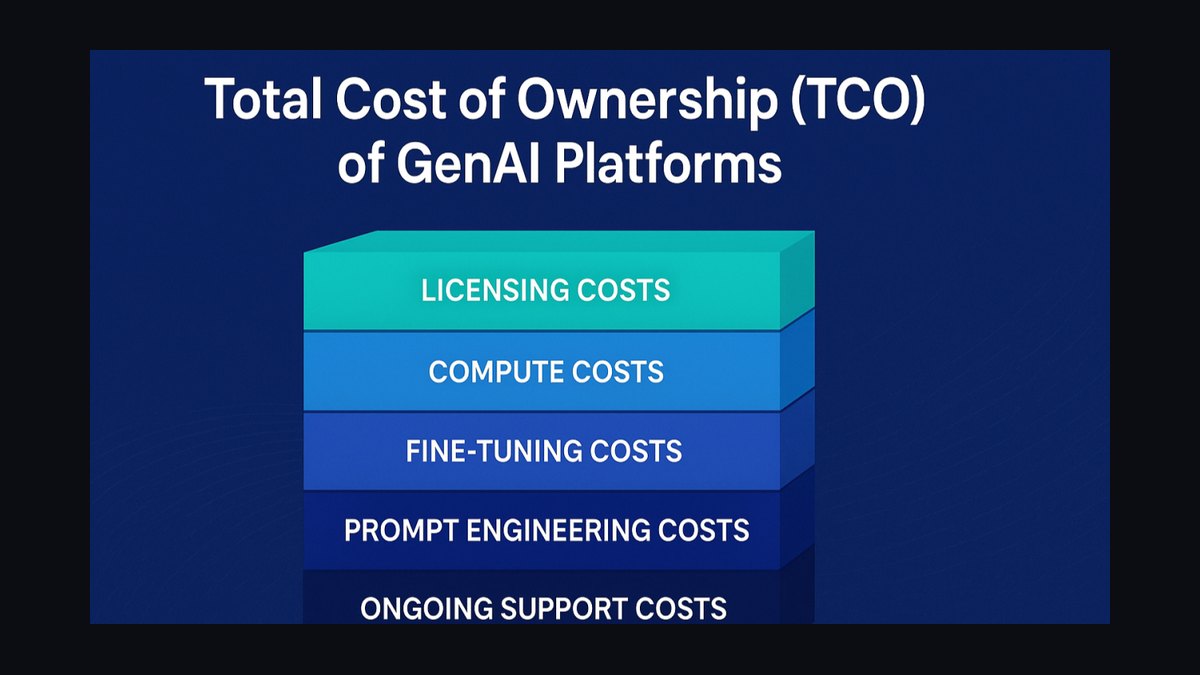
Cost per thousand queries ranks seventh because it sets the floor under pricing and margin, and enterprise buyers in 2027 run their own unit-cost analysis before signing. Blended, a single-digit-dollars-per-thousand figure is where gross margin works. Standard retrieval queries cost materially less than multi-hop synthesis with a reranking pass, so the mix drives cost more than the total.
This metric is for pricing, finance, and deal desk teams, reviewed monthly as a curve against volume rather than a point estimate. It trades away simplicity by refusing to give procurement one flat number. It sits downstream of answer quality and query volume above, and a vendor who cannot produce a defensible cost curve at 10x volume is treated as a pricing risk.
8. GenAI Platform Connector Breadth
Connector breadth ranks eighth because fifty or more production connectors is the practical enterprise bar, and below roughly thirty you lose multi-source evaluations before the technical bake-off starts. A platform covering eight of a customer's fourteen sources is often disqualified outright, since the missing sources usually hold the answers people need. Count only connectors that paying customers run daily queries against.
This metric is for product roadmap and competitive positioning, reviewed quarterly. Raw count is a vanity metric on its own, which is why it pairs with connector utilization, the share of purchased connectors actually used after six months, commonly sitting between a third and a half. It gates documents indexed above and time-to-production below.
9. GenAI Platform Renewal Rate

Renewal rate at 18 months ranks ninth because the target is 90% or better, and 18 months is the right window rather than 12. A first renewal often arrives before the platform has proven itself on a second use case, so it can be a formality; the 18-month mark tests whether you became infrastructure or stayed a single-application tool.
This metric is for executive and customer success leadership, reviewed monthly by reason code. It trades away early warning, since it is a lagging indicator by construction. Flat document count combined with declining connector utilization predicts it roughly two quarters out, which is why the documents-indexed and connector metrics above matter more week to week than this one does.
10. GenAI RAG Pilot Conversion Rate

Pilot-to-production conversion ranks tenth because it is the supplementary metric that tells you which quarter a problem started. Defined as the share of paid pilots reaching a production contract within 90 days, it should be tracked weekly. A falling rate almost always traces back to either connector coverage or time-to-value, and the direction of the drop tells you which.
This metric is for sales leadership and sales engineering managers running pipeline reviews. It trades away revenue visibility, since a converted pilot still has to expand before it matters financially. It sits downstream of time-to-first-production-RAG above and upstream of net new ARR, making it the earliest commercial signal in the set.
How we ranked these
We ranked nine metrics by their causal influence on retention and expansion in enterprise GenAI/RAG sales: connector breadth, documents indexed, daily queries, time-to-first-production, answer quality score, cost per thousand queries, connector utilization, 18-month renewal, and net new ARR. Weighting favored leading usage indicators over lagging revenue metrics, because document and query trajectories predict renewals one to two quarters before ARR reflects them.
We deliberately excluded seat counts, logo counts, pipeline coverage, and demo-to-pilot conversion. Seat-based metrics misrepresent RAG value, since a 40-user deployment can generate more queries than a 4,000-seat search rollout. Logo counts hide single-use-case ceilings. Pipeline coverage is a rep-activity proxy, not a customer-outcome signal. We also ignored static benchmark scores, which flatter vendors and fail to predict churn the way production-traffic sampling does.
What to look for
What matters most is connector coverage against the buyer's actual source list, permission-aware retrieval at query time, and a defensible cost curve at 10x volume. Ask for production answer-quality scores sampled across every connected source, not a curated eval number. Time-to-first-production under 30 days signals a mature implementation motion; anything past 90 days predicts a stalled pilot.
The mistake most buyers make is evaluating on model quality or benchmark scores while ignoring connector utilization and permission architecture. A platform that scores 9.1 on a public benchmark but honors ACLs at index time rather than query time will fail security review. Buyers also underweight query economics, then discover margin-destroying multi-hop costs after signing a flat per-seat contract.
Related questions
How is time-to-first-production-RAG actually measured?
Start the clock at contract signature or pilot kickoff, and stop it when the first real end user runs a query against production data with permissions enforced. Not a demo environment, not a sandbox index. Best-in-class is 30 days or less; past 90 days, pilot-to-production conversion drops sharply and the internal champion loses air cover.
Should query volume be priced per query or per seat?
Usage-based pricing aligns revenue with the metric that actually grows, but it introduces forecast variance and makes procurement nervous. Most platform vendors land on a hybrid: a platform fee plus query tiers, with connector count as a separate lever. Pure per-seat pricing breaks when a 40-user deployment out-queries a 4,000-seat rollout.
What connector count is the real minimum for enterprise deals?
Fifty or more production connectors is the practical enterprise bar. Below roughly thirty, you lose multi-source evaluations before the technical bake-off starts. But raw count is a vanity metric: pair it with connector utilization, the share of purchased connectors a customer actually uses after six months, which commonly sits between a third and a half.
How do you score RAG answer quality without gaming the number?
Use an LLM-as-judge rubric against sampled production traces, not a curated eval set. Sample across every connected source and user cohort, and include abstention cases, where a confident wrong answer should score far worse than an honest not-found. Score above 8.5 out of 10 and query volume compounds; below 7.0, churn follows two quarters later.
Why does document growth matter more than ARR for predicting churn?
A customer on a multi-year contract can look healthy on revenue while document count and query volume flatline for four quarters. Revenue metrics lag; usage metrics lead. A customer flat at 12 million documents for two quarters has stopped expanding their source footprint, which is the leading indicator of a flat renewal.
What is permission-aware retrieval and why does it end deals?
Enterprise RAG must enforce the customer's existing access control lists at query time, not at index time. If a finance-restricted SharePoint document surfaces to an engineer, that is not a quality bug, it is a breach, and it fails security review. Edge cases include changed permissions, moved parent folders, and shared links with different access semantics.
How should cost per thousand queries be modeled for enterprise buyers?
Track it as a curve against volume, not a point estimate, because inference and vector-search costs do not scale linearly. Standard single-hop retrieval queries cost materially less than multi-hop synthesis with reranking. Model explicitly what happens when one customer triples query volume and shifts the mix toward multi-source synthesis.
What is the single-use-case ceiling and how do you break it?
Platforms that never get a customer to a second distinct application are structurally capped, because a single application is replaceable while a platform embedded in four workflows is not. If a customer has been live six months on exactly one use case, the renewal is a coin flip regardless of how well that use case performs.
FAQ
What are the top sales KPIs for a GenAI/RAG platform in 2027?
Track nine: net new ARR, net revenue retention, documents indexed per customer, daily queries per customer, time-to-first-production-RAG, answer quality score, cost per thousand queries, connector breadth, and 18-month renewal rate. GenAI vendors win on time-to-value, answer quality, data source coverage, and query economics, not seat count.
What net revenue retention should a GenAI platform target?
The 120-150% band is where credible platform vendors sit. Below 110% signals a usage problem, not a pricing problem. Above 150% sustained usually means aggressive initial underpricing or a fast-expanding pilot cohort that has not yet hit its ceiling. Decompose NRR into document-growth and query-growth components to diagnose slippage.
How many documents should a mature enterprise RAG deployment index?
Ten million is a serious mid-market deployment; a hundred million or more is a large enterprise that has connected most of its knowledge estate. Watch trajectory, not level. A customer flat at 12 million documents for two quarters has stopped expanding their source footprint, which is the leading indicator of a flat renewal.
What daily query volume indicates a healthy RAG deployment?
Ten thousand daily queries is a real deployment with genuine adoption; several hundred thousand is a platform-level dependency. The ratio worth tracking is queries per indexed document per month. A customer indexing 80 million documents but running 6,000 queries a day has indexed an archive, not a working knowledge base.
Why is 18-month renewal rate better than 12-month?
The first renewal in this category often happens before the platform has proven itself across a second use case. The 18-month mark tells you whether you became infrastructure. Ninety percent or better is the target. A single-use-case customer at 18 months is a coin flip regardless of how well that use case performed.
What is connector utilization and why does it matter?
It is the share of purchased connectors a customer actually uses after six months, commonly a third to a half. Low utilization means either an unresolved security objection or poor answer quality on that specific source. Pair raw connector count with utilization, because count alone is a vanity metric that technical evaluators will expose.
How do you detect silent connector breakage?
Source systems change APIs, rotate credentials, and modify permission models. A connector that stops syncing does not throw an obvious error in the sales dashboard; it shows up as gradually staler answers and a slowly declining quality score. Instrument freshness per connector, per customer, and alert on it before renewal risk compounds.
What is the biggest failure mode in RAG sales metrics?
Connector count inflation: counting connectors that technically exist but have never been run in production by a paying customer. A prospect's technical evaluator will find this in twenty minutes by asking how many customers use the ServiceNow connector today and the median time to first query. Define production-ready strictly.
How should a team sequence rolling out these nine metrics?
Days 1-30: instrument and reconcile billing, telemetry, and CRM views. Days 31-60: expose per-customer dashboards with leading metrics and build one intervention playbook per failure mode. Days 61-90: tie metrics to the engineering roadmap. Refuse to report any metric nobody acts on.
What does a healthy pilot-to-production conversion rate look like?
Track the share of paid pilots reaching a production contract within 90 days, weekly. A falling rate almost always traces back to connector coverage or time-to-value, and the metric tells you which quarter the problem started. Best-in-class platforms land production in 30 days or less; past 90 days, conversion drops sharply.
Sources
- https://www.gartner.com/en/newsroom/press-releases/2024-03-11-gartner-forecasts-worldwide-genai-spending
- https://www.mckinsey.com/capabilities/quantumblack/our-insights/the-state-of-ai
- https://arxiv.org/abs/2309.15217
- https://www.nist.gov/itl/ai-risk-management-framework
- https://cloud.google.com/blog/products/ai-machine-learning/rag-and-grounding-overview
- https://aws.amazon.com/blogs/machine-learning/
- https://learn.microsoft.com/en-us/azure/ai-services/openai/concepts/retrieval-augmented-generation
- https://www.ibm.com/think/topics/retrieval-augmented-generation
- https://openai.com/research/
- https://www.anthropic.com/research
Related on PULSE
- [More sales kpis for genai / rag platform rankings and buying guides](/knowledge)
- [PULSE Tools and calculators](/tools)
- [Everything on PULSE RevOps](/)
This page will be disappearing soon. Save it to your device for $1 — or read it free while it is here.
@Kory-White- · if Venmo asks, the last 4 of my number are 2012
 pulse-industry-kpisTop 10 Sales KPIs for AI Agent Framework in 2027
 pulse-industry-kpisTop 10 Sales KPIs for Background Check Services in 2027
 pulse-industry-kpisTop 10 Sales KPIs for Skincare DTC Brand in 2027
 pulse-industry-kpisTop 10 KPIs for Pilates Studios in 2027
 pulse-industry-kpisTop 10 Sales KPIs for Cannabis Retail Dispensary in 2027
 pulse-industry-kpisTop 10 Sales KPIs for Auto Loan and Auto Finance in 2027
 pulse-industry-kpisTop 10 Sales KPIs for GPU Cloud Provider in 2027
 pulse-industry-kpisTop 10 Sales KPIs for Vector Database in 2027
 pulse-industry-kpisTop 10 KPIs for Dance Studios in 2027
 pulse-industry-kpisTop 10 Sales KPIs for AI Music Generation in 2027