
How Do I Measure and Reduce Sales Tech Stack Waste in 2027?
 Curated byKory White · Fractional CRO · Maryland
 PULSEKNOWLEDGE LIBRARY
To measure and reduce sales tech stack waste in 2027, run a recurring audit that joins three data sources for every tool: the contract cost, the actual usage (license activation and active seats), and the business outcome it drives. Most revenue teams accumulate overlapping tools — two enrichment vendors, three intelligence tools, a forgotten scheduling app — and pay for seats nobody logs into. Waste is the gap between what you pay and what you use *and* what you need. The fix is a disciplined inventory plus four levers: reclaim unused seats, consolidate overlapping point tools, downgrade or kill low-adoption tools, and renegotiate at renewal armed with usage data. Done well, this typically recovers a meaningful share of spend per cycle and, just as important, reduces the cognitive load of a bloated stack that slows reps down.
Why Stack Waste Accumulates
Sales tech sprawl is the natural result of how tools get bought. A new VP brings a favorite vendor; a pilot never gets cancelled; seats are provisioned for a team that later shrank; a feature gets bought standalone that an existing platform already includes. Nobody owns the total picture, so spend creeps and tools overlap. By 2027, with AI features bolted onto nearly every category, the overlap problem is worse — many platforms now ship intelligence, enrichment, and sequencing that you may already be paying a separate vendor for.
The cost is not only money. A bloated stack fragments data, forces reps to context-switch across tools, and makes onboarding slower. Reducing waste is as much about rep productivity and clean data as it is about the renewal line item.
Step 1 — Build the Inventory
List every tool RevOps and sales touch, with: vendor, owner, contract value, renewal date, seat count, and the systems it integrates with. Pull this from procurement, the CRM admin, and SSO logs. A surprising number of tools surface that leadership forgot they were paying for.
Step 2 — Join Cost to Usage
For each tool, get actual usage: licenses activated versus purchased, active users in the last 30 days, and feature usage where available. SSO and admin consoles give login data; many vendors expose seat-activity reports. The first big recovery is almost always unused seats — paid licenses for people who left, changed roles, or never logged in.
Step 3 — Map Overlap and Outcomes
Group tools by job-to-be-done — enrichment, conversation intelligence, sequencing, scheduling, forecasting. Where two tools do the same job, decide which wins. Then tie each kept tool to an outcome signal: does the conversation-intelligence tool actually improve win rate or ramp? Does enrichment improve match and connect rates? Tools that cannot show a usage-and-outcome story are candidates to cut.
Step 4 — Act on the Four Levers
- Reclaim seats — downgrade seat counts to active users at renewal.
- Consolidate — drop a point tool whose job a platform you already own now does.
- Kill low adoption — a tool nobody uses returns nothing; fix adoption or cancel.
- Renegotiate — bring usage data to renewals; under-utilization is leverage.
Tools and data sources that help include Salesforce and HubSpot admin reports, SSO platforms like Okta for login activity, spend-visibility tools such as Zylo or Vendr for SaaS management, and Gong or Clari usage reports for adoption signals. The point is to make decisions on data, not anecdotes.
Step 5 — Make It Recurring
Stack waste regrows. Put a quarterly stack review on the calendar, require a business case and an owner for every new tool, and align cancellation reviews to renewal dates so you never auto-renew a dead tool. Assign a single stack owner in RevOps accountable for the total picture.
Who Should Own the Stack Review
Waste persists when ownership is diffuse. Name a single stack owner inside RevOps who holds the master inventory, runs the quarterly review, and signs off on every new purchase. This person partners with procurement on contract dates and with the CRM admin on seat data, but the accountability sits in one place. Give them a simple mandate: every tool must have a named business owner, a documented job-to-be-done, an adoption number, and a renewal date in the inventory. Anything missing those is a candidate to cut. Pair the owner with a lightweight intake process for new tools — a short business case, the overlap check against existing tools, and an owner assignment — so the front door is governed. The combination of one accountable owner plus a governed intake is what keeps sprawl from quietly rebuilding between reviews, which is the usual reason a one-time cleanup never sticks.
Common Pitfalls
- Cutting by gut. Without usage data you cut the wrong tools and keep zombies.
- Ignoring overlap inside platforms. You may be paying twice for a feature your CRM already includes.
- One-time cleanups. Waste regrows; only a recurring review keeps it down.
- No new-tool gate. Without a business case and owner requirement, sprawl returns.
- Measuring cost alone. A cheap tool nobody uses is still waste; measure cost *and* outcome.
The Hidden Cost of Tech Stack Bloat: Cognitive Overhead for Reps
Beyond the obvious dollar waste, the most damaging form of sales tech stack waste in 2027 is cognitive overhead — the mental energy reps waste switching between tools, remembering logins, and figuring out which system holds the truth. A 2024 study by Revenue.io found that the average sales rep toggles between 10 and 13 applications daily, spending roughly 23 minutes per day just navigating between them. That’s nearly two full work weeks per year lost to context switching.
To measure this, track two metrics during your audit: time-to-data (how many clicks or seconds it takes a rep to find a key piece of info like a prospect’s recent interaction) and tool-switch frequency (number of distinct app opens per hour, which your IT team can pull from activity logs). If your reps open more than six different tools in a single hour, you’ve crossed the threshold where productivity drops measurably — research from the University of California Irvine shows it takes 23 minutes to refocus after a single interruption.
Reducing cognitive overhead means ruthless consolidation. Map every workflow your reps actually run — prospecting, outreach, meeting prep, follow-up — and eliminate any tool that isn’t the *single source of truth* for that step. For example, if your CRM, sales engagement platform, and conversational intelligence tool all surface call recordings, pick one and disable the others. This isn’t just about saving money; it’s about making your reps faster. Teams that cut their tool count from 12 to 7 core apps typically see a 15–25% increase in daily outbound touches within 60 days, purely from reduced friction.
The 90-Day License Reclamation Sprint
Most waste comes from seats that are paid for but never activated or used. In 2027, with per-seat pricing still the norm across most sales tools, a single audit isn’t enough — you need a recurring license reclamation sprint every quarter. The process is straightforward but requires discipline:
- Pull login and activity data from each tool for the last 90 days. Export user-level last-login dates and feature usage (e.g., number of emails sent, sequences created, or records viewed).
- Flag every seat with zero logins in the last 60 days and every seat with fewer than 5 meaningful actions per month (define “meaningful” per tool — for a dialer, it’s calls made; for an enrichment tool, it’s lookups performed).
- Send a 7-day warning to the department manager: “These 12 seats show no activity. Confirm by Friday if they’re needed, or we reclaim them.”
- Remove access for unconfirmed seats on day 8. Most tools let you downgrade mid-cycle or pause billing — don’t wait for renewal.
Realistic results vary by company size. For a 50-person sales team, this typically recovers 8–15 seats per quarter across all tools, saving $15,000–$45,000 annually depending on tool pricing. For enterprise teams with 500+ seats, the recovery is often 50–80 seats per quarter, representing $100,000–$250,000 in annualized savings. The key is making this a rhythm, not a one-off — put it on the calendar for the first week of every quarter, and assign ownership to a revenue operations analyst.
Outcome-Based Tool Rationalization: Kill the “Nice-to-Have”
The most politically difficult waste to cut is the tool that “everyone likes” but nobody can prove drives revenue. By 2027, mature sales orgs have moved from usage-based audits to outcome-based rationalization: you keep a tool only if you can directly link it to a measurable business outcome within a 90-day window.
Here’s how to run it:
- For each tool, define the single outcome it should influence (e.g., “increase meeting booking rate by 10%” for a scheduling tool, or “reduce time to qualify by 20%” for an enrichment tool).
- Pull 90 days of data and compare performance *with and without* the tool’s active use. If the tool is a scheduling app, compare meeting rates for reps who use it vs. those who don’t.
- If you can’t find a statistically significant difference, the tool is a “nice-to-have” — downgrade to a free tier or kill it entirely.
A real-world example from a mid-market tech company in early 2026: they had three intent data tools costing $18,000 per month total. After a 90-day outcome audit, they found that only one tool produced leads that converted at a higher rate than their outbound cold outreach. They cut the other two, saving $12,000 per month, and saw no drop in pipeline generation over the next two quarters. The reps actually reported less noise in their dashboards.
The common objection is “but we might miss something.” Counter that by running a 30-day trial without the tool for a subset of reps — if pipeline doesn’t dip, the tool was never essential. Outcome-based rationalization turns subjective “we need this” arguments into data-driven decisions, and it’s the single most effective way to reduce waste in 2027 because it targets the tools that *feel* useful but aren’t.
FAQ
What counts as "waste" in a sales tech stack? Waste is any tool or seat you pay for that isn't actively used or doesn't drive a measurable business outcome. This includes licenses no one logs into, overlapping tools that do the same job (like two enrichment vendors), and features you're paying for but never turn on. The goal is to close the gap between what you spend and what you actually need.
How often should I audit my sales tech stack? Most teams benefit from a full audit every quarter, with a lighter monthly check on usage data. Quarterly gives you enough time to spot trends and prepare for renewals, while monthly ensures you catch sudden drops in adoption before they become permanent waste. The key is to tie the audit to your contract renewal calendar so you can act on findings.
What data do I need to measure waste accurately? You need three pieces of data per tool: the contract cost (including per-seat pricing), actual usage stats (like active logins and feature adoption), and the business outcome it drives (such as pipeline generated or deals influenced). Without all three, you risk cutting a tool that looks expensive but delivers high ROI, or keeping one that's cheap but useless.
Can I reduce waste without hurting sales productivity? Yes, if you focus on reclaiming unused seats and consolidating overlapping tools rather than cutting broadly. Most reps use only a handful of core tools daily, so removing redundant or low-adoption tools often reduces friction and speeds up workflows. The trick is to involve reps in the audit—they'll tell you which tools they actually rely on.
What's the typical range of savings from a stack cleanup? Savings vary widely by company size and stack complexity, but teams often recover between 15% and 30% of their total sales tech spend per cycle. This comes from canceling unused seats, downgrading overpriced plans, and eliminating duplicate tools. The exact number depends on how many tools you've accumulated and how disciplined you are about enforcing usage policies.
How do I prevent waste from building up again after the audit? Set up a recurring process: a quarterly review with a single owner (like a RevOps lead) who tracks usage and cost data, and a policy that any new tool must pass a "unique value" test before purchase. Also, require department heads to justify renewals with usage reports. Without these guardrails, waste tends to creep back within two to three quarters.
Sources
- Zylo and Vendr — SaaS management and software spend-optimization research and benchmarks.
- Gartner — guidance on technology rationalization and application portfolio management.
- Salesforce and HubSpot — admin and license-management documentation.
- Okta — SSO login and application-usage reporting documentation.
- Gong and Clari — platform usage and adoption reporting documentation.
Related on PULSE
- How Many Sales Reps Do I Need to Hire for My Waste Hauling Company?
- How do you run a sales kickoff (SKO) that doesn't waste a week?
- What specific vendor consolidation strategies are mid-market RevOps teams using to reduce their tech stack from 12 tools to 4 without losing data fidelity?
- Does the 2027 Trend of Vendor Consolidation Reduce the Need for Third-Party Integrations in Sales Tech?
- What specific vendor consolidation strategies are RevOps leaders using to reduce GTM tool stack overlap in the age of AI-first platforms?
- How do you measure and reduce sales rep attrition in 2027?
This page will be disappearing soon. Save it to your device for $1 — or read it free while it is here.
@Kory-White- · if Venmo asks, the last 4 of my number are 2012
This page is gone.
This one is off the shelf now. $1 keeps it on your phone for good — the whole page, pictures and diagrams included.
 revopsWhich AI in the funnel features are buying committees in 2027 treating as non-negotiable?
 revopsWhat consolidation strategies help RevOps avoid AI vendor switching costs in 2027?
 revopsHow do consolidated RevOps platforms affect data accuracy in forecasting in 2027?
 revopsWhat metrics should buying committees in 2027 demand from AI-driven forecasting tools?
 revopsHow can RevOps use AI to identify stalled deals in longer sales cycles in 2027?
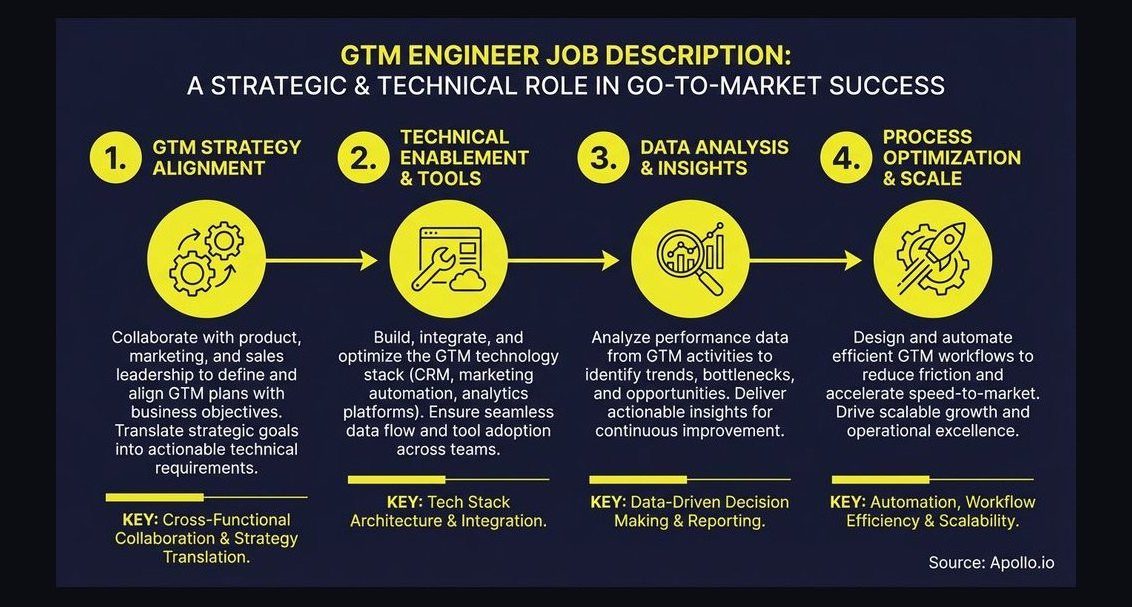 revopsWhat is a GTM engineer and why is the role exploding in 2027?
 revopsWhat is the cost of AI vendor lock-in for B2B sales teams in 2027?
 revopsWhat triggers are early-stage RevOps teams using in 2027 to hand off AI-qualified leads to human sales reps without losing context?
 revopsWhat vendor consolidation moves are most likely to disrupt existing ABM workflows in 2027?
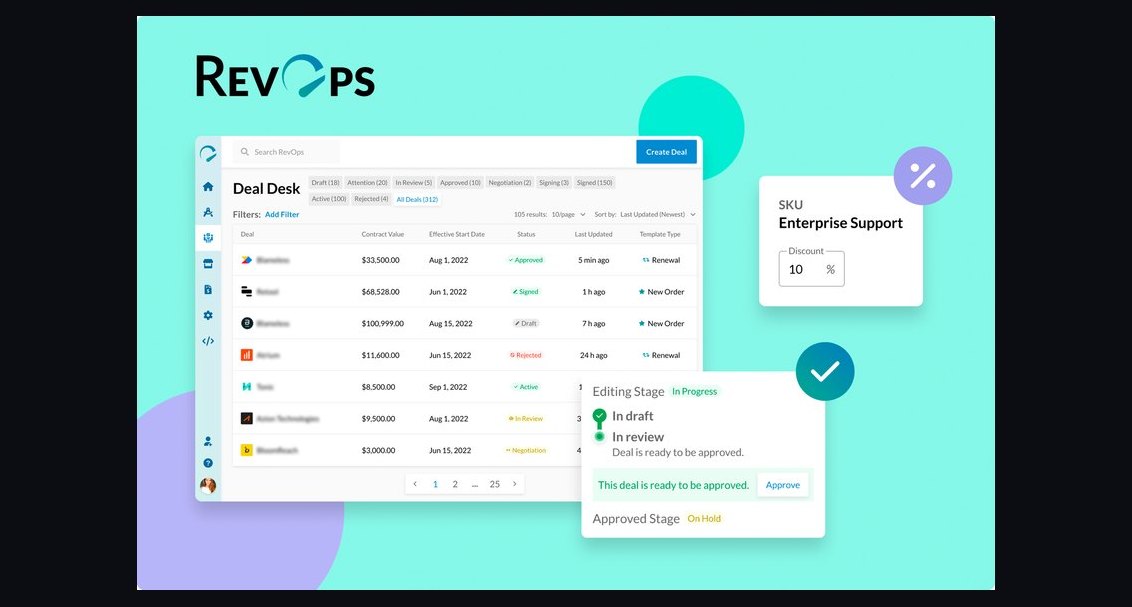 revopsHow should RevOps in 2027 adjust quota carrying capacity when AI automates 60% of outbound tasks?