
How do I calculate true gross retention vs net retention?
 Curated by Kory White · Fractional CRO, CRO Syndicate
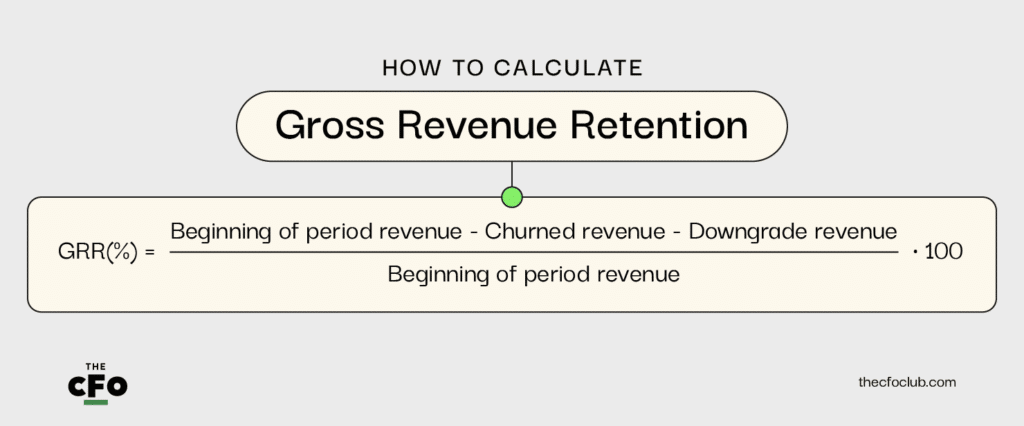
The Two Formulas Side By Side

Gross revenue retention and net revenue retention are built from the same four inputs — starting ARR, expansion, contraction, and churn — but they combine them differently, and that difference is the entire point. Gross revenue retention is (starting ARR − contraction − churn) / starting ARR. It measures only the downside: how much of the revenue you started the period with you still have, before crediting yourself a single dollar of upsell.
Because it has no expansion term, GRR is mathematically incapable of exceeding 100% — and it should always be capped there in reporting, because a number above 100% would mean negative churn, which is not a thing; if your spreadsheet ever prints 101% GRR, you have a formula bug, not a great quarter.
Net revenue retention is (starting ARR + expansion − contraction − churn) / starting ARR. It adds expansion back in, which means it can and routinely does exceed 100%. The critical structural difference, the one every CFO and RevOps leader has to internalize: GRR excludes expansion entirely; NRR includes it. That is not a rounding nuance.
It is the difference between a leak-detection metric and a growth-efficiency metric — GRR asks "how watertight is the bucket," NRR asks "is the bucket filling faster than it drains, even before we pour in new customers." Worked example: a cohort starts the year at $10.0M ARR. Over twelve months, $600K contracts (downgrades, seat reductions), $900K churns (logos lost entirely), and $1.8M expands (upsell, cross-sell, seat adds).
GRR = (10.0 − 0.6 − 0.9) / 10.0 = 8.5 / 10.0 = 85%. NRR = (10.0 + 1.8 − 0.6 − 0.9) / 10.0 = 10.3 / 10.0 = 103%. Same cohort, same period, same underlying events — an 18-point spread.
The GRR says you are losing 15% of your revenue base every year to churn and contraction. The NRR says you are net-growing the base 3% without acquiring a single new customer. Both are true.
Both matter. Reporting only one of them — almost always the flattering NRR — is how companies lie to their boards without technically lying. The mental model that keeps the two straight: GRR and NRR share a denominator (the frozen T0 cohort ARR) and share two of three downside terms; NRR simply adds the one term — expansion — that GRR refuses to count.
Everything that follows in this entire entry is, in some sense, a consequence of that single structural choice about whether expansion belongs in the numerator.
Why GRR Is The "True Health" Metric
NRR is the metric SaaS loves to put on a slide because it can be made to look spectacular. GRR is the metric that cannot be dressed up, and that is precisely why it is the truer read on business health. Here is the failure mode NRR hides: imagine a 200-customer cohort.
Over the year, 40 of those customers churn entirely — a 20% logo loss, genuinely alarming. But three large enterprise accounts triple their spend through a major expansion. The expansion dollars from those three accounts can be large enough to fully offset the 40 lost logos plus all contraction, pushing NRR to 110-115%.
The board sees 112% NRR and concludes the product is sticky and customers love it. The reality is that 20% of the customer base walked out the door and the business is one renewal away from a cliff, because the moment those three whale accounts stop expanding — or worse, churn — the whole illusion collapses.
GRR cannot do this. With expansion stripped out, those three whales contribute nothing to the GRR numerator beyond their own retained baseline. The 40 lost logos and all the contraction show up at full weight. The GRR on that cohort would be something like 78-82% — and that number screams the truth the NRR was burying.
This is why sophisticated investors ask for GRR first and treat a company that volunteers only NRR with suspicion: experienced diligence teams have learned that a company leading with NRR alone is, more often than not, a company whose GRR has something to hide. GRR is the floor of your business: it is what you would retain if your expansion motion went to zero tomorrow — if every account simply renewed flat or smaller and nobody upsold anything.
A company with 92% GRR has a durable base that compounds; a company with 75% GRR is running up a down escalator no matter how good its expansion story sounds, because it has to re-acquire a quarter of its revenue every single year just to stand still. Compound that: 92% GRR means after three years roughly 78% of the original cohort revenue is still there before any expansion; 75% GRR means roughly 42% survives three years — a completely different business.
Expansion can mask churn in NRR. It can never mask churn in GRR. That asymmetry is the whole reason both metrics exist, and it is why a mature board pulls the GRR line first and only then looks at what NRR added on top.
The Cohort Definition Problem
The formulas are the easy part. The hard part — the part that makes most company retention numbers quietly wrong — is defining the cohort. Retention is fundamentally a cohort measurement: you take a fixed set of customers, freeze that list at a point in time, and measure what happened to that exact set over a defined window.
The discipline is in the word *fixed*. The correct construction: identify every customer who was active and contributing ARR at T0. That is your cohort and your denominator — it never changes.
Twelve months later, at T0+12, you measure the ARR generated by those same customers and only those customers. A customer who churned contributes $0. A customer who downgraded contributes their reduced amount. A customer who expanded contributes their increased amount.
The numerator floats; the cohort and denominator are frozen. The trap that destroys this — and it is astonishingly common — is measuring against "all current customers" instead of a fixed historical cohort. If you take today's total ARR and divide by last year's total ARR, you are not measuring retention at all; you are measuring net growth, because today's ARR includes every new logo you signed during the year.
New-logo ARR in the numerator inflates the ratio and makes a churning business look healthy — a company that signed 60% in new logos can post a "retention" number well over 130% while genuinely losing a third of its base, and the math is not lying, the definition is. The other trap is a "rolling" or "fuzzy" cohort where customers drift in and out of the measured set based on current status — this produces a number that cannot be audited or reproduced because the population is different every time you run it; ask two analysts to compute it and you get two answers.
A third subtle trap: deciding what "active at T0" means for customers mid-implementation, in a free trial converting to paid, or in a contractual grace period — you must pick a bright line (signed contract with positive ARR is the usual one) and hold it. The standardized construction every credible operator uses: cohort = active paying customers as of T0; denominator = that cohort's ARR at T0; numerator = that same cohort's ARR at T0+N, with new logos categorically excluded. Write that definition down, get finance and RevOps to sign it, version it, and never deviate without a loud announcement — because the moment the cohort definition drifts, every period-over-period comparison you have ever shown silently becomes false.
Annual vs Monthly Cohort Measurement
There are two legitimate ways to set the measurement window, and they answer slightly different questions. Annual cohort measurement takes the customers active at the start of a 12-month period and measures them at the end of it. It is clean, it maps to how boards and investors think, and it is the standard for external reporting.
Its weakness is lag: you do not know your FY2026 cohort's annual retention until the end of FY2026, so it is a rearview metric — by the time the number is in, the churn has already happened and the renewals are already lost. Monthly cohort measurement, rolled up takes each month's starting cohort, measures it one month later, and then chains or aggregates those monthly figures — often expressed as a trailing-twelve-month (TTM) number by compounding twelve consecutive monthly retention rates, or by taking the cohort from twelve months ago and measuring it today.
Monthly cohorts give you a much earlier read on a deteriorating trend; you can see month-three of a bad cohort before the annual number ever lands, which is the difference between a fixable problem and a fait accompli. The roll-up also produces a smoothing effect: month-to-month noise (a single large renewal slipping a few days, a lumpy expansion, a holiday-season billing lull) averages out across twelve data points, so the TTM line is less jittery than any single month and far more suitable for a trend chart.
The tradeoff: monthly measurement can understate or overstate annual retention if your churn is seasonal or renewal-date-concentrated, because compounding twelve monthly rates assumes a smoothness that lumpy contract books — most of them, in B2B — simply do not have. A company with 70% of contracts renewing in Q4 will get a misleading monthly-compounded number that smooths away the very renewal cliff that matters most.
What investors expect: for board decks and diligence, present the annual cohort number as the headline, and use monthly cohorts as the leading-indicator and trend view underneath it. Most well-run companies maintain both — annual for the scoreboard, monthly for the steering wheel — and reconcile them so a divergence between the two becomes its own diagnostic signal: if the monthly-compounded TTM and the true annual cohort number disagree by more than a couple of points, that gap is telling you something about renewal concentration or seasonality that you should understand before you report either number.
What Counts As "Contraction"
Contraction is any decrease in a retained customer's ARR that is not a full churn — the customer is still with you, just paying less. Getting the contraction definition precise matters because it is the input that most often gets misclassified or quietly ignored, and every dollar that should be contraction but is not classified as contraction is a dollar of phantom GRR.
The components: seat reduction — the customer drops from 100 licenses to 70; the lost 30 seats' worth of ARR is contraction, even if the renewal otherwise went smoothly. Tier downgrade — the customer moves from your Enterprise plan to your Pro plan; the price delta is contraction.
Discount given at renewal — this is the one operators love to pretend is not contraction. If a customer renews at $90K having previously paid $100K because you cut them a 10% discount to keep them, that $10K is contraction, full stop. It does not matter that the seat count was identical, it does not matter that you "saved the account," it does not matter that sales calls it a pricing concession; the ARR went down and that is what retention measures.
Pretending renewal discounts are "just pricing" is one of the most common ways GRR gets quietly inflated, and it compounds — a sales org that learns discounts do not hit retention will discount more freely every cycle. Usage decline in usage-based models — if you bill on consumption and a customer's usage drops, their ARR (or annualized run-rate) drops, and that delta is contraction even though no one "downgraded" anything; this is a genuine measurement challenge covered in its own section below, because not every usage dip is a health signal.
Scope reduction — the customer removes a module, product line, add-on, or premium-support tier they previously paid for. Downgraded payment terms that reduce annualized value also count. The rule that ties all of these together: contraction is any negative ARR movement within a retained logo. If the customer is still a customer and the number went down, it is contraction.
Classify it consistently, classify it the same way every period, attach a reason code so you can diagnose *why* contraction is happening, and never let "we gave them a deal" or "it is just a true-up" become a quiet exemption.
What Counts As "Churn"
Churn is the total loss of a logo — the customer is gone, contributing $0 ARR at the end of the period. The clean cases are obvious: a customer cancels, or a contract reaches its end date and is not renewed. The nuances that need explicit handling are where companies get sloppy.
Contract non-renewal is churn even if the relationship ended amicably and the customer "might come back" — at the measurement date they are at zero, so they count as churned; a future win-back is a future expansion or new-logo event, not a retroactive un-churn, and back-dating a win-back to erase a churn is one of the quieter ways retention gets gamed.
The voluntary vs involuntary distinction matters operationally even though both reduce GRR identically. *Voluntary churn* is a customer who actively chose to leave — they found a competitor, killed the project, went out of business, got acquired and consolidated onto the acquirer's stack, or decided the product was simply not worth the spend.
*Involuntary churn* is a customer who did not choose to leave but churned anyway, almost always because of a failed payment: an expired credit card, a declined charge, a billing-contact who left the company and stopped approving invoices, a bank-level fraud block. Involuntary churn is, to a real and measurable extent, recoverable — through dunning sequences, automatic card-updater services, pre-expiry payment-method nudges, and simply better billing operations — which is why you track it separately even though it hits the exact same line in the GRR formula.
A company with 6% total annual churn that is 4% involuntary has a fixable operations problem and can plausibly claw back two or three points with a dunning project; a company with 6% churn that is entirely voluntary has a product, value, or competitive problem that no billing fix will touch.
Both produce the identical GRR. Only the segmented view tells you which fire to fight, and fighting the wrong one wastes a year. The reporting rule: churn is full logo loss measured at the period boundary, and you should always be able to split it voluntary vs involuntary — and ideally tag voluntary churn with a reason code (competitor, budget, product gap, M&A, went-out-of-business) — even though the headline GRR collapses all of it into one number.
What Counts As "Expansion"
Expansion is any increase in a retained customer's ARR — the mirror image of contraction, and the single term that separates NRR from GRR. The components: seat adds — the customer grows from 70 licenses to 110; the new 40 seats are expansion. Tier upgrades — Pro to Enterprise; the price delta is expansion.
Cross-sell — the customer buys a second product, module, or add-on they did not have before, which is generally the highest-quality form of expansion because it deepens the relationship across product lines. Usage growth in consumption-based models — the customer's metered usage rises and their run-rate ARR rises with it.
And the genuinely contested one: price increases. Should a list-price increase that you push to the existing base count as expansion? There are two defensible positions and you must pick one and document it. The purist position: no — expansion should reflect customers choosing to consume more value (more seats, more product, more usage), and a price increase is just you charging more for the same thing, so counting it as expansion flatters NRR with something that is not a demand signal and is not repeatable indefinitely.
The pragmatic position: yes — the customer's ARR genuinely went up and they chose to stay rather than churn at the higher price, which is itself a retention and pricing-power signal, so it counts. Most sophisticated companies that take price increases do count them but disclose them as a separate line so a reader can see NRR with and without price effects — "NRR was 116%, of which 4 points was a list-price increase" is an honest disclosure; silently folding a 7% across-the-board increase into expansion and then celebrating the NRR jump as a product-stickiness win is not.
The same separate-disclosure logic applies to currency-driven ARR increases and to expansion that came from contractual auto-escalators baked into multi-year deals — both are real ARR but neither is a fresh demand signal. The rule: expansion is any positive ARR movement within a retained logo; price increases, FX gains, and contractual escalators may count but must be disclosed separately so the underlying demand-driven expansion — the part that actually proves customers want more of your product — is visible on its own.
The Logo Retention vs Dollar Retention Distinction
There are two completely different things you can retain: logos (the count of customers) and dollars (the ARR those customers represent). They are not the same number and the gap between them is one of the most informative signals in the whole retention picture. Logo GRR = (logos at start − logos churned) / logos at start.
It counts customers, weighting a $2K account and a $2M account identically — each is one logo. Dollar GRR is the formula we have been using all along — it weights by ARR, so the $2M account matters a thousand times more than the $2K account. Here is the scenario that makes the distinction matter: a SaaS has 100 customers at the start of the year.
It loses 20 of them — but the 20 it loses are all small accounts, averaging $5K each, while the 80 it keeps include all of its large accounts. Logo GRR is 80% — one in five customers gone, which sounds alarming. But because the churned accounts were tiny, dollar GRR might be 95% — the company kept 95% of its *revenue* even while losing 20% of its *customers*.
That 80/95 split is not a contradiction; it is a precise, useful description of the business: it has a small-account churn problem (worth investigating — bad-fit segment? Weak onboarding for the low end? A self-serve tier that overpromises?) but its revenue is concentrated in durable large accounts.
The inverse is just as real and far more dangerous: 95% logo retention but 80% dollar retention means you are keeping all the small accounts and losing the whales — a revenue-concentration time bomb, because a single large churn can swing the dollar number violently and your "good" logo number gives you false comfort.
The discipline: always report both logo and dollar retention, for both GRR and NRR — four numbers, not one. Logo retention tells you about product-market-fit breadth and the health of your low end and your self-serve motion; dollar retention tells you about revenue durability and concentration.
A board that sees only one of them is missing half the picture, and which half is missing changes depending on which number you chose to show — which is exactly why the company gets to pick, and exactly why you should not let it.
The Measurement Boundary Decisions
Beyond the core formula there is a set of boundary decisions — edge cases that arise in every real ARR book — and the credibility of your retention number depends on deciding them explicitly, writing them down, and applying them consistently. New logos signed in-period: exclude. A customer who became a customer after T0 is not part of the T0 cohort and enters neither the numerator nor the denominator of that cohort's retention.
They will be in *next* period's starting cohort, where they belong. Including them is the single most common way retention gets inflated, and it is non-negotiable: new logos out of the cohort math entirely. Currency effects: for companies with non-USD contracts, a customer whose local-currency ARR is perfectly flat will show a different USD ARR if exchange rates moved during the period.
You can either normalize — hold FX constant at T0 rates so retention reflects only customer behavior, not currency markets — or report as-is and disclose the FX impact as a separate line. Normalizing is cleaner for diagnosing customer health; reporting as-is is cleaner for tying to the financials; either is defensible *if disclosed*, and neither is defensible if silent.
M&A'd customers: when two customers in your cohort merge, or one acquires the other, you have to decide whether the surviving entity is one logo or two going forward, and how to treat the combined ARR — which very often contracts as the merged company rationalizes duplicate spend.
The common convention: treat the consolidated entity as a single continuing logo and net the ARR change as contraction or expansion, but the specific rule must be documented. Re-segmentation (a customer that grew from SMB-sized to mid-market-sized mid-cohort — does it move segments?), entity restructuring (one customer splitting into three subsidiaries each with their own contract), and contract consolidation (three contracts collapsed into one master agreement) all raise similar questions.
The meta-rule for all boundary decisions: the specific choice matters far less than consistency and disclosure. Pick a rule, write it into your retention definition document, apply it identically every single period, and footnote it in any external report. A defensible-but-imperfect rule applied consistently for eight quarters beats a theoretically "perfect" rule applied differently each quarter — because the imperfect-consistent rule still gives you a trustworthy trend, and the trend is usually the actionable signal.
Common Calculation Mistakes
The formulas are simple enough that people assume they cannot get them wrong, and then they get them wrong in the same five ways, quarter after quarter. Mistake one: new logos in the denominator (or numerator). Covered above, but it bears repeating because it is the most frequent and most damaging error — it turns a retention metric into a net-growth metric and makes churning businesses look fine, sometimes spectacular.
The denominator is *only* the T0 cohort's T0 ARR; the numerator is *only* that same cohort, later. If a customer was not in the room at T0, they are not in either number. Mistake two: mixing monthly and annual. Comparing a monthly retention figure to an annual one, or computing a denominator on an annual basis and a numerator on a monthly run-rate basis, or annualizing a monthly figure by simple multiplication instead of compounding — all produce nonsense.
Pick one window and apply it identically to both halves of the ratio. Mistake three: counting reactivations as expansion. When a previously churned customer comes back, that returning ARR is *new* ARR or *win-back* ARR — it is not expansion of a retained account, because the account was not retained; it left and you had to re-acquire it.
Folding win-backs into the expansion line inflates NRR and obscures a real cost: you spent acquisition effort twice on the same logo. Mistake four: not capping GRR at 100%. If your GRR calculation ever produces a number above 100%, you have a formula bug — almost always expansion leaking into the GRR numerator at the customer level (a customer who both contracted on seats and expanded on a module, netted to positive, then allowed to contribute more than their T0 amount).
GRR is structurally capped at 100% per customer and in aggregate; enforce the cap and investigate any breach as a data-quality incident. Mistake five: inconsistent contraction classification — most often, treating renewal discounts as "pricing" rather than contraction, which quietly inflates GRR period after period and trains the sales org to discount.
Honorable mentions that sink real companies: annualizing partial-period and ramped contracts incorrectly, double-counting a customer who both contracted on one product and expanded on another instead of *netting* them at the logo level, counting one-time fees and professional-services revenue as ARR, and letting the cohort definition drift between reporting periods so the numbers are no longer comparable to your own history.

👉 Quick Call with Kory White, Fractional CRO · See Kory on LinkedIn · CRO Syndicate
The Quick-Ratio Companion Metric
GRR and NRR tell you about retention; the SaaS Quick Ratio tells you about the *quality and efficiency* of your growth, and it is the natural companion metric to put alongside them on the same page. The Quick Ratio = (new ARR + expansion ARR) / (churned ARR + contracted ARR). It is the ratio of all the ARR you added in the period to all the ARR you lost in the period.
A Quick Ratio of 4 means that for every dollar of ARR you lost to churn and contraction, you added four dollars through new logos and expansion — efficient, durable, compounding growth. A Quick Ratio of 1 means you are running hard just to stay in place: every dollar gained is matched by a dollar lost, and whatever net growth shows up is coming entirely from outpacing a leaky bucket by a hair.
Below 1 and the bucket is winning — you are shrinking even if a quarter looks busy. The reason it complements GRR and NRR rather than duplicating them: retention metrics look *only* at the existing base, while the Quick Ratio pulls new-logo acquisition into the same frame as retention, so you can see whether your growth is *coming from a healthy base or papering over a sick one.* A company can post a great-looking NRR of 115% and still have a mediocre Quick Ratio if its new-logo motion is weak — the expansion is real but the top of the funnel is broken.
Conversely a company can post a strong Quick Ratio that is being driven entirely by aggressive, expensive new-logo sales while a GRR problem festers underneath — the Quick Ratio looks fine because new ARR is large, but the base is rotting. Rough benchmarks: a Quick Ratio above 4 is excellent for an early-stage company, 2-4 is solid, and below 2 warrants real scrutiny — though the bar drifts downward as companies scale and the law of large numbers makes high ratios arithmetically harder to sustain.
The discipline: report the Quick Ratio next to GRR and NRR, not instead of them. The three together — efficiency (Quick Ratio), gross durability (GRR), and net growth of the base (NRR) — give a board a complete picture that no single metric, however flattering, can deliver on its own.
GRR Benchmarks By Segment
Retention benchmarks only mean something when they are segmented by customer size, because the dynamics of an SMB book and an enterprise book are structurally, not just incrementally, different. Here is the 2026 reality for gross revenue retention, the metric that cannot be inflated by expansion.
SMB: roughly 80-88%. Small-business customers churn for reasons that have nothing to do with the quality of your product — they go out of business, they get acquired, the founder who championed you leaves and the new owner has a different stack, a budget evaporates the moment the macro turns.
Even a genuinely beloved SMB product fights a structural 12-20% annual GRR drag that no amount of customer success can fully eliminate. An SMB SaaS at 88% GRR is doing very well; sustained below 80% and the unit economics are usually broken because CAC can never be recovered against a base that thin.
Mid-market: roughly 88-92%. Mid-market customers are meaningfully more stable than SMB — they have real procurement, multi-stakeholder buying committees, signed annual or multi-year contracts, and switching costs — but they still churn through M&A, vendor consolidation initiatives, and budget cycles. 90%+ GRR is the mark of a healthy mid-market business; the low 90s is where most good ones live.
Enterprise: roughly 92-95%+. Large enterprise customers are sticky by construction: deep technical integrations, long contract terms, multi-year commitments, high switching costs, procurement inertia, and real political capital invested in the original decision. Best-in-class enterprise SaaS posts 95-97% GRR, and the very best clear 97% consistently.
The pattern is monotonic and intuitive: the larger the customer, the higher the GRR, because larger customers are harder to win and, having been won, correspondingly harder to lose. The practical use of these bands is diagnostic: they tell you whether your GRR is a structural feature of the segment you sell to or an actual fixable problem.
An 85% GRR is a five-alarm crisis for an enterprise company and a perfectly good result for an SMB company — same number, opposite conclusions. Always benchmark within segment, never against a blended industry average, and if you sell across multiple segments, report GRR by segment so a strong enterprise number does not hide an SMB book that is quietly bleeding out.
NRR Benchmarks By Segment
Net revenue retention benchmarks follow the same segment logic but with wider spreads, because NRR layers the expansion motion on top of the gross retention floor — and expansion potential varies enormously by segment. The 2026 bands: SMB: roughly 95-105%. SMB customers have less room to expand — they are small, they bought roughly what they needed on day one, there are fewer seats to add, fewer departments to spread into, and fewer modules to cross-sell.
Combined with the structural SMB churn drag from the GRR section, this keeps SMB NRR pinned near or just above 100%. An SMB SaaS at 105% NRR has a genuinely good expansion motion working hard to overcome a real churn headwind, and an SMB business with NRR meaningfully below 100% is shrinking its existing base every year and must win new logos just to tread water.
Mid-market: roughly 105-115%. Mid-market customers grow, add seats as they hire, adopt new modules, and expand across departments and use cases, while churning materially less than SMB — so NRR comfortably clears 100% and 110%+ is a strong, fundable result. Enterprise: roughly 115-130%. This is where NRR can become spectacular: enterprise customers land small and expand massively — a pilot in one division becomes a company-wide deployment, one product becomes five, hundreds of seats become tens of thousands over a multi-year relationship.
Best-in-class enterprise SaaS posts NRR of 125-135%, and a few category leaders have sustained 140%+ for years. The pattern, like GRR, is monotonic: larger customers expand more, so NRR rises with segment, and a company that sells across all three should expect — and report — a distinctly different NRR for each.
The critical interpretive point — and the reason the diagnostic section exists — is that NRR alone is not enough, and a high NRR is the easiest number in SaaS to misread. A 120% enterprise NRR looks elite, but if the matching GRR is only 85%, that 120% is being carried by a handful of expanding whales while the broader base quietly churns out the bottom.
Always read the NRR band against the GRR band for the same segment, side by side. Healthy enterprise looks like 94% GRR and 122% NRR — a durable base *and* strong expansion. Unhealthy enterprise that *looks* healthy is 84% GRR and 121% NRR — nearly the identical NRR headline, a completely different and far more fragile business underneath it.
Building The Calculation In Salesforce / HubSpot
Retention is only as good as the data model it is computed from, and in most companies that model lives in the CRM. The foundational structure in both Salesforce and HubSpot is the same: you need a contract or subscription object that holds the source-of-truth ARR for each customer, with accurate effective dates, and you need renewal opportunities — a distinct opportunity (or deal, in HubSpot) created automatically for every contract's renewal event, with a close date equal to the renewal date and an amount equal to the renewing ARR.
The renewal opportunity is where contraction, churn, and flat-renewal all get recorded: it closes won at the new (possibly lower, possibly flat) amount, or closes lost at zero. Expansion is captured either as a positive line on the renewal opportunity or, more cleanly and more auditably, as separate upsell and cross-sell opportunities with their own amounts, close dates, and reason codes.
With that object model in place, the retention calculation becomes a deterministic query: take all customers with an active contract as of T0, sum their T0 ARR (the denominator), then for that same frozen customer set sum their ARR as of T0+12 from the contract object (the numerator).
GRR caps each customer's numerator contribution at that customer's own T0 amount — no customer can contribute more than they started with — while NRR lets the per-customer contribution run uncapped so expanders pull the aggregate above 100%. The data hygiene this requires is the genuinely hard part, and it is where most companies fail: every contract must have accurate start and end dates; every renewal must generate a renewal opportunity so nothing slips through a silent auto-renewal that bypasses the pipeline entirely; amounts must be true recurring ARR, not total contract value, not one-time implementation fees, not professional services; contraction and expansion must be tagged with reason codes so the *why* is queryable; and the customer-to-contract relationship must be clean and deduplicated so you are never double-counting ARR across two records for the same logo or orphaning ARR on a contract whose account got merged.
In HubSpot, the same pattern is implemented with the native deal-based recurring-revenue tooling or a subscriptions integration; in Salesforce, CPQ or a billing-system integration usually owns the contract object and the renewal-opportunity automation. The platform differs; the principle does not: no clean contract object and no disciplined renewal-opportunity process, no trustworthy retention number — just a query returning a confident-looking lie.
Reconciling With Finance / Billing
The CRM gives you a retention number. The billing system gives you a *different* retention number. If you do not reconcile them, RevOps and Finance will walk into the same board meeting quoting figures that do not match, and a sharp board will then trust neither — and trust, once lost on a core metric, is expensive to rebuild.
The billing systems where the "real" money lives — Stripe, Chargebee, Maxio (formerly Chargebee/SaaSOptics), NetSuite, Recurly, Zuora — record what customers were actually invoiced and what actually got collected. The CRM records what sales *believes* the contract says. These two diverge for entirely legitimate reasons: timing (a contract signed in the CRM in late December but not billed until January); proration on mid-cycle changes; mid-term amendments that updated the billing system but never got reflected back in the CRM contract; credits, refunds, and concessions; failed payments and dunning outcomes the CRM has no visibility into; and multi-entity, multi-currency, and tax complications.
The reconciliation discipline: every month, tie the CRM's ARR walk — starting ARR + new + expansion − contraction − churn = ending ARR — line by line to the billing system's ARR walk, and chase down every variance until it is either explained or corrected. The goal is explicitly not zero variance — some timing difference is structurally unavoidable in any real business — but a *known, explained, bounded, and documented* variance, captured in a written bridge between the two numbers that anyone can pick up and follow.
Best practice is to formally designate one system as the source of truth for the externally reported retention number — most commonly the billing system, because it reflects cash reality, ties to revenue recognition, and survives an audit — and to treat the CRM-derived number as the faster operational leading indicator that should *converge* to the source-of-truth number over the close.
When the board asks "is this the billing number or the CRM number?" — and a good board always eventually asks — you need a one-sentence answer and a reconciliation bridge sitting behind it. A retention number that finance has never signed off on is a number that will, sooner or later, embarrass the person who presented it.
The Cohort Triangle / Layer-Cake Chart
The single most powerful visualization for retention is the cohort triangle — also called the cohort retention table, or, when stacked as an area chart, the layer-cake chart. Here is how it is built: each row is a cohort, defined by the period the customers were acquired (say, each quarter, so the Q1-2025 row is everyone who first became a paying customer in Q1 2025).
Each column is the *age* of that cohort — quarter 0 (the quarter of acquisition), quarter 1, quarter 2, and so on. The cell at row "Q1 2025 cohort," column "age 4" shows the retained ARR — or retention percentage — of the customers acquired in Q1 2025 as measured four quarters later.
Because newer cohorts have not had time to age as far, the populated cells form a triangle, hence the name. How to read it: scan *down a column* to compare different cohorts at the same age — if your age-4 retention has been climbing cohort over cohort, your retention is genuinely and structurally improving; if it is degrading down the column, the customers you are signing more recently are worse, which is a sales-quality, ICP, or onboarding problem dressed up as a retention problem.
Scan *across a row* to see a single cohort's retention curve unfold over its life — does it decay for a few periods and then *flatten* (healthy: you have a sticky core that does not erode), or does it decay relentlessly with no floor (unhealthy: there is no retention equilibrium and the cohort eventually goes to near zero)?
The layer-cake version plots the same underlying data as a stacked area chart over calendar time, with each acquisition cohort drawn as its own colored band; a healthy business shows thick bands that persist for years, and in a net-negative-churn business the bands actually *grow* after acquisition as expansion outpaces churn, so the whole cake gets taller over time — that rising, thickening stack is the unmistakable visual signature of an NRR comfortably above 100%.
The cohort triangle is what separates companies that genuinely *understand* their retention from companies that merely *report* a blended number. A single headline GRR of 90% can sit on top of wildly different cohort realities — a stable 90% equilibrium, or a number that is 96% on old cohorts and 78% on new ones and only averages to 90% on its way down.
The triangle exposes which one you actually are. Build it in your BI tool, refresh it monthly, and put it on the screen in every retention review.
Diagnosing With GRR + NRR Together
The real diagnostic power comes from reading GRR and NRR *as a pair*, because each combination of the two points to a specific, different underlying problem with a specific, different fix — the pair is effectively a 2x2, and your quadrant is a diagnosis. High NRR + low GRR — say 118% NRR sitting on 82% GRR — means expansion is masking churn. A subset of accounts is expanding hard enough to drag the net number well above 100% while the broader base leaks badly underneath.
The danger here is twofold: concentration risk (the whole NRR story depends on a few expanding whales continuing to expand) and a false sense of institutional security (the board sees 118% and stops asking hard questions). The fix is to attack the churn directly and urgently — onboarding, customer-success coverage ratios, the product gaps showing up in churn reason codes, the involuntary-churn billing leaks — and in parallel to stress-test what NRR collapses to if the top ten expanding accounts merely go flat.
Low NRR + high GRR — say 99% NRR on 94% GRR — means your retention is excellent but the expansion engine is broken. You keep customers extremely well; you simply do not grow them. The base is durable and that is genuinely valuable, but the problem is monetization and account development.
The fix lives in upsell and cross-sell motion, in packaging and pricing that deliberately creates expansion paths and headroom, in usage-based or tiered components that let good customers naturally grow their spend, and in a customer-success org that is compensated and equipped to *drive* expansion rather than only to *prevent* churn.
Both low — say 98% NRR on 80% GRR — is a crisis: you are churning badly *and* failing to expand, and your net number is hovering near 100% only by luck or by new-logo ARR leaking into a sloppy cohort definition. This combination almost always signals a product-market-fit or value-delivery problem, and it is existential — every other initiative is secondary until GRR recovers, because you cannot build a durable company on a base that evaporates.
Both high — say 95% GRR with 125% NRR — is a category winner: a durable, watertight base *and* a powerful expansion engine compounding on top of it; the job there is to protect it and watch concentration. The discipline that ties this together: never, ever look at one of the two numbers alone.
The pair tells you not just *how* you are doing but precisely *what to do next* — and which expensive initiative would be a waste of the next two quarters.
Usage-Based Pricing Complications
Usage-based and consumption pricing — increasingly the dominant model for infrastructure, data, developer-tools, and AI products — breaks the clean contraction/expansion framework in a specific and important way: revenue moves every single period without any customer making a "decision" at all. A customer who is perfectly happy, fully retained, and not going anywhere can spend $40K one quarter and $34K the next simply because their own business had a slow quarter, a scheduled batch job ran less often, a seasonal traffic pattern ebbed, or an engineering team optimized their own usage.
Under the strict point-in-time definition, that $6K drop is contraction — but it is not a churn signal, it is just *variance*, and a framework that treats every dip as contraction makes your GRR look volatile and alarming when absolutely nothing is wrong, while also making a random usage spike look like expansion you did not earn.
The approaches sophisticated consumption businesses actually use: (1) measure retention on a trailing-twelve-month basis rather than point-in-time, so short-term usage swings average out across the year and you are comparing a customer's full annualized consumption against their prior full annualized consumption.
(2) Use a committed-spend or minimum-commitment floor as the retention base wherever contracts have one — measure retention against the contractual commitment rather than against the noisy actual variable usage, since the commitment is what the customer actually signed up to.
(3) Define an explicit materiality threshold — only count *sustained* usage declines (for example, a drop that persists two or more consecutive quarters, or that falls outside a defined noise band) as true contraction, and treat within-band movement as variance that nets out.
(4) Report a purpose-built "usage retention" or net-usage-retention metric, explicitly designed for the consumption model and clearly labeled, kept separate from any contract-based GRR/NRR you also publish, so readers always know which lens they are looking through. The non-negotiable honesty requirement underneath all four: whatever method you choose, disclose it plainly, because consumption retention is genuinely harder to pin down than seat-based retention, and a reader needs to know whether your "95% retention" is a TTM-smoothed number, a commitment-based number, or a raw point-in-time number — those three are not remotely comparable to each other, let alone to a seat-based peer.
The Renewal-Date vs Calendar-Period Question
There is a structural choice in how you *bucket* the retention measurement, and it materially changes what the resulting number means. Calendar-period cohorts group customers by a fixed window — everyone active on January 1 is the cohort, re-measured on December 31. It is simple, it aligns cleanly with the fiscal year and the board calendar, and it is what the overwhelming majority of external reporting uses.
Its weakness is subtle but real: within that twelve-month window, customers are at wildly different points in their own contract lifecycles. A customer who renewed in November is barely "at risk" inside the calendar year — they just re-committed and their next decision is eleven months away.
A customer whose contract happens to end in March faces a genuine, consequential renew-or-leave decision squarely inside the window. Calendar-period retention therefore blends customers who actually had a renewal event with customers who did not face one at all, which can muddy the read on how well your renewal motion is actually performing.
Renewal-date cohorts instead group customers by *when their contract actually comes up for renewal* — the Q2 renewal cohort is every customer whose contract expires in Q2, and you measure what fraction of *that specific ARR* actually renewed, contracted, or churned. This is a much purer measure of *renewal performance*, because by construction every customer in the cohort genuinely faced a renew/don't-renew decision in the period being measured.
It is the better operational metric for the renewals team, gives CS a clean and fair scoreboard, and is the cleaner read on contract-level retention behavior. Its weakness: it does not map neatly onto a calendar or a fiscal quarter, and it structurally ignores mid-term contraction and expansion, which happen off-renewal-date.
Most mature companies therefore run both in parallel: renewal-date cohorts to manage, forecast, and compensate the renewals motion, and calendar-period cohorts for the board-facing annual GRR/NRR that investors expect and that ties to the fiscal year. As always, the binding requirement is to be explicit about which one any given number is — a renewal-cohort GRR and a calendar-cohort GRR for the very same company over the very same year will differ, sometimes by several points, and a reader who does not know which lens they are looking through will confidently draw the wrong conclusion.
5 Real Public-Company Examples
Public SaaS filings show just how much retention *definitions* vary even among genuinely elite companies — and that variation is the whole lesson: there is no single SEC-mandated definition of net revenue retention, so each company discloses its own construction, and any honest comparison requires actually reading the footnotes.
Snowflake reports a net revenue retention rate that has been famously, almost legendarily high — peaking around 178% in its hyper-growth phase and settling toward the mid-120s to low-130s as it scaled and the law of large numbers took hold — calculated on a trailing-twelve-month basis for customers present twelve months prior; because Snowflake is fundamentally consumption-based, its NRR is driven by usage growth, and the company is explicit that the metric reflects consumption rather than seat expansion.
Datadog has reported sustaining NRR above 130% for many consecutive quarters, defined on its existing-customer base measured year over year; Datadog's expansion is driven both by customers adopting additional products from a large and growing portfolio (it cross-sells aggressively across observability, security, and more) and by underlying usage growth, and it discloses NRR as a trailing metric.
HubSpot reports a dollar-based net revenue retention and also discusses gross retention, and notably HubSpot's NRR sits closer to 100-110% — visibly lower than infrastructure peers — precisely because it serves a large SMB and mid-market base that carries exactly the structural churn drag the benchmark sections described; HubSpot's disclosure is a useful example of an *honest mid-market number* rather than a flattering enterprise one.
Monday.com reports net dollar retention *segmented* — it discloses a meaningfully higher NRR for its larger customers (the 10+ user band, and higher still for its biggest accounts) than for its overall blended base, which is a textbook public-market illustration of the segment-monotonicity principle that larger customers expand more.
Bill.com (Bill Holdings) reports retention for a payments-and-spend-management business where the metric necessarily blends software-subscription revenue with transaction and payment-volume revenue, which makes its retention disclosure a valuable example of how a hybrid software-plus-payments model has to first define what "revenue" even *is* before it can define retention on top of it.
The lesson across all five companies: identical metric name, materially different definitions — different measurement windows, consumption versus seat, segmented versus blended, and different answers to what counts as revenue. Always read the definition; never compare two companies' NRR without reading both footnotes side by side.
The Board / Investor Reporting Standard
When retention goes in front of a board or an institutional investor, the bar is higher than merely "technically correct" — it is *credible, consistent, and reconciled.* The specific cuts a board should always see: GRR and NRR both, never NRR alone, because NRR alone is the number a struggling company shows; segmented by customer tier (SMB / mid-market / enterprise) so the very different segment dynamics are visible rather than blended into mush; logo and dollar retention both, so concentration is not hidden; a trend line of at least eight quarters so the board is reacting to direction and slope rather than to a single possibly-noisy point; and, ideally, the cohort triangle, so they can see for themselves whether the blended headline is a stable equilibrium or a number quietly drifting downward.
The rigor standard here is GAAP-adjacent — not because retention is itself a GAAP metric (it is explicitly not), but because a serious board rightly expects the same *discipline* GAAP imposes: a written definition, consistent application period over period, reconciliation back to the audited financials, and footnoted treatment of every edge case (FX normalization, M&A'd customers, usage variance, price increases, win-backs).
The credibility cost of a sloppy or shifting definition is severe, and it is asymmetric. If a company shows 120% NRR in Q1 and 108% in Q2, and the drop turns out to be a *definition change* rather than a real business change, the board will not simply discount that one quarter — they will retroactively discount *every retention number the company has ever shown them*, and they will demand independent verification from that point forward.
Diligence teams in fundraising and M&A specifically probe for definition stability precisely because they have been burned; a company caught having quietly redefined its retention metric mid-stream takes a real haircut on its valuation multiple. The reverse is also, encouragingly, true: a company that walks into the room with a modest-but-honest 91% GRR, a clear written definition, a clean reconciliation bridge to billing, and eight unbroken quarters of consistently measured history *earns trust* — and earned trust on a core metric is worth more, in both fundraising and exit, than a flattering number that cannot survive scrutiny.
The standard, compressed into one line: show both metrics, segment them, trend them, reconcile them, define them in writing, and never, ever change the definition without flagging it loudly and restating the history.
Setting Up The Retention Dashboard
A retention dashboard is not a chart — it is a governed, owned, monthly-cadenced *system*, and treating it as a chart is how companies end up with three conflicting retention numbers floating around the building. The fields it must contain: starting ARR for the cohort at T0; ending ARR for that same frozen cohort at T0+N; the full ARR walk (starting + new + expansion − contraction − churn = ending); GRR and NRR, with the cap on GRR and the no-cap on NRR both correctly enforced; logo GRR and logo NRR alongside the dollar versions; all of the above segmented by tier (SMB / mid-market / enterprise) and, ideally, also sliceable by product line, region, and acquisition channel; the SaaS Quick Ratio; the voluntary-versus-involuntary churn split with reason codes; and the documented variance bridge to the billing system.
The cohort views it must offer: the headline annual-cohort number, the monthly-cohort trend line, the full cohort triangle, and the renewal-date cohort view that the renewals team manages against. The cadence: the dashboard refreshes monthly, on a fixed and published close calendar, and only *after* the billing reconciliation is complete — the official number is never published before finance has tied out the ARR walk.
A mid-month "live" or provisional version can absolutely exist for day-to-day operational use, but everyone must understand that the *official, board-grade* number is the monthly reconciled one. The owner: retention reporting needs a single, named, accountable owner — almost always sitting in RevOps or Finance — who owns the definition document, runs the monthly reconciliation, publishes the dashboard, and is the one person in the company who can answer "where exactly did this number come from" without hedging.
Shared ownership of the retention number means, in practice, no ownership, and no ownership is precisely what produces the divergent-numbers problem in the first place. That same owner also owns the definition document — the written, signed, and version-controlled artifact that specifies the cohort construction, the measurement window, the explicit treatment of every edge case, the designated source of truth, and the reconciliation process — and any change to that document is a versioned, dated, announced event, not a quiet edit.
A retention dashboard without a named owner and a written, versioned definition behind it is not a system at all; it is just a chart that the organization will, slowly and then suddenly, stop trusting.
Leading Indicators That Predict Retention
GRR and NRR are *lagging* indicators by construction — by the time the annual cohort number finally lands, the churn already happened, the renewal is already lost, and the cohort is already closed. The genuine operational value comes from the leading indicators that predict retention months, sometimes quarters, before it ever shows up in the headline metric.
Product usage is the single strongest predictor: depth (how many features the customer has actually adopted), breadth (how many distinct users are active), and — most importantly — trend (is usage rising, flat, or quietly decaying). A customer whose usage has been sliding for three straight months is a renewal at real risk regardless of how warm and happy they sounded on the last business review call, because behavior leads sentiment.
Health scores that blend usage, support history, engagement, and contract data into a single red/yellow/green indicator are useful — but *only* if the underlying inputs are real and the composite score has been validated against actual churn outcomes; an unvalidated health score is worse than no health score, because it gets trusted while being wrong.
Support trends — ticket volume, ticket severity, time-to-resolution, and especially any spike in frustrated, repeated, or escalated tickets — predict churn reliably and early. Champion turnover is one of the most reliable and most chronically underweighted signals there is: when the specific person who bought you, sponsored you internally, and spent political capital on your selection leaves the customer, your renewal risk jumps sharply, because their replacement inherited a vendor relationship they did not choose and owes it nothing.
Monitoring your champion's LinkedIn status is not creepy; it is competent CS practice. Login frequency and recency — a customer whose admin has not logged in for thirty days, whose daily-active-user count is steadily sliding — is disengaging, and disengagement reliably precedes churn by a quarter or more.
Other strong, well-validated signals: invoice payment behavior (chronically late payments precede churn), executive-business-review attendance and engagement, NPS and CSAT trend (the *trend*, not the absolute level), onboarding milestone completion for newer accounts, and the contract-value-to-usage ratio (a customer paying for far more than they actually consume is a near-certain contraction at the next renewal).
The discipline that makes any of this matter: instrument these signals, *validate each one individually* against your own actual churn outcomes so you know which signals are genuinely predictive for *your* business and your segment rather than borrowed folklore, and then route at-risk accounts to a real intervention playbook *before* the renewal window opens — because a leading indicator that does not trigger a specific action is just an interesting chart.
The Forward-Looking Retention Forecast
The natural endpoint of leading indicators is a forward-looking retention forecast — predicting the next-twelve-months GRR and NRR *before* the period happens, so retention becomes a planning and steering tool rather than a quarterly postmortem. The build, step by step: start with the renewal base — every contract coming up for renewal inside the forecast window, each with its ARR and its specific renewal date, so you know exactly how much revenue is actually "in play" and when.
Then apply a risk-adjusted renewal probability to each contract, derived directly from the validated leading indicators: a healthy account with rising usage, an engaged and tenured champion, strong EBR attendance, and clean payment history gets a 95%+ renewal probability; an account with three months of declining usage, a recently departed champion, a cluster of escalated support tickets, and a late invoice gets marked at 50% or lower, and gets a name on it for intervention.
Next, layer in a contraction estimate for accounts showing specific downgrade signals — usage running well below contracted level, explicit budget-pressure signals from the account team, an upcoming reorganization — and, separately, an expansion forecast built bottom-up from the CS and account-management team's real expansion pipeline plus the usage-trending accounts that are visibly approaching their plan limits or seat caps.
Then sum it: forecast ending ARR equals the renewal-base ARR multiplied by the risk-adjusted renewal rates, minus the forecast contraction, plus the forecast expansion — and that ending figure, set against the starting cohort ARR, yields a forecast GRR (computed without the expansion term) and a forecast NRR (with it).
Validate the forecast against actuals every single period and recalibrate the probability model accordingly — a forecast that is never backtested drifts, quietly and inevitably, into confident fiction that nobody trusts but everybody presents. The payoff for getting it even roughly right is large: a forecast that is approximately accurate lets you *intervene while intervention is still possible* — if the model says next year's GRR is tracking to 86% against a 91% operating plan, you learn that in month two, not in month twelve, and you still have ten months to deploy CS capacity, launch the dunning project against involuntary churn, or accelerate the expansion motion.
Forecast retention is precisely the difference between retention as a scoreboard you read after the game and retention as a steering wheel you can actually turn.
5-Year Outlook
Over the next five years the *measurement* of retention changes nearly as much as retention itself, and the dominant driver is AI. First, AI efficiency creates an entirely new contraction vector that did not meaningfully exist before. As AI makes individual software users more productive, seat-based products face a genuine structural headwind: a customer who needed 100 licenses may rationally need only 70 when each remaining user is 1.4x as productive, or may need still fewer seats because AI agents are now doing work that humans on those seats used to do.
That shows up in the books as contraction in GRR and NRR *even when customer satisfaction is at an all-time high* — the product became *more* valuable per seat while the seat count fell. Companies will be forced to disaggregate "AI-efficiency contraction" from "dissatisfaction contraction" in their reason codes, because the two look identical in the formula but mean opposite things about underlying business health.
Second, this exact dynamic accelerates the broader shift away from pure seat-based pricing toward value-based, outcome-based, and consumption-based pricing metrics — and that shift, in turn, makes the clean classical GRR/NRR framework progressively harder to apply cleanly, pushing more and more companies toward TTM-smoothed, commitment-based, and outcome-based retention metrics, each carrying its own disclosure-complexity burden.
Third, AI dramatically improves the leading-indicator and forecasting side of the discipline: far richer usage telemetry, AI-analyzed support-ticket sentiment, automated champion-turnover detection scraped and inferred at scale, and properly trained ML renewal-probability models will together make forward retention forecasts genuinely accurate for the first time, shifting retention management decisively from reactive to predictive.
Fourth, expect mounting standardization pressure — investors and boards, increasingly tired of NRR numbers that cannot be compared across two companies without a footnote excavation, will push toward a more consistent disclosure standard, plausibly with the same eventual momentum that standardized other once-bespoke SaaS metrics.
**Fifth, and somewhat counterintuitively, the GRR-versus-NRR distinction becomes *more* important over this horizon, not less:** in a higher-interest-rate, growth-disciplined capital environment, the durability that GRR measures is valued more highly *relative to* the raw growth that NRR measures than it was in the cheap-capital 2021 era, when any NRR number above 120% was treated as a complete answer.
The five-year summary: the two formulas themselves stay exactly the same, but the inputs feeding them get messier, the forecasting built on top of them gets meaningfully smarter, and the market premium on the honest, durable, hard-to-game GRR number keeps quietly rising.
Final Framework
Here is the whole thing, compressed into something a team can actually standardize on and defend. The formulas: GRR = (starting ARR − contraction − churn) / starting ARR, hard-capped at 100% — it is the watertightness of the bucket. NRR = (starting ARR + expansion − contraction − churn) / starting ARR, uncapped — it is whether the bucket is net filling.
The only structural difference between them is the expansion term, and that single difference is the entire reason to track both rather than one. The cohort definition to standardize on: the cohort is every active paying customer as of T0; the denominator is that cohort's ARR at T0, frozen and never revisited; the numerator is that same cohort's ARR at T0+12 months; new logos signed anywhere in-period are categorically excluded from both halves; for GRR, no individual customer can contribute more than their own T0 amount; for NRR, per-customer expansion runs uncapped.
Measure annual cohorts for the board scoreboard, monthly cohorts for the operational steering wheel, and reconcile the two. The diagnostic decision tree: always compute GRR and NRR together and locate yourself on the 2x2 — high NRR with low GRR means stop celebrating and go fix churn, because expansion is masking it and the NRR depends on a few whales; low NRR with high GRR means the retention is genuinely fine and the real work is fixing a broken expansion engine; both low is a product-market-fit crisis that supersedes every other initiative on the roadmap; both high means you have a category winner and the job is to protect it and watch concentration.
The dashboard spec: the full ARR walk; GRR and NRR with the cap and no-cap correctly enforced; logo and dollar versions of each; everything segmented by tier; the SaaS Quick Ratio; the voluntary-versus-involuntary churn split with reason codes; the cohort triangle; the eight-quarter monthly trend; and the documented billing-reconciliation bridge — all of it refreshed monthly *after* finance ties out the ARR walk, owned end-to-end by one named person in RevOps or Finance, and governed by a written, signed, version-controlled definition document.
Reconcile the CRM number to the billing number every month without exception. Show both metrics to the board, segment them, trend them, footnote the edge cases, and never change the definition silently. Do all of that, and your retention number stops being a vanity slide that flatters a deck and becomes the single most honest diagnostic instrument the company owns.
The Same Cohort Through Both Formulas
The GRR x NRR Diagnostic Matrix
FAQ
Why should GRR be hard-capped at 100% in reporting? GRR excludes expansion entirely, so it can only measure how much of your starting ARR you kept after contraction and churn. A number above 100% would imply negative churn, which does not exist. If your spreadsheet prints 101% GRR, you have a formula bug, not a great quarter.
What does a high-NRR, low-GRR reading actually mean? Read together as a 2x2, high NRR with low GRR means expansion from a few large accounts is masking a real churn problem underneath. The flattering NRR hides that you are losing logos and revenue at the base. It is the classic pattern where three whale accounts tripling spend offset 40 churned logos and push NRR to 110-115% while the business sits one renewal away from a cliff.
Why does measuring a fixed cohort matter so much? Both formulas share a denominator: the ARR of customers who existed at T0, frozen and re-measured 12 months later. New logos signed in-period must never enter either numerator or denominator. Putting new logos in the denominator is one of the most common errors that makes boardroom retention numbers meaningless.
In the worked $10M example, why is there an 18-point spread between GRR and NRR? The cohort started at $10.0M, with $600K contraction, $900K churn, and $1.8M expansion. GRR = (10.0 − 0.6 − 0.9) / 10.0 = 85%, while NRR = (10.0 + 1.8 − 0.6 − 0.9) / 10.0 = 103%. The entire 18-point gap is the $1.8M of expansion that GRR refuses to count and NRR includes.
What are the 2026 GRR and NRR benchmarks by segment? GRR runs roughly 80-88% for SMB, 88-92% for mid-market, and 92-95%+ for enterprise. NRR runs 95-105% for SMB, 105-115% for mid-market, and 115-130% for enterprise. You should reconcile these monthly against billing systems like Stripe, Chargebee, Maxio, or NetSuite so finance and RevOps quote the same number.
Sources
- Bessemer Venture Partners — State of the Cloud / Bessemer's Top 10 Laws of Cloud Computing — Foundational benchmarks and definitions for net revenue retention, gross retention, and the importance of net-negative churn. Https://www.bvp.com/atlas
- OpenView Partners — SaaS Benchmarks Report — Annual benchmark data for GRR and NRR segmented by customer size (SMB / mid-market / enterprise) and ARR band.
- KeyBanc Capital Markets (KBCM) SaaS Survey — Widely cited annual private-SaaS metrics survey including gross and net retention benchmarks by segment.
- SaaS Capital — Retention Benchmarks for Private SaaS Companies — Empirical GRR and NRR data showing the monotonic relationship between customer size and retention. Https://www.saas-capital.com
- Snowflake Inc. — SEC 10-K and 10-Q filings (NYSE: SNOW) — Disclosed definition and trend of net revenue retention rate for a consumption-based model, calculated on a trailing-twelve-month basis.
- Datadog Inc. — SEC 10-K and 10-Q filings (NASDAQ: DDOG) — Disclosed net revenue retention above 130 percent sustained across quarters, driven by multi-product adoption and usage growth.
- HubSpot Inc. — SEC 10-K filings (NYSE: HUBS) — Dollar-based net revenue retention disclosure for a predominantly SMB and mid-market base, illustrating segment-driven retention drag.
- Monday.com Ltd. — SEC 20-F filings (NASDAQ: MNDY) — Net dollar retention disclosed segmented by customer size, illustrating segment monotonicity.
- Bill Holdings Inc. — SEC 10-K filings (NYSE: BILL) — Retention disclosure for a hybrid software-plus-payments business model.
- a16z (Andreessen Horowitz) — "16 Startup Metrics" and "The Notorious GRR vs NRR" — Canonical explainers on the definitional difference between gross and net revenue retention.
- ChartMogul — SaaS Retention and Cohort Analysis Documentation — Methodology for cohort triangles, layer-cake charts, and monthly vs annual cohort measurement.
- Maxio (formerly SaaSOptics / Chargebee) — SaaS Metrics Guides — Billing-system-side methodology for computing ARR walks and reconciling to CRM-derived retention.
- Stripe — Billing and Revenue Recognition Documentation — Source-of-truth billing data structures for retention reconciliation. Https://stripe.com/docs/billing
- Salesforce — CPQ and Revenue Cloud Documentation — Contract object and renewal-opportunity data model for CRM-based retention calculation.
- HubSpot — Recurring Revenue and Deal-Based Revenue Tracking Documentation — Native deal/subscription model for retention measurement in HubSpot.
- Klipfolio / Mosaic / Causal — SaaS Metrics Definitions Libraries — Cross-referenced standard definitions for GRR, NRR, logo retention, and the SaaS Quick Ratio.
- David Skok — "For Entrepreneurs" SaaS Metrics 2.0 — Foundational framework for the SaaS Quick Ratio and the relationship between retention and growth efficiency.
- Gainsight — Customer Success and Health Score Methodology — Leading-indicator frameworks (usage, champion turnover, support trends) that predict retention.
- Bain & Company / Fred Reichheld — Net Promoter and Retention Economics — The economic case for why gross retention durability compounds disproportionately.
- Battery Ventures / ICONIQ Growth — Growth and Efficiency Reports — Benchmark data on GRR/NRR by ARR scale and the rising premium on durable retention in disciplined-growth environments.
Numbers
The Two Formulas
- GRR = (starting ARR − contraction − churn) / starting ARR — capped at 100%
- NRR = (starting ARR + expansion − contraction − churn) / starting ARR — uncapped
- Only structural difference: NRR includes the expansion term, GRR excludes it
Worked Example (10.0M Starting Cohort)
- Starting ARR (fixed T0 cohort): $10.0M
- Churn (full logo loss): −$0.9M
- Contraction (downgrades, seat cuts, renewal discounts): −$0.6M
- Expansion (upsell, cross-sell, seat adds): +$1.8M
- GRR = (10.0 − 0.6 − 0.9) / 10.0 = 8.5 / 10.0 = 85%
- NRR = (10.0 + 1.8 − 0.6 − 0.9) / 10.0 = 10.3 / 10.0 = 103%
- GRR-to-NRR spread on this cohort: 18 points
GRR Benchmarks by Segment (2026)
- SMB: ~80-88% (structural 12-20% churn drag from business failure, owner turnover, budget loss)
- Mid-market: ~88-92% (90%+ is healthy)
- Enterprise: ~92-95%+ (best-in-class 95-97%, elite clears 97%)
- Pattern: monotonic — larger customer, higher GRR
NRR Benchmarks by Segment (2026)
- SMB: ~95-105% (limited expansion room + churn drag keeps it near 100%)
- Mid-market: ~105-115% (110%+ is strong)
- Enterprise: ~115-130% (best-in-class 125-135%, a few leaders sustain 140%+)
- Pattern: monotonic — larger customer, more expansion, higher NRR
Healthy vs Deceptive Enterprise Profile
- Healthy enterprise: ~94% GRR + ~122% NRR
- Deceptive (looks healthy): ~84% GRR + ~121% NRR — nearly same NRR, churning base
- High NRR + low GRR example: 118% NRR / 82% GRR — expansion masking churn
- Low NRR + high GRR example: 99% NRR / 94% GRR — broken expansion engine
- Both low (crisis): 98% NRR / 80% GRR
- Both high (category winner): 95% GRR / 125% NRR
Logo vs Dollar Retention
- Logo GRR = (logos at start − logos churned) / logos at start
- Example split: 80% logo GRR / 95% dollar GRR — small-account churn, durable revenue
- Inverse danger: 95% logo / 80% dollar — keeping small accounts, losing whales
SaaS Quick Ratio
- Quick Ratio = (new ARR + expansion ARR) / (churned ARR + contracted ARR)
- Above 4: excellent (early-stage)
- 2-4: solid
- Below 2: warrants scrutiny
- Below 1: the leaky bucket is winning
Cohort Measurement Windows
- Annual cohort: customers at start of 12-month window, measured at end — board/investor standard, but rearview
- Monthly cohort rolled up: each month's cohort measured 1 month later, chained or TTM — earlier signal, smoothing effect
- Best practice: annual as headline, monthly as leading indicator, reconcile the two
Public Company NRR Reference Points
- Snowflake: peaked ~178% in hyper-growth, settled toward mid-120s/130s — TTM, consumption-based
- Datadog: sustained above 130% across many quarters — multi-product + usage driven
- HubSpot: closer to 100-110% — SMB/mid-market base with structural churn drag
- Monday.com: discloses higher NRR for larger customers than overall base
- Bill.com: hybrid software-plus-payments retention definition
Common Calculation Mistakes
- New logos in the denominator/numerator (turns retention into growth)
- Mixing monthly and annual windows
- Counting reactivations/win-backs as expansion (it is new/win-back ARR)
- Not capping GRR at 100% (a breach means a formula bug)
- Treating renewal discounts as "pricing" instead of contraction
Boundary Decisions
- New logos in-period: exclude from both numerator and denominator
- Currency effects: normalize at T0 FX rates, or report as-is and disclose
- M&A'd customers: treat consolidated entity as one continuing logo, net the ARR
- Meta-rule: consistency and disclosure matter more than the specific choice
Churn Segmentation
- Voluntary churn: customer actively chose to leave (product/value problem)
- Involuntary churn: failed payment, expired card, billing-contact left (recoverable via dunning)
- Example: 6% total churn that is 4% involuntary = fixable ops problem
Dashboard / Governance
- Refresh cadence: monthly, after billing reconciliation ties out
- Owner: one named person in RevOps or Finance
- Definition document: written, signed, versioned — changes are announced events
- CRM-to-billing reconciliation: monthly ARR walk tie-out with documented bridge
Counter-Case: When The Retention-Definition Obsession Becomes The Problem
Everything above argues for rigor — fixed cohorts, written definitions, reconciled numbers, segmented benchmarks. That rigor is correct and necessary. But there is a real failure mode on the other side: teams that turn retention measurement into an end in itself, and in doing so make worse decisions than a team using a rougher number would.
Here is the honest counter-case.
Counter 1 — Definition obsession becomes analysis paralysis. There is a point past which arguing about whether a renewal price increase counts as expansion, or whether an M&A'd customer is one logo or two, stops generating insight and starts generating meetings. Some RevOps and finance teams spend more hours adjudicating definitional edge cases than they spend acting on what the metric tells them.
The edge cases — FX normalization, M&A netting, the price-increase question, usage-variance materiality thresholds — each affect the headline number by tenths of a point in most companies. A team that has spent six weeks perfecting the treatment of three M&A'd customers, while its GRR sat at 82% the whole time, optimized the wrong thing.
The directional truth — "we are losing too much revenue from the base" — was available in week one. Past a reasonable threshold of rigor, additional definitional precision has near-zero decision value.
Counter 2 — The metric is technically right but the cohort is too small to mean anything. Retention is a statistical measurement, and statistics need sample size. A company with 40 customers, or a segment with 12 customers, or an early-stage startup measuring its first annual cohort, can compute a perfectly correct GRR and NRR — and that number can swing 15-25 points based on the behavior of *one or two accounts.* A 78% GRR that is really "one of our nine enterprise accounts churned" is not a retention trend; it is a single event wearing a statistic's clothing.
Teams that treat a small-sample retention number with the same authority as a large-sample one will overreact to noise — restructuring the CS team, rebuilding onboarding, panicking the board — when the honest answer is "we do not have enough customers yet to have a retention *rate*; we have a list of what happened to each of them." For small cohorts, the named-account narrative is more informative than the percentage, and pretending otherwise is false precision.
Counter 3 — Retention looks fine while the business is still failing. This is the most dangerous one. GRR and NRR measure the *existing base.* They are, by construction, blind to the new-logo motion. A company can post 93% GRR and 116% NRR — genuinely excellent retention numbers — and be dying, because new-logo acquisition has collapsed.
Retention metrics on a shrinking-but-loyal base look beautiful right up until the base is too small to sustain the company. A founder or board that fixates on the retention dashboard because it is green can completely miss that the top of the funnel has fallen out. Retention is necessary but not sufficient: a healthy retention number on a business with no new-logo growth is a well-measured slow death.
The retention metric did its job perfectly and still told you almost nothing about whether the company will exist in three years.
Counter 4 — Definitional purity matters less than directional trend. A company that has measured retention *slightly wrong but consistently* for eight quarters has something genuinely valuable: a trend line. It can see whether the number is improving or degrading, and that direction is usually the actionable signal.
A company that finally "fixes" its definition in Q9 has a methodologically superior number — and a broken time series, because the new number is not comparable to the old eight. There is a real tradeoff between *accuracy* and *continuity*, and teams routinely undervalue continuity.
If your definition is imperfect but stable, the cost of "fixing" it is the loss of your trend, and the trend is often worth more than the fix. The right move is frequently to *keep* the imperfect-but-consistent definition for the trend line and run the "better" definition in parallel until you have enough history on the new one to switch — not to break the time series in pursuit of purity.
Counter 5 — The metric can become a target and get gamed. Once GRR and NRR are board metrics tied to comp, the organization optimizes them — and not always honestly. Renewal discounts get reclassified as "pricing" to keep them out of contraction. Win-backs get folded into expansion.
Shaky accounts get a one-month courtesy extension so they fall into next period's cohort. Soft churns get re-papered as "pauses." None of this is necessarily fraud; it is the ordinary gravitational pull of an incentivized metric. The more weight you put on the retention number, the more pressure there is on the definition's soft edges — which is an argument for the rigor and the named owner from the main section, but also a caution: a retention number with high stakes attached needs *adversarial* review, not just careful construction.
Counter 6 — Over-instrumented leading indicators create false confidence. The leading-indicator and forecasting apparatus — health scores, usage telemetry, renewal-probability models — is genuinely valuable, but it can also manufacture a feeling of control that the data does not support.
A health score that has not been backtested against actual churn is worse than no health score, because it gets trusted. A renewal forecast that has not been validated against actuals is a number that *looks* like rigor and *functions* like a guess. Teams that build elaborate predictive retention machinery without continuously validating it against outcomes end up steering by an instrument that is not calibrated — and the elaborateness of the dashboard makes everyone *more* confident, not less, which is exactly backwards.
The honest synthesis. Use the rigorous framework — it is correct, and the main section means every word of it. But hold it with the right grip. The purpose of measuring retention precisely is to *make better decisions faster*, and there are recognizable points where additional precision stops serving that purpose: when the cohort is too small for a rate to be meaningful, when definitional debate has displaced action, when the retention dashboard is so green it is hiding a new-logo collapse, when fixing the definition would destroy a more-valuable trend, and when the metric's stakes have started bending its own definition.
The discipline is not "measure retention as precisely as possible." The discipline is "measure it precisely enough to act, keep it consistent enough to trust the trend, segment it honestly, never let it stand in for the new-logo motion, and stay suspicious of your own number." A team that obsesses over the third decimal place of NRR while the business burns has not been rigorous — it has just been precise about the wrong thing.
Related Pulse Library Entries
- q9501 — How do you start a bookkeeping business in 2027? (Finance-operations adjacency; ARR-walk discipline parallels.)
- q9601 — How do you start a fractional CFO business in 2027? (The fractional CFO role owns exactly this retention-reporting standard.)
- q9602 — How do you start an outsourced controller business in 2027? (Controller-level reconciliation between CRM and billing systems.)
- q9603 — How do you start a tax preparation business in 2027? (GAAP-adjacent rigor and definitional consistency parallels.)
- q9604 — How do you start a financial advisor business in 2027? (Client-facing metric communication and credibility standards.)
- q1899 — What replaces SDR teams if AI agents replace SDRs natively? (New-logo motion context — the funnel that retention metrics are blind to.)
- q9701 — What is the best practice management software for bookkeeping firms? (Tooling and dashboard ownership parallels.)
- q9801 — What is the future of bookkeeping in 2030? (Long-horizon outlook on finance-metric standardization.)
- q9802 — How will AI change bookkeeping by 2030? (AI's effect on measurement, parallel to AI's effect on retention measurement.)
- q9505 — How do you scale a bookkeeping firm past $500K revenue? (Retention economics for a services book of business.)
- q9510 — How do you sell a bookkeeping firm? (Diligence scrutiny of retention/revenue-durability metrics.)
- q9502 — How do you start a CPA firm in 2027? (Audit-grade reconciliation discipline.)
- q9706 — How do you handle 1099 filing season? (Period-boundary and cutoff discipline parallels.)
- q9705 — How do you prep tax packages for CPAs? (Reconciliation bridge and source-of-truth documentation parallels.)
- q1946 — How do you start a real estate investing business in 2027? (Cohort-of-assets thinking parallels cohort-of-customers thinking.)
- q9605 — How do you start an enrolled agent practice in 2027? (Definitional-consistency and documentation-standard parallels.)