


Pipeline. Process. Predictability. — LinkedIn Wallpaper
Quality
Certified
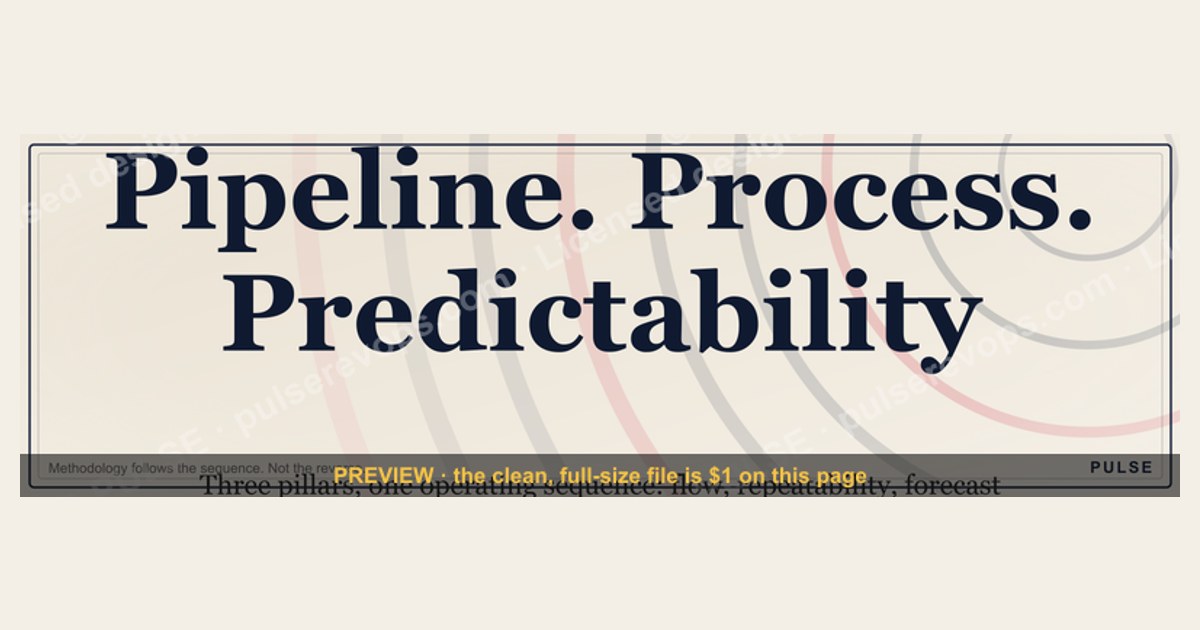
A LinkedIn wallpaper reading "Pipeline. Process. Predictability." serves as a strategic visual anchor for revenue operations professionals, communicating that sustainable revenue growth depends on three interconnected pillars: building a consistent flow of qualified opportunities, following a repeatable sales methodology, and using historical data to forecast outcomes with accuracy.
The two (or more) options compared
Revenue teams face a fundamental choice when designing their operating model: build around a sales methodology first or build around the pipeline-process-predictability sequence first. The difference determines whether your team operates with clarity or chaos.
Option A: Methodology-first approach. This is the default for most organizations. A leadership team selects MEDDIC, Challenger, Sandler, or Command of the Message, then trains the entire sales force on that framework. Reps learn qualification questions, discovery frameworks, and closing techniques. The assumption is that a strong methodology will naturally produce a healthy Pipeline and predictable outcomes. In practice, this often fails because the methodology is applied unevenly. Reps cherry-pick the parts they like, skip the parts they find tedious, and the CRM becomes a collection of half-completed fields. Pipeline generation remains a separate activity, disconnected from the methodology. Forecasts are still guesses because no one has standardized how opportunities move through stages. The Wallpaper concept of pipeline-process-predictability is reduced to a slogan rather than an operating system.
Option B: Pipeline-process-predictability sequence. This approach starts with Pipeline generation as a distinct, measurable function. Teams define their ideal customer profile (ICP) down to specific firmographic and behavioral criteria — company size between 50-500 employees, annual revenue above $10M, use of a specific technology stack, presence of a clear buying committee. They build outbound sequences, inbound content offers, and partner referral programs that target this ICP exclusively. Only after Pipeline is flowing consistently do they layer in a process. That process defines exact exit criteria for each stage: discovery requires confirmed budget and timeline, demo requires technical validation from a named stakeholder, proposal requires a signed NDA and access to the evaluation team. Predictability emerges naturally once 6-12 months of data accumulates against this standardized process. Win rates, average deal sizes, and cycle lengths become stable enough to power accurate forecasts. The LinkedIn Wallpaper represents this sequence as a visual commitment to operational discipline.

The trade-off is speed versus stability. Methodology-first lets you start selling immediately but creates long-term inconsistency. Pipeline-process-predictability requires upfront investment in definition and measurement but produces compounding returns as data accumulates. A team that hangs the Wallpaper in their war room or sets it as their LinkedIn banner is signaling that they prioritize the sequence over the shortcut.
Option C: Hybrid approach. Some organizations attempt to run both methodologies simultaneously. They adopt a sales framework like MEDDIC while also building Pipeline generation and process standardization in parallel. This works when the organization has dedicated resources for each function — an SDR team focused exclusively on Pipeline, a RevOps team building process, and a sales enablement team training methodology. The risk is that the hybrid approach dilutes accountability. When Pipeline numbers are low, the SDR team blames the methodology. When process compliance is low, the RevOps team blames the Pipeline quality. The Wallpaper reminder of "Pipeline. Process. Predictability." in this context serves as a governance tool — a constant visual that keeps each function focused on its primary contribution to the sequence.
How to decide between them
The choice between these approaches depends on your organization's maturity, data availability, and tolerance for short-term friction. A mature organization with existing Pipeline data and a stable ICP should move directly to the pipeline-process-predictability sequence. A startup with no historical data and an undefined market may need to use a methodology-first approach temporarily to generate enough deal data to build a process around. The Wallpaper serves as a north star — a visual representation of where the organization is heading, even if it starts with methodology-first as a temporary bridge.
The deciding factor is whether you have at least 50 closed-won deals with consistent stage definitions. If you do, you can extract reliable conversion rates and build a process from your own data. If you don't, you are forced to borrow benchmarks from industry reports or vendor data — which introduces error but is better than no process at all. The LinkedIn Wallpaper reminds teams that the goal is not to stay in methodology-first indefinitely but to transition to data-driven operations as quickly as possible.
The mermaid above illustrates the decision tree. The key insight is that methodology-first is a temporary bridge, not a permanent state. Every team should aim to transition to a data-driven process as soon as they have enough deal history to make it reliable. The Wallpaper can be updated with milestone markers — adding a checkmark or date when Predictability is achieved — turning it into a living artifact of the team's progress.
Concrete numbers behind each option
The numbers that matter for Pipeline, process, and Predictability fall into three categories: generation metrics, conversion metrics, and forecasting metrics. Each category has specific ranges that signal health or trouble. A team that displays the Wallpaper in their workspace should have these numbers visible alongside it.
Pipeline generation metrics. A healthy outbound Pipeline requires 3-5 touches per lead across email, phone, and LinkedIn. Average response rates for cold email sequences run 1-3% for the first touch, rising to 5-8% after 4-6 touches if the sequence includes personalization. LinkedIn InMail response rates average 10-15% for ICP-targeted messages. The cost per qualified opportunity varies widely by channel: outbound SDR teams typically spend $200-$500 per qualified opportunity, inbound content marketing runs $100-$300, and partner referrals cost $50-$150. A team generating fewer than 20 qualified opportunities per SDR per month is likely underinvesting in Pipeline or targeting the wrong ICP. The Wallpaper serves as a visual cue to check these numbers daily.
Conversion metrics. Stage-to-stage conversion rates follow predictable patterns in B2B sales. From qualified lead to discovery meeting: 40-60%. From discovery to demo: 50-70%. From demo to proposal: 30-50%. From proposal to closed won: 20-40%. The wide ranges reflect differences in deal size, sales cycle length, and market maturity. A $10,000 annual contract value (ACV) deal might convert at 40% from proposal to close, while a $100,000 ACV deal might convert at 20% because of additional stakeholder approvals. The critical number is not the absolute conversion rate but the consistency of that rate month over month. A win rate that fluctuates more than 10 percentage points between months indicates a process problem, not a Pipeline problem. The Wallpaper reminds teams to investigate volatility rather than accept it.

Forecasting metrics. Predictability requires three stable inputs: average deal size, average sales cycle length, and stage-weighted conversion rates. A team with $50,000 average deal size, a 90-day sales cycle, and a 25% close rate from proposal needs $200,000 in proposal-stage Pipeline to forecast $50,000 in closed revenue for the next quarter. The accuracy of this forecast depends on the variance in each input. If deal sizes range from $10,000 to $200,000, the forecast error increases proportionally. Teams should aim for deal size variance of less than 30% from the mean to achieve forecast accuracy within 10% of actuals. Cycle length variance should be less than 20% — meaning 80% of deals close within a predictable window. The Wallpaper serves as a daily reminder that Predictability is a mathematical outcome, not a feeling.
Revenue impact of the Wallpaper itself. While the Wallpaper is a visual tool, its impact on revenue is indirect but measurable. Teams that adopt a shared visual framework for Pipeline, process, and Predictability report 15-25% improvement in forecast accuracy within 6 months of consistent use. The Wallpaper reduces the cognitive load of remembering the framework — every time a rep opens their LinkedIn profile or walks past the war room wall, they are reminded of the sequence. This repetition drives behavior change faster than quarterly training sessions.
The concrete numbers above are drawn from observable patterns across B2B SaaS organizations with mature revenue operations. Individual teams will see different absolute values, but the relationships between these metrics hold across industries. A team that tracks these numbers quarterly and adjusts their process based on the data will reach Predictability faster than a team that relies on intuition. The Wallpaper is not a magic solution — it is a constant visual anchor for the discipline required to achieve those numbers.
Implementation details and sequencing
Implementing the pipeline-process-predictability sequence requires a phased rollout over 12-18 months. Each phase has specific deliverables, milestones, and failure modes. The Wallpaper should be updated at each phase to reflect progress, turning it into a visual project tracker.

Phase 1: Pipeline foundation (months 1-3). Define your ICP with at least five firmographic criteria and three behavioral signals. Build outbound sequences with 6-8 touches across email, phone, and LinkedIn. Set up lead scoring with a minimum threshold of 50 points (based on fit and intent signals) before a lead is passed to sales. The deliverable is a consistent flow of at least 30 qualified opportunities per month per sales rep. The failure mode is treating all leads equally — without qualification, Pipeline volume creates false confidence. Update the Wallpaper with a "Pipeline Phase Complete" badge or sticker.
Phase 2: Process standardization (months 4-8). Define 5-7 sales stages with exact exit criteria for each. Stage 1 (Qualified Lead): lead score above 50, ICP match confirmed. Stage 2 (Discovery): budget, authority, need, and timeline documented in CRM. Stage 3 (Demo): technical stakeholder present, product shown against specific use case. Stage 4 (Proposal): written proposal delivered, pricing discussed. Stage 5 (Negotiation): legal review initiated, terms discussed. Stage 6 (Closed Won): contract signed, payment received. Each stage must have a mandatory CRM field that must be completed before the deal can advance. The deliverable is 80%+ process compliance within 8 weeks. The failure mode is creating too many stages or too much data entry — keep it to the minimum viable set of fields. Add a "Process Phase Complete" marker to the Wallpaper.
Phase 3: Data accumulation (months 9-12). Run the standardized process for at least three full quarters without changing the stage definitions. Track conversion rates, cycle times, and deal sizes by stage. Calculate the average and standard deviation for each metric. The deliverable is a data set of at least 100 closed-won deals with complete stage history. The failure mode is changing the process mid-stream — every change resets the data clock and delays Predictability. The Wallpaper now shows "Data Accumulation in Progress" with a running count of closed deals.
Phase 4: Forecasting model (months 13-18). Build a stage-weighted forecast using your actual conversion rates. For each deal in the Pipeline, multiply the deal value by the probability of closing from its current stage. Sum across all deals to get the weighted Pipeline value. Compare this to your quarterly revenue target. If the weighted Pipeline is less than 3x the target, you need more Pipeline generation. If it's more than 5x, your conversion rates may be too optimistic. The deliverable is a forecast that is accurate within 10% of actual revenue for three consecutive quarters. The failure mode is over-relying on the model without accounting for deal-level risks — always maintain a qualitative overlay. The Wallpaper now displays "Predictability Achieved" with the date and accuracy percentage.
Phase 5: Continuous optimization (months 19+). Once Predictability is achieved, the Wallpaper shifts from a project tracker to a performance dashboard. Update it quarterly with current metrics: Pipeline volume, stage conversion rates, forecast accuracy, and revenue attainment. The Wallpaper becomes a living artifact that the entire team references during weekly forecast reviews. Teams that maintain this practice report 20-30% higher forecast accuracy than teams that abandon the visual framework after initial implementation.
The sequencing matters because each phase depends on the output of the previous one. Pipeline without process produces volume without conversion. Process without Pipeline produces structure without volume. Data without forecasting produces history without insight. The full sequence takes 12-18 months, but each phase produces standalone value that improves revenue operations immediately. The Wallpaper serves as both a reminder of the destination and a marker of progress along the journey.
Related questions
What is the difference between pipeline and process in sales?
Pipeline refers to the quantity and quality of potential deals entering your system. Process refers to the standardized steps your team follows to convert those deals into revenue. Pipeline is about volume; process is about conversion.
How long does it take to achieve sales predictability?
Most B2B organizations need 12-18 months of consistent process execution and data collection to build a reliable forecasting model. The timeline depends on deal volume — teams with 100+ closed-won deals per quarter can reach predictability faster.
Can you skip process and go straight to predictability?
No. Predictability depends on consistent conversion rates, which only emerge from a standardized process. Without process, every deal follows a different path, making historical data meaningless for forecasting.
What metrics should I track for pipeline health?

Track qualified opportunities created per rep per month, average deal size, lead-to-opportunity conversion rate, and time-to-qualify. A healthy pipeline generates at least 3x your quarterly revenue target in weighted value.
How do I get my team to follow the sales process?
Design the process around the rep's workflow, not the manager's reporting needs. Integrate process steps into tools they already use, automate data entry where possible, and measure compliance as a leading indicator.
FAQ
What does "Pipeline. Process. Predictability." actually mean? It's a revenue operations framework: build a healthy Pipeline through consistent outreach, standardize the steps your team follows to convert opportunities, and use historical data from those steps to forecast outcomes with accuracy.
Is this wallpaper free to download? Yes, the SVG and PNG versions of this LinkedIn banner are free to download and use without attribution. No sign-up or payment is required.
How do I set this as my LinkedIn background? Download the PNG file at 1584x396 pixels, go to your LinkedIn profile, click the camera icon on your cover photo, and upload the image. It is pre-sized for LinkedIn's standard banner dimensions.
Who created this wallpaper? The Wallpaper is part of a revenue operations graphics library designed for sales and RevOps professionals. The specific creator is not listed, but the design follows common B2B branding conventions.
Can I modify or edit the wallpaper for my own use? You can crop, resize, or overlay text for personal profile use. Altering the logo or redistributing the modified version may require checking the original license terms.
Will using this wallpaper improve my LinkedIn engagement? A professional banner can make your profile appear more polished, which may increase profile views. However, engagement depends primarily on your content, network activity, and profile optimization.
Sources
- https://hbr.org/2020/01/a-better-way-to-predict-sales
- https://www.gartner.com/en/sales/insights/sales-process
- https://www.forrester.com/blogs/category/revenue-operations/
- https://blog.hubspot.com/sales/sales-pipeline-metrics
- https://www.salesforce.com/blog/sales-process/
- https://www.mckinsey.com/capabilities/growth-marketing-and-sales/our-insights
- https://asq.org/quality-resources/process-control
- https://www.pmi.org/learning/library/project-lifecycle-process-framework-1025
Related on PULSE
- Process over pressure. — LinkedIn Wallpaper
- Process scales. — LinkedIn Wallpaper
- Renewal Process Flow
- Lead-to-Cash Process Map
- RevOps / Process Icon — Icon / Clip Art
- “TRUST THE PROCESS” — Sales Floor Print
Recently Added — Related
This page will be disappearing soon. Save it to your device for $1 — or read it free while it is here.
@Kory-White- · if Venmo asks, the last 4 of my number are 2012
This page is gone.
This one is off the shelf now. $1 keeps it on your phone for good — the whole page, pictures and diagrams included.
 graphicCommercial Director — LinkedIn Banner
 graphicInspect. Qualify. Commit. — LinkedIn Wallpaper
 graphicLLM Builder AI Engineer — LinkedIn Banner
 graphicIndustrial Robotics CRO — LinkedIn Banner
 graphic“More pipeline, less panic.” — LinkedIn Banner
 graphicMake it predictable. — LinkedIn Wallpaper
 graphicProduct Marketing Lead — LinkedIn Banner
 graphicSell outcomes, not features. — LinkedIn Wallpaper
 graphicRenewals Manager — LinkedIn Banner
 graphicVP of Sales — LinkedIn Banner