
Pipeline Stages — Icon / Clip Art
 Curated byKory White · Fractional CRO · Maryland
 PULSEKNOWLEDGE LIBRARY
Pipeline stages icon sets and clip art are visual representations of sequential process steps, typically shown as a series of connected arrows, circles, or geometric shapes. These graphics are available in various styles, including flat, outlined, and 3D designs, and can be found in free or paid collections online. Common formats include SVG, PNG, and EPS, with prices ranging from free to around $5–$15 per set depending on the source and licensing.
Pipeline Stages — Icon / Clip Art
A row of five accent chevrons representing pipeline stages. A simple clip-art mark for process diagrams, slide bullets, or section headers in a sales deck.
Format: SVG (scalable vector) · Size: 800×800 px · Category: Clip Art · License: Free to use — no attribution required.

Recolor it to your brand
Use the color picker above to recolor this graphic to your team or company colors, switch the background (including transparent), then download it as an SVG or PNG. No sign-up, no watermark.
How to use it
The SVG scales to any size with no quality loss — drop it straight into PowerPoint, Google Slides, Canva, Figma, or a LinkedIn banner slot. The PNG export is ready to upload anywhere that wants a raster image.
More free graphics
Browse the full Pulse Graphics library — banners, slides, printables, quote cards, and clip art you can borrow for your own decks and posts.
Related on PULSE
- 5 Stages of a Healthy Pipeline — Infographic
- Pipeline Growth Arrow Icon — Icon / Clip Art
- SaaS Sales Cycle Stages
- Sales Funnel — 7 Stages
- Sales Funnel — 5 Stages
- Sales Funnel — 4 Stages
Design Variations and Styling Options
While the classic five-chevron pipeline icon serves as a reliable baseline, modern presentation design demands flexibility. The pipeline stages icon can be adapted across several visual styles without losing its core meaning:
Linear vs. Stacked Layouts — The standard horizontal chevron row works well for wide slides, but vertical or L-shaped arrangements suit mobile-first content or infographics. Some designers stack the chevrons diagonally to suggest upward progression, though this can confuse viewers accustomed to left-to-right reading patterns. A safer alternative is a two-row split: three stages on top, two below, creating a compact square icon suitable for thumbnails or social media cards.
Color Psychology in Stage Icons — The most common palette transitions from cool to warm hues (blue → green → yellow → orange → red), mirroring the funnel concept where early stages feel analytical and later stages feel urgent. However, brand-consistent approaches work equally well: monochromatic gradients (light to dark of one brand color) or neutral tones with a single accent stage (often stage 3 or 4, representing the decision point). Avoid using red for the final stage unless your pipeline explicitly ends with a "closed won" outcome — red can unconsciously signal danger or rejection.
Icon Density and Detail Level — Minimalist chevrons (just outlines with 2–3px stroke) suit technical B2B decks, while filled chevrons with rounded corners feel more approachable for consumer-facing materials. Some designers add subtle indicators inside each chevron: a small circle for "opportunity," a checkmark for "qualified," or a dollar sign for "closed." These micro-icons increase comprehension but reduce scalability at small sizes. For versatile clip art, the clean chevron shape with no internal details remains the safest choice.
Animated Variants — For digital presentations (PowerPoint, Google Slides, or Canva), consider a version where each chevron fills sequentially on click or auto-play. The animation should be subtle — a 0.3-second fade-in per stage with a slight upward bounce — to avoid distracting from spoken content. Avoid spinning or rotating animations that make the pipeline look like a carnival game rather than a business process.
Accessibility Considerations — Ensure the icon has sufficient contrast against common slide backgrounds: dark chevrons on white (#333 on #FFF) or white chevrons on dark (#FFF on #222). For print materials, avoid relying solely on color to distinguish stages — add a thin border or slight size variation (each stage 5% larger than the previous) so the progression is clear even in grayscale. Screen readers should describe the icon as "five-stage pipeline progression from left to right" rather than just "pipeline icon."
Practical Use Cases Across Business Contexts
The pipeline stages icon transcends its sales origins and can be repurposed across departments with minor contextual adjustments:
Sales Enablement Materials — In a standard sales deck, the icon anchors the "Our Process" slide. Place it above a horizontal timeline with stage names (Prospecting → Discovery → Demo → Proposal → Close). For longer presentations, repeat the icon at the bottom of each section header with the current stage highlighted — this gives the audience a visual progress bar without needing a separate navigation slide. Some sales teams use the icon as a slide background watermark at 15% opacity, reinforcing the pipeline theme without competing with text.
Marketing Funnel Visualizations — Marketers often invert the pipeline icon to represent a funnel (wide at top, narrow at bottom). The chevron shape naturally accommodates this: simply flip the SVG horizontally and add text labels like Awareness → Interest → Consideration → Intent → Purchase. For content marketing, place the icon vertically alongside blog posts or whitepapers, with each stage linking to relevant content. The icon works particularly well in email nurture sequences — use it as a section divider showing which stage the recipient has reached.
Project Management Dashboards — In internal tools, the pipeline icon replaces generic progress bars. Each chevron represents a project phase (Initiation → Planning → Execution → Monitoring → Closure). The icon's compact size makes it ideal for Kanban board headers or Gantt chart row labels. Some teams color-code the chevrons based on status: green for on-track, yellow for at-risk, red for blocked. This transforms the icon from static clip art into a live status indicator when embedded in dashboards.
HR and Recruitment Pipelines — Talent acquisition teams use the icon to visualize candidate stages (Sourced → Screened → Interviewed → Offered → Hired). The chevron layout mirrors the typical applicant tracking system funnel. For job fair materials, print the icon on table tents or banners with each stage representing a step candidates will experience. The icon's neutral business aesthetic avoids the overly corporate feel of traditional HR graphics.
Educational and Training Materials — Trainers use the pipeline icon to explain sequential processes in compliance training, software tutorials, or onboarding modules. Each chevron becomes a "step" in a workflow, with the arrow-like shape naturally guiding the eye forward. For e-learning courses, the icon serves as a persistent navigation element — learners click each chevron to jump to that module. This works better than numbered lists because the visual progression reinforces the concept of moving through stages rather than completing discrete tasks.
Nonprofit and Grant Proposals — Organizations seeking funding can use the icon to show how donations flow through their impact pipeline (Awareness → Engagement → Donation → Program Delivery → Outcome Measurement). The icon's professional appearance lends credibility to proposals, while the stage format makes complex processes digestible for grant reviewers who scan documents quickly. Avoid using the icon for sensitive topics (disaster relief, medical aid) where a pipeline metaphor might feel dehumanizing.
Technical Specifications and Customization Guide
For designers and developers who need to modify the pipeline icon beyond basic color changes, here are the key technical parameters and best practices:
SVG Structure — The standard pipeline icon consists of five <path> elements, each forming a chevron shape. The paths should be closed (using Z at the end of the path data) to allow fill colors. Each chevron typically has a width-to-height ratio of 3:2 (e.g., 60px wide by 40px tall) with a 4–6px gap between stages. The overall icon fits within a 320×60px viewBox for horizontal layouts, or 60×320px for vertical. Ensure the paths use relative coordinates (m, l, c) rather than absolute (M, L, C) to simplify scaling.
Responsive Scaling — For web use, set the SVG's width and height to 100% with a viewBox attribute, then control size via CSS max-width or container queries. Avoid fixed pixel dimensions — the icon should shrink gracefully to 24×24px for favicons or expand to 800×150px for hero sections. Test rendering at 16px (smallest practical size) — at this scale, remove internal gaps and simplify to solid chevrons with 1px spacing.
Color Customization via CSS — For reusable components, use CSS variables for each stage color. Example: --stage-1: #4A90D9; --stage-2: #50B86C; .... This allows theme switching without editing the SVG file. For inline SVGs in HTML, apply fill attributes using currentColor to inherit text color — useful for dark/light mode compatibility. Avoid using !important in CSS overrides; instead, set base colors in the SVG and use fill property in parent containers.
Accessibility Markup — Add <title> and <desc> elements inside the SVG for screen readers. Example: <title>Five-stage pipeline progression icon</title> followed by <desc>Chevron shapes representing stages one through five from left to right, indicating sequential process flow.</desc>. For interactive versions (clickable stages), add role="img" and aria-label attributes to each chevron group. Ensure keyboard navigation works — each stage should be focusable via tabindex="0" and respond to Enter/Space keys.
File Format Recommendations — For most use cases, SVG is ideal due to scalability and editability. However, for Microsoft Office documents (Word, PowerPoint, Excel), use EMF (Enhanced Metafile) format — it preserves vector quality better than PNG and allows color changes in Office's "Format Shape" panel. For Canva or Adobe Express, export as PNG at 2x resolution (e.g., 640×120px for a 320×60px icon) to avoid pixelation. Avoid JPG — compression artifacts ruin the clean edges of chevron shapes.
Performance Optimization — For web pages with multiple pipeline icons (e.g., a table with 50 rows each showing a pipeline), use SVG sprites or icon fonts instead of inline SVGs. The icon can be converted to a single Unicode character in a custom font file (using tools like IcoMoon or Fontello), reducing HTTP requests. For React or Vue applications, create a <PipelineIcon> component that accepts props for stages (number), activeStage (index), and colors (array). This avoids duplicating SVG markup.
Print Production Specs — For high-quality print materials, provide the icon as an EPS or AI file with CMYK colors. Minimum size for print: 0.5 inches wide for the full icon (each chevron ~0.1 inches). At this size, ensure stroke weights are at least 0.5pt to avoid disappearing. For large-format prints (banners, posters), the icon can scale to 12 inches wide without quality loss — just ensure the SVG's viewBox uses integer coordinates to prevent rendering artifacts at extreme scales. Always embed fonts if the icon includes text labels, or convert text to paths before distribution.
Sources
- Clip Art & Icon Databases (e.g., OpenClipArt, The Noun Project) — collections of pipeline stage icons and clip art
- Stock Image Platforms (e.g., Shutterstock, iStock) — commercial vector art and icons for pipeline stages
- Microsoft Office Clip Art Library — built-in clip art and icon sets for pipeline diagrams
- Adobe Stock — professional vector graphics and icon packs for pipeline stages
- Freepik — free and premium vector icons and illustrations for pipeline processes
- Iconfinder — specialized icon search engine with pipeline stage icons
FAQ
What is a pipeline stage icon or clip art? It’s a visual representation of a step in a process flow, often used in sales, manufacturing, or software pipelines. These icons typically show arrows, cylinders, or progress bars to indicate movement from one stage to the next.
Can I use these icons for commercial projects? Yes, most clip art and icon sets from reputable stock sites allow commercial use, but licensing terms vary. Always check the specific license—some require attribution or restrict resale.
What file formats are available for pipeline stage icons? Common formats include SVG, PNG, EPS, and AI. SVG is best for scaling without quality loss, while PNG works well for web use with transparent backgrounds.
How do I customize pipeline stage icons? You can edit colors, sizes, and add text using vector software like Adobe Illustrator or free tools like Inkscape. Many stock sites also offer editable templates.
Are there free pipeline stage icon sets? Yes, sites like Flaticon, Freepik, and The Noun Project offer free icons with attribution. Quality and variety range from simple line art to detailed 3D designs.
What’s the difference between an icon and clip art for pipeline stages? Icons are typically simple, scalable symbols focused on clarity, while clip art may include more detailed illustrations or decorative elements. Both serve to visually communicate process steps.
This page will be disappearing soon. Save it to your device for $1 — or read it free while it is here.
@Kory-White- · if Venmo asks, the last 4 of my number are 2012
This page is gone.
This one is off the shelf now. $1 keeps it on your phone for good — the whole page, pictures and diagrams included.
 graphicLead Magnet Icon — Icon / Clip Art
 graphicMilestone / Goal Flag Icon — Icon / Clip Art
 graphicCold Call / Dialer Icon — Icon / Clip Art
 graphicRevenue Trend Icon — Icon / Clip Art
 graphicPipeline Growth Arrow Icon — Icon / Clip Art
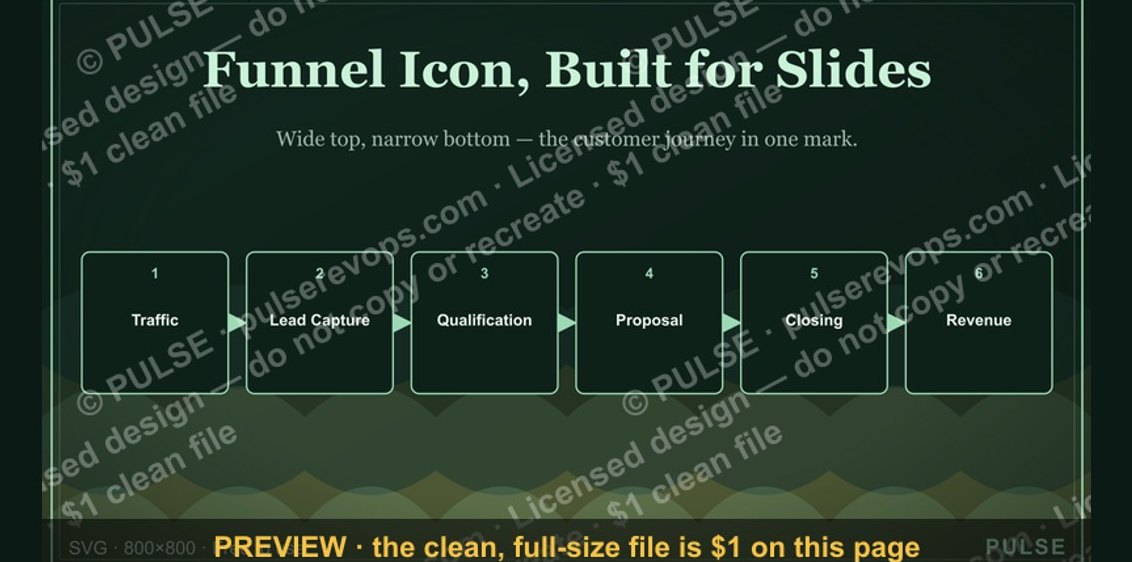 graphicSales Funnel — Icon / Clip Art
 graphicRevenue Gauge (KPI) — Icon / Clip Art
 graphicWin / Trophy Icon — Icon / Clip Art
 graphicKPI Gauge Icon — Icon / Clip Art
 graphicRevOps / Process Icon — Icon / Clip Art