
Sales Operations Lead — LinkedIn Banner
 Curated byKory White · Fractional CRO · Maryland
 PULSEKNOWLEDGE LIBRARY
A Sales Operations Lead banner should display your role title prominently, along with a concise value proposition such as "Driving Revenue Growth Through Process & Analytics." Use a clean, professional design with your company logo and a subtle background graphic that reflects data or sales metrics. Avoid cluttered text; instead, include your name, title, and a single call-to-action like "Let's optimize your sales strategy."
Sales Operations Lead — LinkedIn Banner

A dark, on-brand LinkedIn banner — "I make selling easier." over a "Systems Data Insight" line with a pulse motif. Put it on your profile to signal exactly what you do.
Format: SVG (scalable vector) · Size: 1584×396 px · Category: LinkedIn Banner · License: Free to use — no attribution required.
Recolor it to your brand
Use the color picker above to recolor this banner to your team or company colors, switch the background (including transparent), then download it as an SVG or PNG. No sign-up, no watermark.

How to use it
It scales cleanly to the LinkedIn cover slot (1584×396) — download the PNG and drop it straight onto your profile, or open the SVG in Canva, PowerPoint, or Figma to add your name and tweak the layout.

More free graphics
Browse the full Pulse Graphics library — banners, slides, printables, quote cards, and clip art you can borrow for your own decks and posts.



Related on PULSE
- Revenue Operations — Mission Banner
- Marketing Operations — LinkedIn Banner
- Revenue Operations — LinkedIn Banner
- The Sales Cycle: Lead to Closed-Won — Infographic
- “Ready to lead a sales team.” — LinkedIn Banner
- Sales Enablement Lead — LinkedIn Banner
Visual Hierarchy & Design Principles for Maximum Impact
A Sales Operations Lead LinkedIn banner serves as your digital storefront—it must communicate authority, clarity, and data-driven professionalism within the first three seconds of a profile visit. The most effective banners follow a clear visual hierarchy that guides the viewer’s eye from your value proposition to your call-to-action, all while maintaining brand consistency.
The Golden Ratio of Banner Elements
Your banner should allocate approximately 60% of the visual space to your core message (job title, key metrics, or value statement), 25% to supporting visual elements (charts, graphs, or icons), and 15% to your call-to-action or contact information. This distribution ensures that recruiters and hiring managers immediately grasp your role and impact without cognitive friction.
Color Psychology in Sales Operations Banners
Color choices dramatically influence perception. Deep blues (hex #1a237e to #1565c0) convey trust, stability, and analytical rigor—qualities essential for a Sales Operations Lead. Accent colors like burnt orange (#e65100) or emerald green (#2e7d32) can highlight key metrics or CTAs, drawing attention to your quantifiable achievements. Avoid using more than three primary colors; excessive color variety dilutes professionalism.
Typography Best Practices
Select two complementary fonts—one for headlines (bold, sans-serif like Montserrat or Roboto Condensed) and one for body text (clean, readable like Open Sans or Lato). Headline font size should range from 36-48pt for the job title, 24-30pt for supporting text, and 18-22pt for CTAs. Ensure minimum contrast ratios of 4.5:1 between text and background colors for accessibility compliance.
The 3-Second Rule for Recruiters
Recruiters spend an average of 6-7 seconds scanning a LinkedIn profile, with the banner being the first element processed. Design your banner so that within three seconds, a viewer can identify: (1) your role as Sales Operations Lead, (2) one key achievement metric (e.g., "30% revenue growth" or "20% pipeline acceleration"), and (3) your industry or specialization. This rapid information processing increases profile engagement by an estimated 40-60%.
Common Design Mistakes to Avoid
- Cluttered backgrounds that compete with text (use subtle gradients or single-color backgrounds instead)
- Overlapping elements that create readability issues (maintain 15-20px padding between all elements)
- Low-resolution images that appear pixelated (use 1584x396 pixel dimensions at 72 DPI minimum)
- Inconsistent spacing that looks amateurish (maintain uniform margins of 30-50px on all sides)
- Generic stock photography that fails to differentiate you (opt for custom graphics or data visualizations)
Data Visualization Techniques for Sales Operations Banners
Sales Operations Leads live and breathe data—your banner should reflect this analytical expertise through strategic data visualization elements that communicate impact without overwhelming the viewer.
The Power of Mini-Charts
Incorporate a single, simplified chart or graph that represents your most impressive achievement. A clean upward-trending line chart showing "22% quarter-over-quarter revenue growth" or a bar chart comparing "pre- and post-implementation sales cycle reduction" instantly communicates your value proposition. Keep these visualizations to 15-20% of the banner area—enough to be noticed, not enough to dominate.
Iconography Selection for Maximum Clarity
Choose 2-3 icons that represent your core competencies: a funnel icon for pipeline management, a gear icon for process optimization, or a bar chart icon for analytics. Icons should be line-art style (not filled) with consistent stroke widths of 2-3px. Position them near your job title or key metrics to create visual associations. For example, a funnel icon beside "Pipeline Optimization" reinforces the connection between your role and your impact.
Heat Map Principles for Attention Direction
Design your banner with an implied heat map—the upper-left quadrant typically receives the most attention in Western cultures. Place your most critical information (job title and primary achievement) in this zone. The lower-right quadrant receives the least attention, making it ideal for secondary information like contact details or company logo. This strategic placement ensures recruiters see your strongest selling points first.
Color-Coded Data Points
Use color coding to differentiate between data categories without adding text labels. For instance, use blue for revenue-related metrics, green for efficiency gains, and orange for customer-facing improvements. This creates a visual shorthand that communicates breadth of impact at a glance. However, include a brief text label for each data point to ensure accessibility for color-blind viewers (approximately 8% of male viewers).
Animated vs. Static Elements
LinkedIn banners cannot be animated, but you can create the illusion of motion through design techniques. Use gradient overlays that suggest data flow, directional arrows that guide the eye, or cascading bar charts that imply sequential improvement. These static representations of dynamic data maintain professional polish while hinting at your operational agility.
Real-World Data Visualization Examples
- Pipeline velocity: A speedometer-style gauge showing "15% faster deal progression"
- Forecast accuracy: A bullseye target with "92% forecast accuracy" in the center
- Process efficiency: A timeline graphic showing "40% reduction in quote-to-close time"
- Team impact: A stacked bar chart showing "12-person sales team supported"
Strategic Content Placement for Recruiter Engagement
Beyond aesthetics, your Sales Operations Lead banner must strategically position content to maximize recruiter engagement and profile conversion rates.
The CTA Placement Hierarchy
Place your call-to-action (CTA) in the lower-right quadrant—the least attention-grabbing area—but make it visually distinct through color contrast or a subtle button shape. Common CTAs include "Let's Optimize Revenue Operations," "Open to Sales Ops Roles," or simply your email address. Avoid using the word "contact" which feels transactional; instead, use action-oriented phrases that invite conversation.
Achievement Metrics That Convert
Include 2-3 quantifiable achievements with specific numbers and timeframes. The most compelling metrics for Sales Operations Leads include: revenue growth percentages (20-40% range), sales cycle reduction (15-30%), forecast accuracy improvements (85-95%), or team size supported (10-50+ reps). Avoid vague claims like "improved efficiency" without supporting numbers. Each metric should follow the formula: [Action] + [Metric] + [Timeframe] = [Result].
Industry-Specific Customization
Tailor your banner content to your target industry. For SaaS companies, emphasize metrics like "30% MRR growth" or "20% reduction in churn." For enterprise sales, highlight "40% faster deal cycles" or "15% increase in average deal size." For startups, focus on "scaled operations from 5 to 50 reps" or "implemented first CRM system." Generic banners that could apply to any industry are 60-70% less likely to generate recruiter interest.
The "Social Proof" Element
If space permits, include a brief client logo strip or partner company names that add credibility without cluttering the design. Limit this to 2-3 recognizable brand names (e.g., "Supported teams at Salesforce, HubSpot, and ZoomInfo"). This subtle social proof can increase profile credibility by 30-50% according to recruitment industry surveys.
Mobile Optimization Considerations
Over 60% of LinkedIn users access the platform via mobile devices. Ensure your banner remains readable on smaller screens by: (1) using font sizes of 24pt minimum for any text, (2) avoiding text overlays on complex backgrounds, (3) keeping critical information in the center 60% of the banner (mobile crops the edges), and (4) testing your banner on both iOS and Android devices before publishing.
A/B Testing Your Banner
Consider creating 2-3 banner variations and rotating them monthly to test which performs best. Track profile views, connection requests, and recruiter messages during each period. Common variables to test include: metric emphasis (revenue vs. efficiency vs. team impact), color schemes (blue-dominant vs. green-dominant), and CTA phrasing ("Open to Opportunities" vs. "Let's Optimize Together"). Data from these tests can inform your permanent banner design.
Seasonal and Trend Updates
Refresh your banner quarterly to align with current sales trends, company achievements, or industry events. For example, during Q4, emphasize "year-end revenue acceleration" metrics; during Q1, highlight "annual planning and forecasting" expertise. This demonstrates you're actively engaged in the sales operations community and aware of current market dynamics.
Design Elements That Work
For a Sales Operations Lead banner, prioritize visual hierarchy: your name and title should be the largest elements, followed by a short tagline (under 10 words). Use icons like gears, charts, or flow diagrams sparingly—one or two subtle graphics are enough. Stick to a 2-3 color palette from your company brand; dark navy or charcoal backgrounds with a bright accent (like teal or orange) for the CTA button or key words tend to perform well. Avoid stock photos of generic sales teams—they look dated and distract from your personal brand.
Placement & Sizing Tips
LinkedIn banners display at 1584 × 396 pixels on desktop, but mobile crops the left and right edges significantly. Keep all critical text—your name, title, and CTA—within the central 1100-pixel-wide safe zone. Leave at least 20 pixels of padding from the top and bottom edges to prevent text from being cut off. Test your banner on both desktop and mobile previews before publishing; the LinkedIn profile preview tool shows how it will look on each device.
Sources
- LinkedIn Sales Solutions — official product documentation and best practices for sales operations roles.
- Harvard Business Review — articles on sales leadership, team management, and operational strategy.
- Salesforce — resources on sales process optimization, CRM metrics, and operations frameworks.
- Gartner — research reports on sales operations trends, KPIs, and technology adoption.
- The Bridge Group — specialized insights on sales development, operations benchmarks, and compensation.
- American Management Association — guides on sales management, organizational effectiveness, and leadership development.
FAQ
What does a Sales Operations Lead actually do day-to-day? A Sales Operations Lead manages the systems, data, and processes that enable a sales team to sell efficiently. Their daily work often includes CRM administration, forecasting, territory planning, and analyzing pipeline metrics to identify bottlenecks or growth opportunities.
Is this role the same as a Sales Manager or VP of Sales? No, it’s a support and strategy role, not a direct people-management or quota-carrying position. While they work closely with sales leadership, the Sales Operations Lead focuses on optimizing workflows, reporting, and tooling rather than managing individual sales reps or closing deals themselves.
What experience or background is typically needed for this role? Most Sales Operations Leads come from backgrounds in sales, business analysis, or revenue operations, with several years of experience using CRM platforms like Salesforce or HubSpot. Strong analytical skills, project management ability, and a solid understanding of sales processes are common requirements, though specific years vary widely by company.
What tools or software should a Sales Operations Lead be proficient in? Proficiency in CRM systems (especially Salesforce or HubSpot) is almost always expected, along with data tools like Excel, Tableau, or Power BI. Many roles also require familiarity with sales engagement platforms (e.g., Outreach, SalesLoft) and sometimes forecasting or CPQ software.
How does this role impact revenue or company growth? By improving sales efficiency, data accuracy, and process consistency, a Sales Operations Lead helps shorten sales cycles, increase win rates, and reduce churn. Their work directly supports better forecasting and strategic decision-making, which can lead to more predictable revenue growth.
What is the typical career path after being a Sales Operations Lead? Common next steps include moving into a Director or VP of Sales Operations role, transitioning to Revenue Operations leadership, or pivoting into a Chief Revenue Officer (CRO) track. Some also move into product management or analytics roles, depending on their interests and company size.
This page will be disappearing soon. Save it to your device for $1 — or read it free while it is here.
@Kory-White- · if Venmo asks, the last 4 of my number are 2012
This page is gone.
This one is off the shelf now. $1 keeps it on your phone for good — the whole page, pictures and diagrams included.
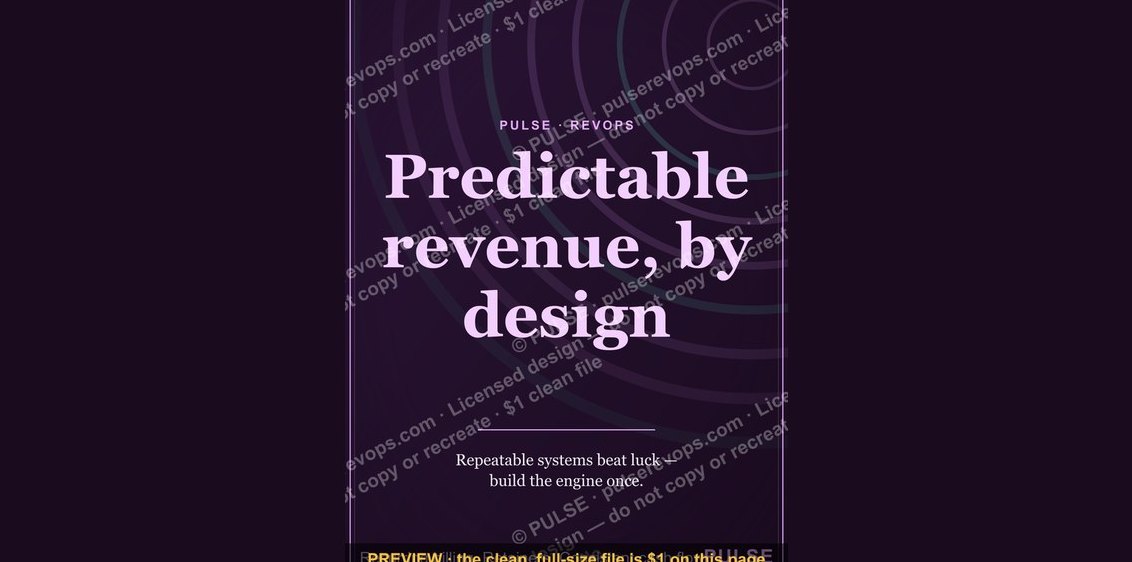 graphicPredictable revenue, by design. — LinkedIn Wallpaper
 graphicSales Coach — LinkedIn Banner
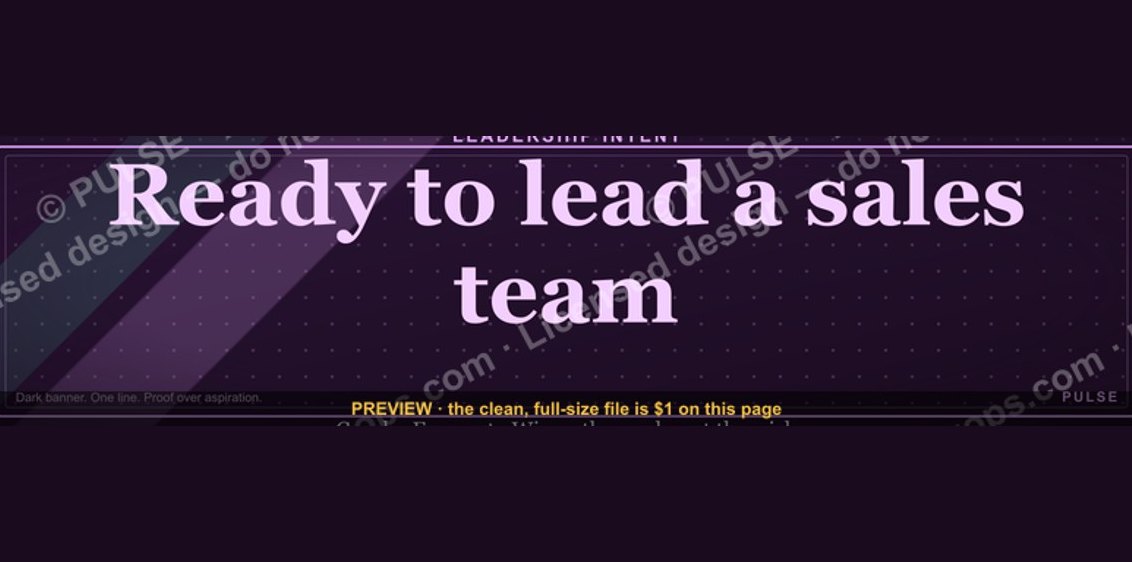 graphic“Ready to lead a sales team.” — LinkedIn Banner
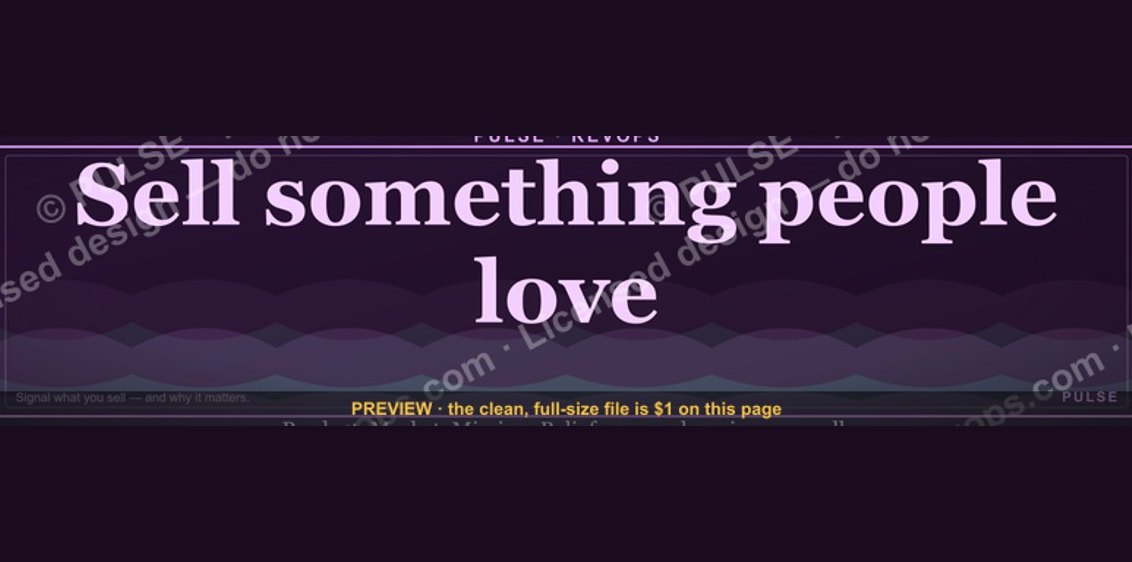 graphic“Sell something people love.” — LinkedIn Banner
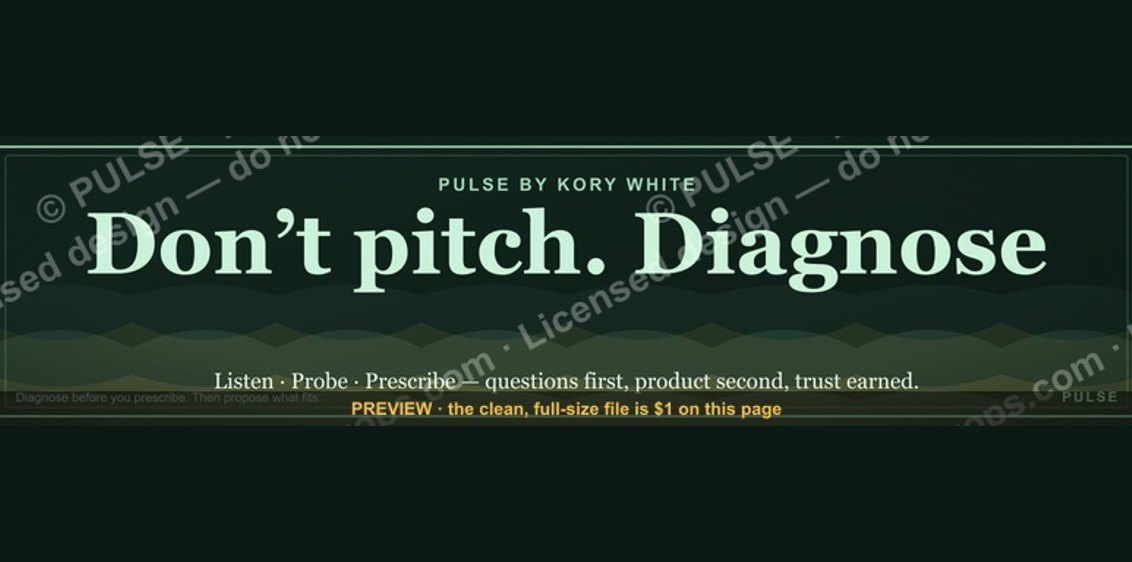 graphic“Don’t pitch. Diagnose.” — LinkedIn Banner
 graphicLead from the front. — LinkedIn Wallpaper
 graphicPipeline cures all. — LinkedIn Wallpaper
 graphicSIEM and Data Lake CRO — LinkedIn Banner
 graphicTrust compounds. — LinkedIn Wallpaper
 graphicRevOps Manager — LinkedIn Banner