 Pulse Reviews and Analysis
How do you monitor LLMs in production for drift and hallucinations?
 Curated by Kory White · Fractional CRO, CRO Syndicate
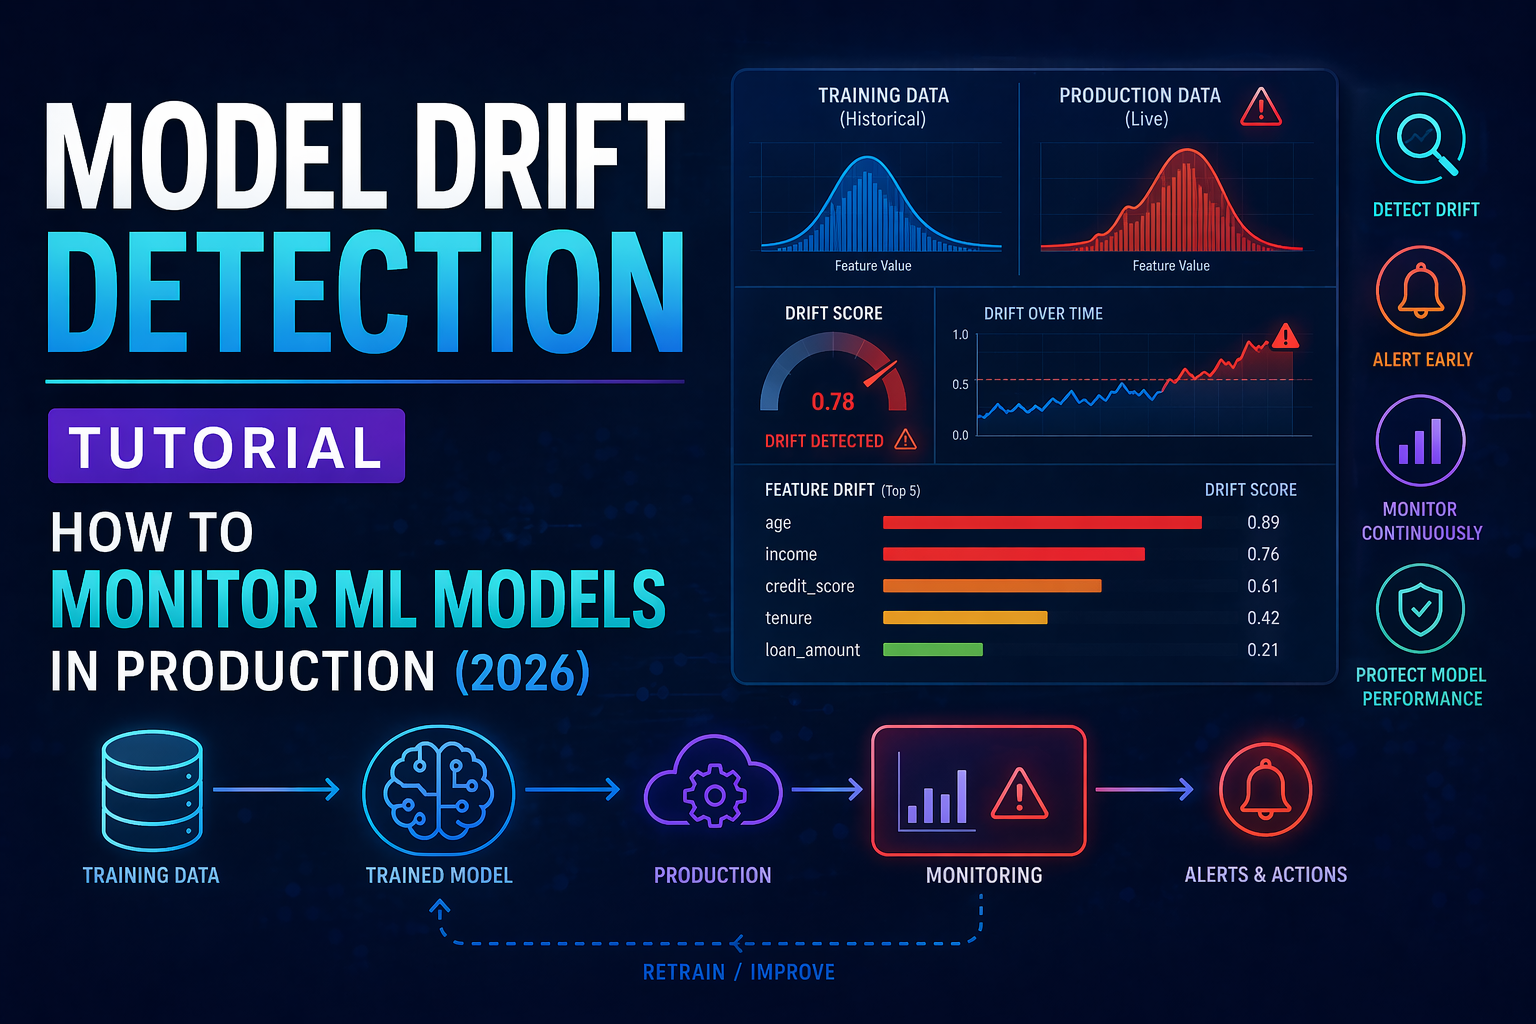
How do you monitor LLMs in production for drift and hallucinations?
You monitor production LLMs by capturing every request as a trace, running automated evaluations on outputs (including groundedness checks for hallucinations), tracking input and output distributions for drift, collecting user feedback signals, and alerting when quality, cost, or latency move outside expected ranges.
Unlike classic ML, LLMs fail in subtle, qualitative ways — a confident but wrong answer, a slow drift in tone, a hallucinated citation — so monitoring combines operational metrics, statistical drift detection, and LLM-specific quality evaluation. Tools like Langfuse, Arize Phoenix, Evidently, WhyLabs, and Helicone provide this stack.
What "drift" and "hallucination" mean for LLMs
Drift in an LLM system is when the inputs or outputs change distribution over time. Input drift might be users asking new kinds of questions or in new languages; output drift might be responses getting longer, changing tone, or shifting topic mix after a prompt or model change.
Drift is not automatically bad, but unexplained drift is a signal something changed — a new user segment, a regression, or an upstream data shift.
A hallucination is when the model produces content that is fluent and confident but factually wrong or unsupported by the provided context. In RAG systems, the most tractable form is groundedness: did the answer actually follow from the retrieved documents, or did the model invent details?
Hallucination monitoring focuses on catching ungrounded or unsupported claims.
Step 1: Instrument with tracing
The foundation of LLM monitoring is tracing — capturing each request end to end: the prompt, retrieved context, model and parameters, the response, token counts, latency, and cost. For multi-step agents and RAG pipelines, a trace records every step (retrieval, tool calls, generation) so you can see where a bad answer came from.
Tools like Langfuse, Arize Phoenix, Helicone, and Weights & Biases Weave capture these traces, and an AI gateway can emit them centrally for every app. Without traces you cannot debug failures or run evaluations on real traffic.
Step 2: Run automated evaluations on outputs
You cannot read every response, so automate quality checks. Common evaluation techniques:
- Groundedness / faithfulness: check whether the answer is supported by the retrieved context, often using an LLM-as-judge that compares the response against the sources. This is the primary defense against hallucinations in RAG.
- Relevance: does the answer address the question, and was the retrieved context relevant?
- Correctness: for questions with known answers (a regression test set), compare against ground truth.
- Safety and policy: check for toxic, biased, or policy-violating content.
Run these continuously on a sample of production traffic and as a gate on a fixed test set whenever you change prompts, models, or retrieval. Evidently, Arize Phoenix, Langfuse, and similar tools support evaluation pipelines.

Reach Kory White, Fractional CRO: 📅 Book a Quick Call · 💼 Kory on LinkedIn · 🏢 CRO Syndicate
Step 3: Detect drift statistically
Alongside qualitative evaluation, track distributions over time. Monitor input drift (embedding distributions of incoming prompts, query length, language, topic clusters) and output drift (response length, refusal rate, sentiment, embedding distribution of answers). A sudden shift in any of these flags that something changed — a new user behavior, a model update, or a regression.
Tools like Evidently and WhyLabs compute drift metrics on these distributions and alert when they exceed thresholds. Embedding-based drift detection is especially useful for catching topic and intent shifts that simple token metrics miss.
Step 4: Capture user feedback and outcomes
Automated metrics are strong but incomplete; real signal comes from users. Capture explicit feedback (thumbs up/down, ratings) and implicit signals (did the user retry, rephrase, escalate to a human, or abandon?). Tie these back to the trace so you can analyze which prompts, contexts, or models produce dissatisfaction.
Feedback also builds the labeled dataset you use to improve evaluations and, later, fine-tune.
Step 5: Alert, dashboard, and close the loop
Turn all of this into dashboards and alerts. Operational metrics (latency, error rate, cost, token usage) should alert in near real time. Quality and drift metrics are evaluated on rolling windows and alert when they cross thresholds.
When an alert fires, the captured traces let you find the failing cases fast, diagnose the cause (a prompt change, a retrieval regression, a model update, drifted inputs), and fix it — then add the failure to your regression test set so it cannot recur silently. This closed loop is what keeps an LLM application reliable as data, usage, and models change.
A practical monitoring stack
A common production setup: an AI gateway (LiteLLM or Portkey) emits traces for every request; Langfuse or Arize Phoenix stores traces and runs LLM-as-judge evaluations for groundedness and relevance; Evidently or WhyLabs computes input/output drift; Prometheus/Grafana track operational metrics (latency, cost, errors); and user feedback flows back into the trace store.
Alerts route to your on-call channel, and a fixed evaluation set gates every prompt or model change in CI.
Frequently Asked Questions
How do I actually detect hallucinations? The most practical approach in RAG is groundedness checking: use an LLM-as-judge (or a dedicated evaluator) to verify whether the answer is supported by the retrieved context. Combine that with user feedback and a regression test set of known questions to catch ungrounded or incorrect responses.
What is LLM-as-judge? LLM-as-judge uses a language model to score another model's output against criteria like groundedness, relevance, or correctness. It scales evaluation across far more traffic than human review, though you should calibrate it against human labels periodically to trust its scores.
How is LLM drift different from classic ML drift? Classic ML drift is about shifting feature and label distributions. LLM drift includes those plus qualitative shifts — tone, length, refusal rate, topic mix — and is often detected via embedding distributions of prompts and responses.
The output is text, so evaluation is more semantic than numeric.
Do I need a special tool or can I use existing monitoring? Operational metrics (latency, cost, errors) fit existing tools like Prometheus and Grafana. But tracing, groundedness evaluation, and semantic drift need LLM-aware tools such as Langfuse, Arize Phoenix, Evidently, WhyLabs, or Helicone. Most teams combine both.
How much traffic should I evaluate? Run automated evaluations on a representative sample continuously rather than every request, since LLM-as-judge calls cost money and latency. Always run the full fixed test set as a gate when you change prompts, models, or retrieval, so regressions are caught before deploy.
How do I close the loop after finding a problem? Use the captured trace to reproduce the failure, diagnose the cause (prompt, retrieval, model, or input drift), fix it, and add the case to your regression test set. This prevents the same failure from recurring silently and steadily improves your evaluation coverage.
Sources
- Langfuse documentation on tracing and evaluation
- Arize AI and Phoenix documentation on LLM observability
- Evidently AI documentation on drift and LLM evaluation
- WhyLabs and whylogs documentation on drift detection
- Helicone documentation on LLM observability
- Prometheus and Grafana documentation
- Weights & Biases Weave documentation