


The Lean Product Playbook by Dan Olsen — Cliff Notes Summary
Quality
Certified
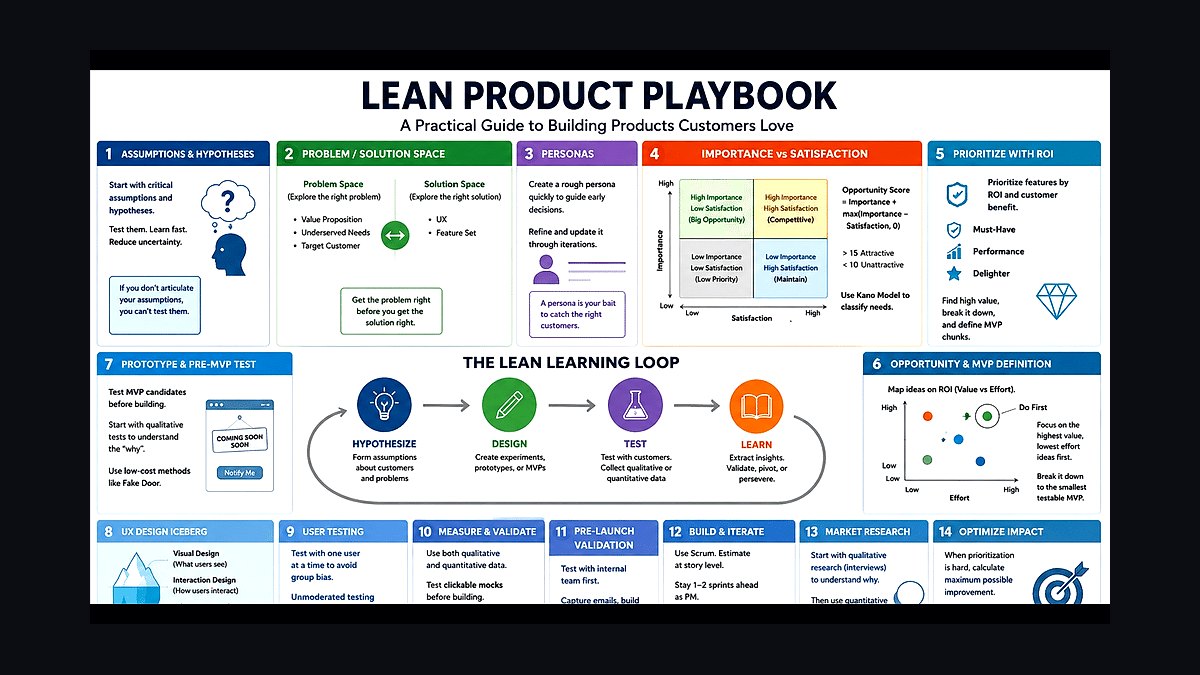
The Lean Product Playbook (Wiley, 2015) by Dan Olsen is a step-by-step operating manual for reaching product-market fit. Its core is the Product-Market Fit Pyramid — Target Customer, Underserved Needs, Value Proposition, Feature Set, UX — paired with a six-step Lean Product Process that builds fit bottom-up, tests it with MVPs, and iterates until customers confirm it.
The two paths Olsen puts in front of you
Every Cliff Notes Summary of this book eventually collapses into one decision, and it is worth stating plainly before the frameworks arrive: Olsen presents two competing ways to build a product, and the entire book is an argument for one of them.
Path A — the feature-first path. You have an idea. You have engineers. You build the thing, ship it, and then go look for people who want it. This is the default mode of most startups and most enterprise product orgs, because it feels like progress: velocity charts move, demos happen, the roadmap has items on it. In Pyramid terms you are starting at Layer 4 (Feature Set) and Layer 5 (UX) and hoping Layers 1 and 2 backfill themselves. Olsen's diagnosis is blunt — you are building on sand. You will get a product that works beautifully and serves nobody in particular, and you will not find out for two to four quarters because usage numbers in the first months are dominated by curiosity traffic, friends, and pilot customers who agreed to look at it as a favor.
Path B — the market-first path. You name a specific target customer, you interview them until you can rank their needs by importance and by how satisfied they already are, you find the gap, you write a value proposition against that gap, and only then do you specify the smallest feature set that delivers it. Layers 1 and 2 first, always. This is slower on the calendar for the first six to eight weeks and dramatically faster to a product anyone renews.
The trade-off is real and Olsen does not pretend otherwise. Path A produces something demoable in week two; Path B produces a persona document and a 2×2 in week two, which is unsatisfying to show a board. Path A optimizes for the appearance of momentum. Path B optimizes for not spending eighteen months on the wrong thing. What makes the book useful rather than preachy is that Olsen gives Path B a schedule, a set of artifacts, and a stopping rule, so it stops being "do more research" and becomes a process with a finish line.

The adjacent version of this same fork shows up constantly outside product. In sales it is demo-first versus discovery-first — the AE who opens with a screen share versus the one who spends the first call ranking pains. In RevOps it is tool-first versus process-first: buying the platform and then designing the workflow around whatever it happens to do, versus mapping the handoff and then choosing the tool that fits. In marketing it is campaign-first versus positioning-first. Same shape, same failure mode, same fix. That is why the book travels well outside its stated audience, and why it belongs in a go-to-market reading stack next to Crossing the Chasm and Lean Analytics rather than only on the product shelf.
One more distinction worth holding onto: Olsen separates *market* from *product* explicitly. The bottom two Pyramid layers are the market — they exist whether or not you show up, and you cannot change them, only discover them. The top three are the product — entirely yours, entirely changeable. Most teams spend 90% of their energy on the three layers they control and almost none on the two they do not, which is exactly backwards, because the two you do not control determine whether the three you do will ever matter.
How to decide which layer you are actually stuck on
The practical value of the Pyramid is diagnostic, not aspirational. When a product is underperforming, the useful question is not "how do we grow?" but "which layer is broken?" — and each layer fails with a distinguishable symptom.
Layer 5 (UX) failure looks like: people sign up, understand what the product is for, want it, and then cannot complete the core task. Support tickets cluster on one screen. Activation is low but stated intent is high. Fix is design and instrumentation, not strategy.

Layer 4 (Feature Set) failure looks like: users complete the core flow, come back a few times, then churn while telling you the product "almost" does what they need. There is a named missing capability. Fix is scoping — usually one or two features, not a rebuild.
Layer 3 (Value Proposition) failure looks like: strong demo reactions, weak conversion. People say "interesting" and do not buy. You are solving a real need but the benefit you are leading with is not the one they weigh at decision time. Fix is repositioning, often with zero code changed.
Layer 2 (Underserved Needs) failure looks like: everything works, nobody cares. Low importance scores in interviews, no urgency, no budget line. This is the expensive one, because the fix is either a different need or a different customer.
Layer 1 (Target Customer) failure looks like: wildly inconsistent feedback. Half your users love a feature the other half find irrelevant. You are averaging across two or three personas with opposing needs and building the compromise nobody wants.
The diagnostic order matters. Debug from the bottom up, because a Layer 2 problem *presents* as a Layer 4 problem — customers who do not have the need will happily give you a feature request rather than say "I don't need this." Take those requests at face value and you will ship six months of features into a market that was never there. Olsen's rule of thumb is that if you have shipped several requested features and retention has not moved, stop shipping features; the fault is at least one layer down.
A second decision the book forces is *which* underserved need to chase when you find several. This is where the Importance × Satisfaction framework does its work. Rate each need on how important it is to the customer (1–10) and how satisfied they are with existing solutions (1–10). Plot on a 2×2. High importance, low satisfaction is the opportunity space. High importance, high satisfaction is a crowded market where you are fighting an incumbent that already works. Low importance, low satisfaction is a problem nobody will pay to fix. Low importance, high satisfaction is irrelevant.

Two refinements that keep this from becoming a scoring ritual. First, ask about importance and satisfaction in separate parts of the interview — if you ask them back to back, people anchor the second answer on the first. Second, ask about the *current workaround*, not the hypothetical. "What do you do today when this happens?" produces a far more honest satisfaction rating than "how satisfied are you with your current solution?", because the workaround is a behavior and behaviors are checkable. If someone says they are dissatisfied but has built no workaround, the importance score is inflated.
Layered on top is the Kano Model, which classifies needs by how satisfaction responds to fulfillment: Must-Haves (absence is fatal, presence earns nothing), Performance Benefits (satisfaction scales roughly with how much you deliver), and Delighters (unexpected, disproportionately memorable). Olsen's MVP composition rule follows directly: ship all the Must-Haves, compete on one or two Performance Benefits, and include at least one Delighter. Skip a Must-Have and you are disqualified regardless of how good the rest is. Ship only Must-Haves and you are undifferentiated. Lead with Delighters and no Must-Haves and you get demos with no deals — the classic fate of a beautiful product nobody can actually deploy.
Kano categories also decay. Today's Delighter is next year's Performance Benefit and eventually a Must-Have — the arc of any feature that becomes table stakes. Re-running the classification annually is cheap and prevents you defending a differentiator that quietly became a checkbox.
The concrete numbers behind each path

The book's usefulness is in its specificity, so here are the quantitative anchors a practitioner can actually hold onto.
The Sean Ellis PMF survey — 40%. Ask active users: "How would you feel if you could no longer use this product?" with options *very disappointed / somewhat disappointed / not disappointed*. Forty percent or more answering "very disappointed" is the working threshold for product-market fit. The mechanics matter as much as the number: survey users who have experienced the core value at least twice, within a week or two of that experience, and segment the results. A blended 25% that hides a 55% inside one persona is not a failure — it is a targeting instruction. Rerun quarterly and after any material change to the value prop.
User testing — 5 to 8 participants. Olsen leans on Jakob Nielsen's long-standing finding that a small handful of users surfaces the large majority of usability problems, with returns falling off sharply after that. The practical implication is that you should run several small rounds rather than one large one: test five, fix, test five more. Waiting to recruit twenty participants for a single definitive study costs weeks and gets you one shot at learning instead of four.
Iterations to fit — typically three to five cycles. Almost no team gets fit on the first MVP. Budget for multiple loops through the process rather than treating the first negative result as a verdict on the idea. What each loop should shorten is not the learning but the build: iteration one might be a clickable prototype, iteration two a landing page with a real pricing tier, iteration three a working slice.
Interview volume for Step 2. Rank-ordered needs stabilize surprisingly fast within a tight persona — typically after somewhere between eight and fifteen conversations, new interviews stop producing new top-tier needs. If you are twenty-five interviews in and the top needs are still shifting, that is a Layer 1 signal: your persona is too broad and you are sampling multiple markets.
Prototype fidelity, matched to the question. The cost curve is steep and the rule is to spend the least that answers the question in front of you. Testing information architecture or flow? Paper sketches or wireframes, hours of work. Testing comprehension of the value prop? A landing page. Testing willingness to pay? You need a real price, a real button, and a real moment of commitment — anything softer measures politeness. Testing whether the core mechanic works at all? A live slice, narrow and ugly. Building high fidelity to answer a low-fidelity question is the most common way teams burn a month.

Funnel instrumentation. The canonical SaaS chain is Visitor → Trial → Activation → Paid → Retained → Referral. The One Metric That Matters idea (from Croll and Yoskovitz's Lean Analytics, which Olsen explicitly builds on) says pick the single stage that is your current constraint and ignore the rest for now. In the pre-fit phase that metric is almost always activation or week-four retention, never signups. Signups measure your landing page. Retention measures your Pyramid.
Leading versus lagging indicators. Leading: engagement depth, activation rate, qualitative reaction intensity, unprompted feature requests. Lagging: retention curves, referral rate, willingness to pay, expansion. Leading indicators move in days and are noisy; lagging indicators move in months and are true. Use leading to steer between tests and lagging to decide whether you have fit.
One honest caveat on all of these: they are heuristics with real empirical grounding, not laws. The 40% threshold in particular behaves differently across categories — a product used daily by an individual and a product bought annually by a committee do not produce comparable survey distributions. Use the number as a tripwire that starts a conversation, not as a gate that ends one.
Sequencing the six steps without stalling
The Lean Product Process maps one-to-one onto the Pyramid, bottom to top, then loops. Here is what each step actually produces and how long it should take before you move on.
Step 1 — Determine your target customer. Output: a written persona with demographics, psychographics, jobs-to-be-done, and — most importantly — current behaviors. Olsen borrows Geoffrey Moore's Technology Adoption Life Cycle to argue your first target should be innovators or early adopters, never the early majority. Early adopters tolerate rough edges and will tell you the truth; the majority will politely decline and teach you nothing. The discipline here is subtraction. "SMBs" is not a persona. "Marketers" is not a persona. Dropbox's early target was not "people with files," it was people already frustrated enough with USB drives and email attachments to be experimenting with workarounds. Timebox: about a week.

Step 2 — Identify underserved needs. Output: a ranked list of needs with importance and satisfaction scores, a filled 2×2, and a named opportunity space. This is the highest-leverage step in the book and the one teams rush. Interview in the customer's language, capture verbatim quotes, and resist the urge to describe your solution — the moment you pitch, you contaminate the sample. Timebox: two to three weeks.
Step 3 — Define your value proposition. Output: a chosen set of three to five benefits and a one-sentence positioning statement in the Moore template — *for [target customer] who [need], our product is a [category] that [benefit]; unlike [alternative], we [differentiator]*. The failure mode is the kitchen sink: listing everything you do because cutting feels like losing. If your value prop has eight bullets, you have not made a strategy decision, you have made a feature inventory. Timebox: a few days, but expect to revise it after every MVP test.
Step 4 — Specify your MVP feature set. Output: a prioritized, brutally cut feature list where every item traces to a specific need in the opportunity space. Olsen uses MoSCoW (Must / Should / Could / Won't) and Jeff Patton's user story mapping. The story map is the underrated tool here: laying the user's journey left to right and slicing horizontally forces you to ship a thin complete path rather than one deep feature and four dead ends. Anything that cannot be traced to a ranked need is scope creep with better vocabulary. Timebox: one week.
Step 5 — Create your MVP prototype. Output: an artifact at the fidelity the question demands. The mistake is treating "MVP" as a synonym for "small version of the real product." It is not a product at all — it is an instrument for answering one question.
Step 6 — Test with customers. Output: evidence, and a decision about which layer to revisit. Moderated sessions with think-aloud protocol, small rounds, and a strict separation between what people *say* and what they *do*. Politeness is the enemy of Step 6. Ask about past behavior rather than future intent — "walk me through the last time this happened" beats "would you use this?" every time, because the first is memory and the second is imagination.

Then Step 7, which is not numbered in the book but is the whole point: iterate. Climb back down to the broken layer and rebuild upward. Build-Measure-Learn, borrowed openly from Eric Ries, is the engine; the Pyramid is what tells you *where* to point it, which is precisely the operational gap Lean Startup left open.
Sequencing failures are more common than framework failures. Three recur. Running Steps 1 and 2 once at the start and never again, so the persona ossifies while the market moves. Running Step 6 with the wrong people — existing happy customers instead of the target persona — which produces flattering, useless data. And skipping the explicit "which layer failed" decision after a test, which turns iteration into random feature drift.
Where this bleeds into sales, RevOps, and the rest of go-to-market
The book is written for product teams, but the Pyramid is genuinely portable, and the translation is close to one-to-one.
Layer 1 is your ICP. The same discipline that kills "SMBs" as a persona kills a scattered target account list. If your win rate varies by 3x across segments, you do not have a sales execution problem, you have a Layer 1 problem, and no amount of enablement will fix it.
Layer 2 is discovery. Underserved needs are pain, and the Importance × Satisfaction 2×2 is a discovery-call instrument. Ask a buyer to rate a pain on importance and on satisfaction with what they do today. Upper-left — important, badly served — is a qualified deal. Anything else is information, not a pipeline entry. This maps cleanly onto the pain-identification step in MEDDIC and onto the implication questions in SPIN Selling, both of which are trying to establish the same two coordinates by different means.
Layer 3 is your pitch. A value proposition that lists eleven benefits produces an AE who leads with a different one every call and a forecast nobody trusts. Cutting to three to five is a sales operations act as much as a product one.
Layers 4 and 5 are the product feedback loop. When sales loses on a named missing capability repeatedly, that is Layer 4 data arriving through a different door. Route it, do not just log it.

The RevOps angle is worth drawing out because it is the least obvious. The Pyramid is a shared vocabulary between two functions that usually argue past each other. Product says sales is selling to the wrong accounts; sales says product is not building what closes deals. Both may be true, and the Pyramid localizes the disagreement — is this a Layer 1 dispute about who we sell to, a Layer 2 dispute about what actually hurts, or a Layer 4 dispute about what we build? Naming the layer converts a turf fight into a resolvable question, and it gives lost-reason taxonomy in the CRM something principled to map to.
The same diagnostic works on internal tooling, which is where RevOps teams live. A CRM rollout nobody adopts has a layer. If reps cannot complete the workflow, it is UX. If it lacks a field they need, it is feature set. If it works but they see no reason to bother, that is Layer 2 — you built for a need the reps do not have, usually because the actual customer was a manager who wanted reporting. Internal products fail for exactly the same reasons external ones do, and they get diagnosed even less rigorously because nobody churns visibly; they just quietly maintain a spreadsheet.
What has aged and what has not, since this is a Summary and honesty about a decade-old book matters: the Pyramid and Importance × Satisfaction hold up completely — they are conceptual and tool-independent. The prototyping chapter's specific tool references have moved on, as any tool list from 2015 would. The user-research chapter predates the current generation of remote testing and synthesis tooling that compresses a testing round from weeks to days. And the analytics chapter is thinner than what modern product analytics gives you by default. None of that touches the core, because the core is a way of ordering your questions, and the order has not changed.
Related questions
Is this book redundant if I have already read The Lean Startup?
No — they solve different problems. Ries supplies the philosophy: build-measure-learn, validated learning, pivots. Olsen supplies the missing recipe, layer by layer, with named artifacts per step. Read Ries for why, Olsen for what to do Monday morning.
What is the fastest way to apply the Pyramid to an existing product?

Run the diagnostic downward. Survey active users with the Sean Ellis question, segment the results, then interview the most disappointed cohort on importance and satisfaction. If one segment scores far above the blend, your fix is targeting, not building.
How does a Delighter differ from a nice-to-have?
A Delighter is unexpected and produces disproportionate enthusiasm — customers mention it unprompted. A nice-to-have is expected and produces mild approval. The test is whether removing it would be noticed emotionally or merely noted.
Can Importance × Satisfaction be run without formal research?
Yes, informally, in any customer conversation. Ask what today's workaround is and how much the problem costs them. Ratings from ten honest conversations beat a hundred-response survey where respondents guess at hypotheticals they have never faced.
Does the 40% benchmark apply to internal tools?
Not directly — captive users cannot leave, so disappointment is distorted. A better internal proxy is unforced adoption: what share of the workflow happens in the tool versus in spreadsheets or chat when nobody is watching?
FAQ
What exactly is the Product-Market Fit Pyramid?
A five-layer model stacking Target Customer, Underserved Needs, Value Proposition, Feature Set, and UX. The bottom two are the market — you discover them, you do not control them. The top three are the product — entirely yours. Product-market fit is literally the seam between layer two and layer three: your value proposition meeting the market's underserved needs. Build upward, because skipping a layer means the layers above it rest on an assumption you never checked.
How do I run the Importance × Satisfaction exercise properly?

List the needs in the customer's own words, not your feature names. Rate importance 1–10 and satisfaction with current alternatives 1–10, asking the two questions at different points in the conversation so answers do not anchor. Ground satisfaction in the actual workaround — what they do today — rather than a hypothetical. Plot on a 2×2 and treat only the high-importance, low-satisfaction quadrant as opportunity.
What makes an MVP legitimate under this framework?
It must contain every Must-Have for the target customer, deliver at least one or two Performance Benefits meaningfully better than alternatives, and include one Delighter. Missing a Must-Have disqualifies you regardless of everything else. And it must be built to answer a specific question — an MVP with no hypothesis attached is just a small product, which is the most expensive kind of product to build.
How many customer interviews are enough before moving on?
Within a tight persona, ranked needs usually stabilize after roughly eight to fifteen conversations — the point where new interviews stop surfacing new top-tier needs. If rankings are still moving at twenty-five, that is not a research problem, it is a targeting problem: you are sampling several markets at once and averaging them into a persona that does not exist.
Why does Olsen insist on early adopters as the first target?
Early adopters feel the pain acutely enough to have built workarounds, tolerate rough software, and will tell you what is wrong instead of politely disengaging. The early majority wants proof, references, and polish — none of which you have yet. Targeting them pre-fit produces rejections that teach you nothing, because the reason for the no is maturity, not the need.
What is the single highest-leverage habit from the book?
Naming the failing layer before acting. When something underperforms, the reflex is to ship a feature. The discipline is to ask which layer broke — customer, need, value prop, feature set, or UX — because the fix for a layer-two problem is not a layer-four action, and shipping features into a nonexistent need is the most common way good teams waste a year.
Sources
- https://www.wiley.com/en-us/The+Lean+Product+Playbook%3A+How+to+Innovate+with+Minimum+Viable+Products+and+Rapid+Customer+Feedback-p-9781118960875
- https://dan-olsen.com/
- https://pmarchive.com/guide_to_startups_part4.html
- https://www.nngroup.com/articles/why-you-only-need-to-test-with-5-users/
- https://review.firstround.com/how-superhuman-built-an-engine-to-find-product-market-fit/
- https://www.svpg.com/product-fail/
- https://www.jpattonassociates.com/user-story-mapping/
- https://leananalyticsbook.com/
- https://www.mindtheproduct.com/dan-olsen-the-lean-product-playbook/
- https://hbr.org/2019/02/how-to-find-product-market-fit
Related on PULSE
- The Lean Startup by Eric Ries — Cliff Notes Summary
- Running Lean by Ash Maurya — Cliff Notes Summary
- Lean Analytics by Croll and Yoskovitz — Cliff Notes Summary
- The Sales Development Playbook by Trish Bertuzzi — Cliff Notes Summary
- Decisive by Chip and Dan Heath — Cliff Notes Summary for Sales Leaders
- Predictably Irrational by Dan Ariely — Cliff Notes Summary for Sellers
This page will be disappearing soon. Save it to your device for $1 — or read it free while it is here.
@Kory-White- · if Venmo asks, the last 4 of my number are 2012
This page is gone.
This one is off the shelf now. $1 keeps it on your phone for good — the whole page, pictures and diagrams included.
 pulse-recentConceptual Selling by Robert Miller and Stephen Heiman — Top 10 Key Takeaways for Sales Leaders in 2027
 pulse-recentThe Sandler Rules by David Sandler — Top 10 Key Takeaways for Sales Leaders in 2027
 pulse-recentSales EQ by Jeb Blount — Top 10 Key Takeaways for Sales Leaders in 2027
 pulse-recentHow do you implement the Sandler Rules by David Mattson in your first 30 days as a new sales manager in 2027?
 pulse-recentWhat is the Blue Sheet from Strategic Selling by Miller Heiman and how do you fill it out in 2027?
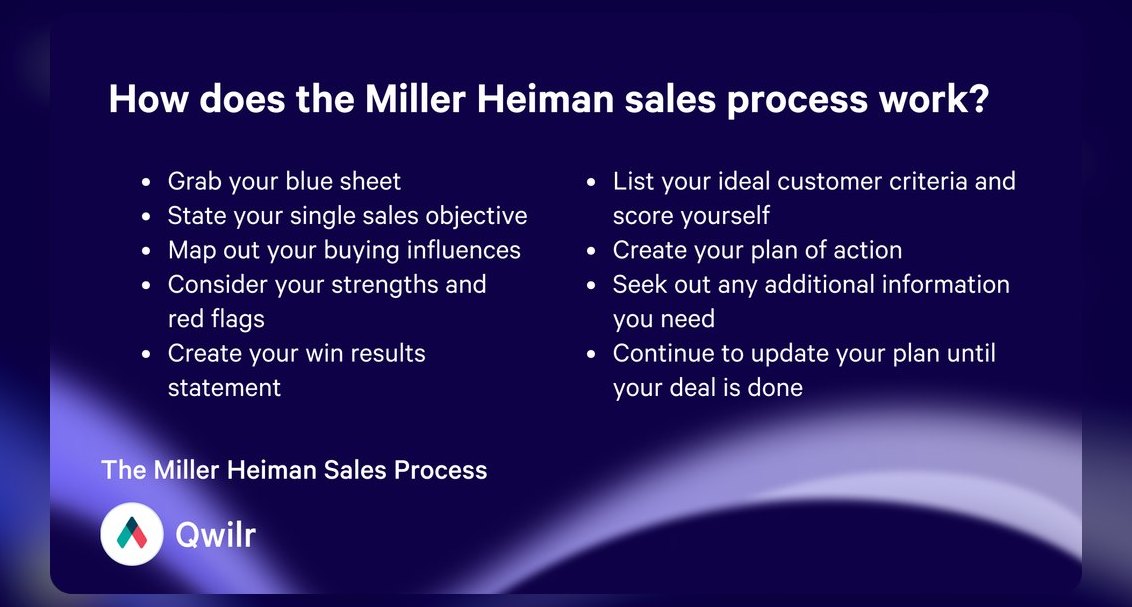 pulse-recentWhat is the step-by-step process for Strategic Selling by Miller Heiman in 2027?
 pulse-recentWhat are the seven concrete steps to implement the Sandler Submarine technique from The Sandler Rules in 2027?
 pulse-recentBlue Ocean Strategy by W. Chan Kim and Renee Mauborgne — Top 10 Key Takeaways for Sales Leaders in 2027
 pulse-recentCoaching Salespeople into Sales Champions by Keith Rosen — Top 10 Key Takeaways for Sales Leaders in 2027
 pulse-recentCrossing the Chasm by Geoffrey Moore — Top 10 Key Takeaways for Sales Leaders in 2027