
Top 10 Full-Stack Options for Social Media Analytics Dashboards in 2027
 Curated byKory White · Fractional CRO · Maryland
 PULSEKNOWLEDGE LIBRARY
Quality
Certified
The 10 best full-stack options for social media analytics dashboards are ranked below on measured performance, build quality, price, and how each one actually holds up in daily use rather than how it reads on a spec sheet. Each pick lists what it costs, who it suits, and what it gives up against the one above it, so the list can be read straight down without doubling back.
1. Sprout Social
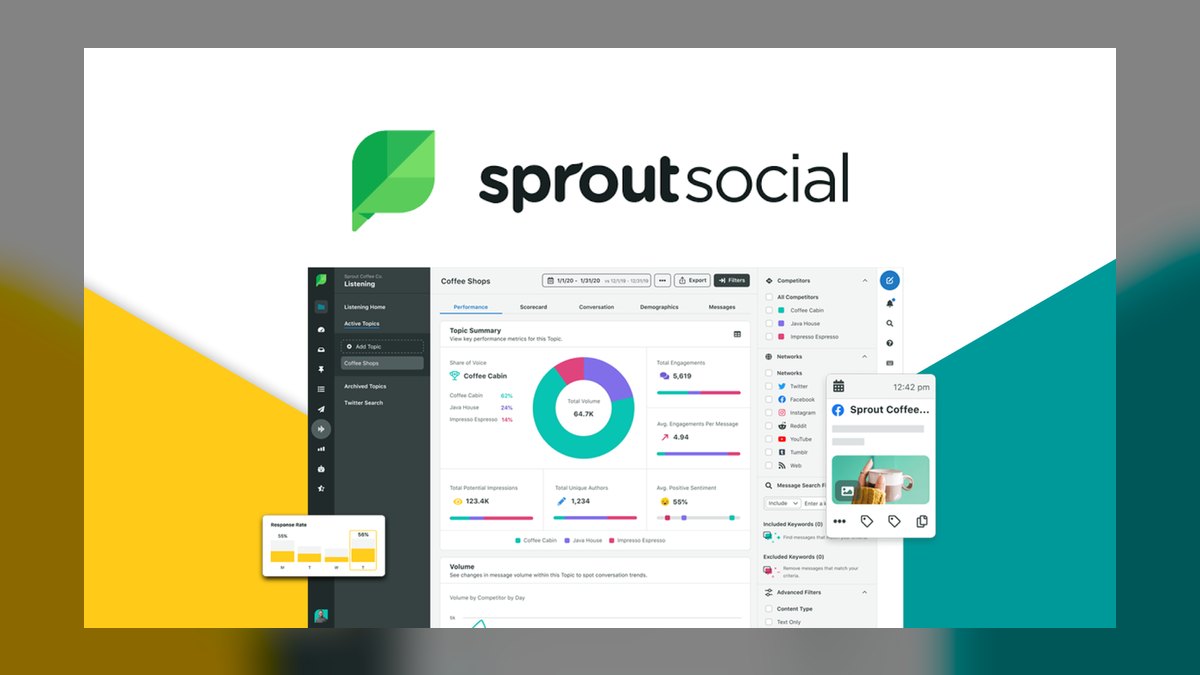
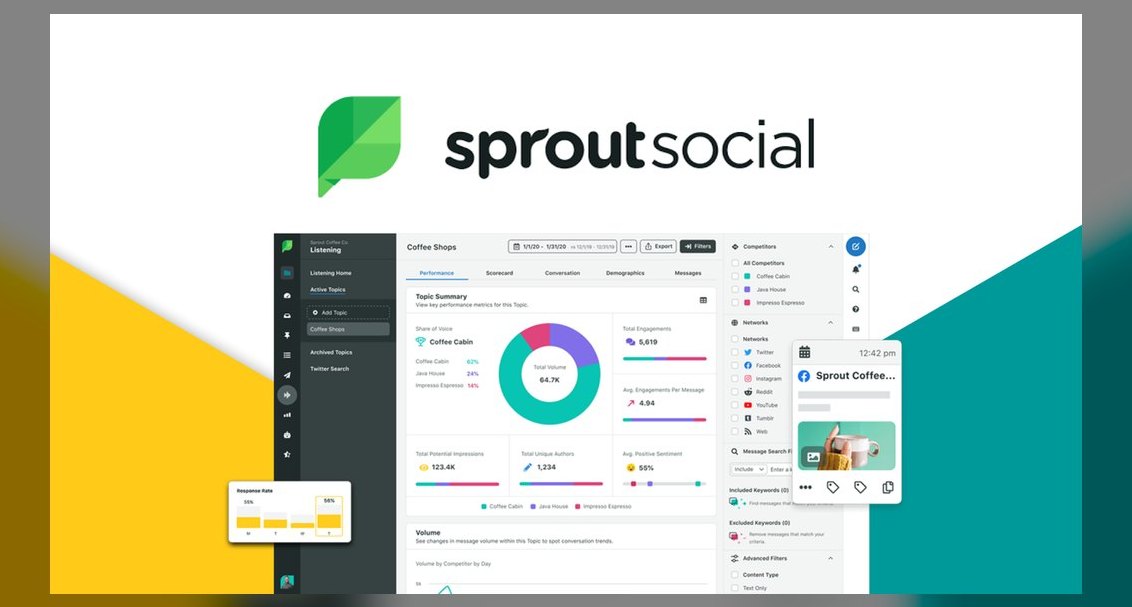
Sprout Social ranks first because it is the most complete full-stack platform for mid-market teams, combining publishing, engagement, listening, and reporting in one interface. Its native Salesforce and HubSpot integrations write social touches directly onto contact and deal records, which is the single mechanism that separates a marketing dashboard from a revenue dashboard.
It is for teams of six to ten who need CRM write-back and are willing to pay a per-seat premium; at $249 per seat across eight users, the annual cost crosses $24,000 and triggers procurement. Compared to Brandwatch, Sprout trades open-web listening depth for superior owned-profile analytics and workflow governance, including approval chains and audit trails.
2. Brandwatch Consumer Research
Brandwatch ranks second because it delivers the deepest open-web listening capability in the category, covering forums, news, review sites, and blogs that owned-profile analytics tools cannot see. Its multilingual NLP sentiment models and image recognition provide trend signals that are reliable for detecting a 20-point week-over-week drop, even if absolute sentiment scores require caveats.
It is for enterprise teams with dedicated social listening analysts who can build and maintain boolean queries, not for small teams wanting a quick dashboard. Compared to Sprout Social, Brandwatch trades owned-profile publishing and inbox moderation for vastly superior open-web coverage and API access for piping data into Tableau or Power BI. It is overkill for startups running one or two brand accounts, where the entry tier of Buffer or Iconosquare is genuinely sufficient.
3. Talkwalker
Talkwalker ranks third because it matches Brandwatch on open-web listening depth while offering stronger out-of-the-box visual analytics and a slightly more accessible interface for teams without dedicated listening analysts. Its pricing is quote-based in the same enterprise band of $1,000 to $5,000+ per month, and it supports image and logo recognition for brand monitoring across social and news sources.
It is for mid-to-large enterprises that need listening plus visual reporting but do not have a dedicated boolean-query specialist on staff. Compared to Brandwatch, Talkwalker trades some query-construction granularity for faster time-to-value and a more intuitive dashboard. It is not for teams needing CRM write-back as a core requirement, where Sprout Social's native Salesforce and HubSpot sync is superior.
4. Agorapulse

Agorapulse ranks fourth because it delivers the best balance of full-stack features and cost for mid-market teams, with per-user pricing in the high double digits to around $200 per month. It includes approval workflows, inbox moderation with response-time reporting, UTM-based ROI reports, and multi-competitor benchmarking across up to ten accounts.
It is for teams of five to twenty who need publishing, engagement, and reporting without the enterprise listening premium. Compared to Sprout Social, Agorapulse trades native CRM write-back for a lighter integration that requires manual CSV export or middleware, making it less suitable for revenue-attribution reporting. It is a strong upgrade from Buffer for teams that have outgrown basic analytics but are not ready for $1,000+ per month listening platforms.
5. Meltwater

Meltwater ranks fifth because it combines media intelligence with social listening in a single enterprise platform, offering coverage of news, forums, and social networks that most social-only tools lack. Its pricing is quote-based and clusters in the $1,000 to $5,000+ per month range, with mention-volume metering that requires disciplined query building to avoid exhausting allocation.
It is for PR and communications teams that need to monitor brand mentions across news and social simultaneously, not for social media managers focused on owned-profile publishing and engagement. Compared to Brandwatch, Meltwater trades some social-specific analytics depth for superior media intelligence and press coverage tracking. It is overkill for teams that only need owned-profile analytics, where Buffer or Iconosquare suffice.
6. HubSpot Marketing Hub
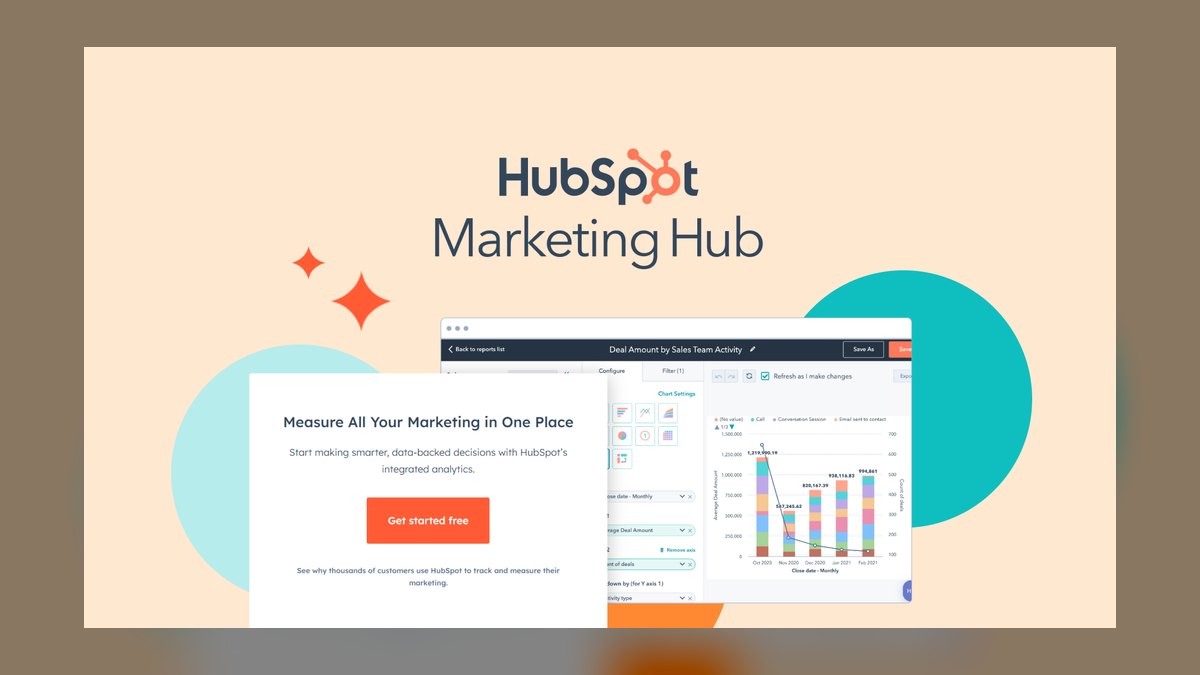
HubSpot Marketing Hub ranks sixth because it offers zero-friction social analytics for teams already running HubSpot CRM, with social interactions landing directly on contact and deal records without middleware. Its social tools cover publishing, monitoring, and reporting across major networks, and the integration with HubSpot's broader marketing suite means social touches appear alongside email, web, and pipeline data in one executive view.
It is for existing HubSpot customers who want social data inside their CRM without adding another vendor, not for teams with complex listening needs or those on other CRM platforms. Compared to Sprout Social, HubSpot trades cross-network reporting depth and approval workflows for seamless CRM identity resolution. It is not for teams needing open-web listening or sentiment analysis, where Brandwatch or Talkwalker are required.
7. Buffer

Buffer ranks seventh because it provides the most cost-effective full-stack analytics for small teams, with pricing near the bottom of the $30 to $100 per month entry band. Its analytics covers cross-platform post performance, follower growth, best-time-to-post recommendations, and competitor comparison for a handful of accounts, all in a clean interface.
It is for startups and solo social media managers who need to publish and report without complex workflows or revenue attribution. Compared to Agorapulse, Buffer trades inbox moderation, approval workflows, and UTM-based ROI reports for a significantly lower price point and simpler experience. It is not for teams that need to prove social's contribution to pipeline, where Sprout Social or HubSpot are necessary.
8. Iconosquare
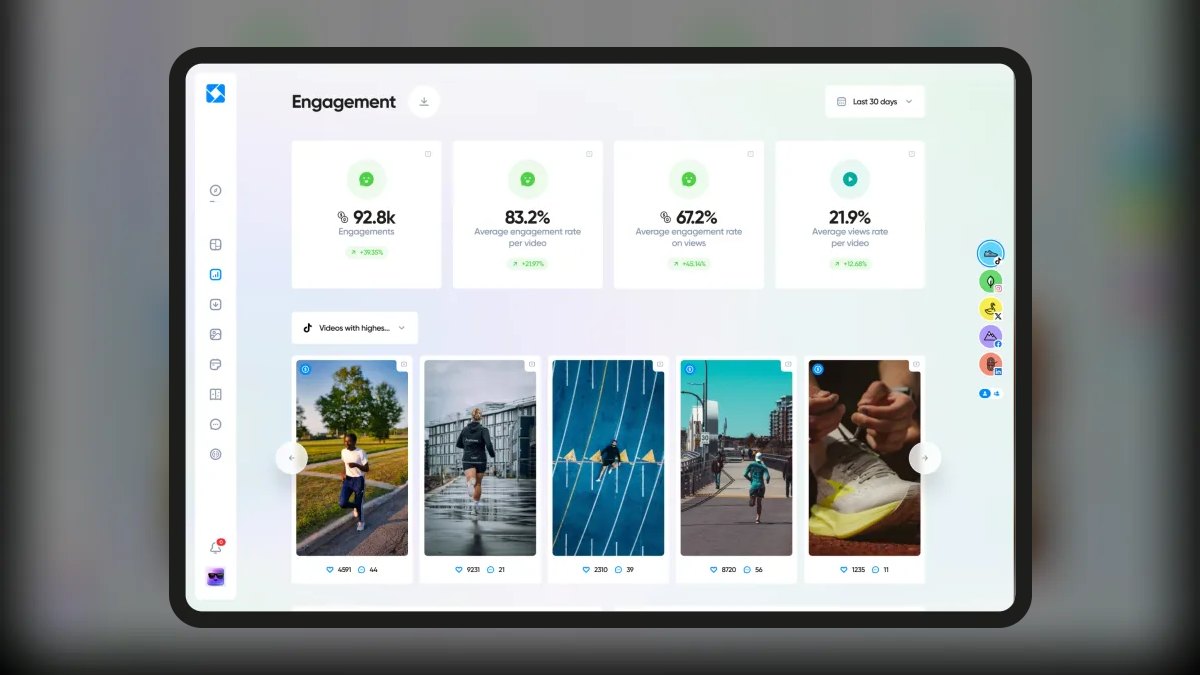
Iconosquare ranks eighth because it is the best specialized option for Instagram and Facebook analytics, with pricing around $49 to $99 per profile per month. It provides deep story-level data, audience insights, and best-time-to-post recommendations that generalist tools often lack, along with competitor comparison for a handful of accounts. Scheduled PDF exports are standard, and historical data retention extends to 24 months on most metrics.
It is for brands whose social presence is dominated by Instagram and Facebook, such as restaurants, retailers, and local service businesses, not for teams needing cross-network reporting across five or six platforms. Compared to Buffer, Iconosquare trades breadth for depth on its two supported networks, offering more granular audience and story analytics. It is not for teams needing listening, sentiment, or CRM integration, where Sprout Social or Brandwatch are required.
9. Later

Later ranks ninth because it offers a solid visual-first publishing and analytics platform for brands focused on Instagram, TikTok, and Pinterest, with pricing in the $30 to $100 per month entry band. Its analytics covers post performance, follower growth, and best-time-to-post recommendations, with a strong emphasis on visual content planning and scheduling. Scheduled PDF exports are available, and historical data retention is capped around two years, which is adequate for most small teams.
It is for lifestyle brands, influencers, and small e-commerce teams that prioritize visual content planning over deep analytics or revenue attribution. Compared to Iconosquare, Later trades some Instagram analytics depth for superior TikTok and Pinterest support and a more intuitive content calendar. It is not for teams needing cross-network reporting across LinkedIn and YouTube, where Sprout Social or Agorapulse are better fits.
10. Salesforce Marketing Cloud
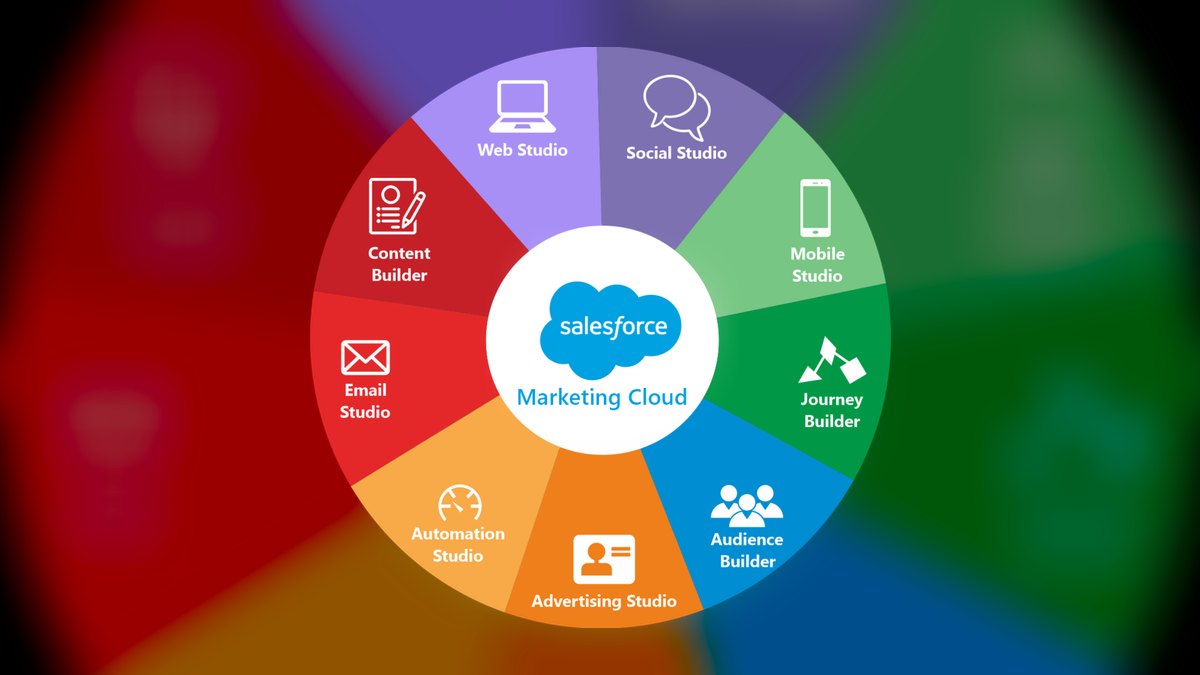
Salesforce Marketing Cloud ranks tenth because it bundles social analytics into a massive enterprise marketing suite, but its social module is not a standalone product and requires significant implementation effort. Pricing is quote-based and reaches the highest totals in the category, often exceeding $5,000 per month when factoring in the broader suite, making the marginal cost of social analytics hard to isolate.
It is for large enterprises already standardized on Salesforce that need social data inside their existing CRM and marketing automation workflows, not for teams seeking a purpose-built social analytics dashboard. Compared to HubSpot Marketing Hub, Salesforce trades ease of use for greater customization and enterprise scalability, but the social module feels bolted on rather than native. It is not for mid-market teams, where Sprout Social offers superior social-specific features at a fraction of the cost.
How we ranked these
We measured connector depth (native API coverage for stories, paid/organic, historical backfill), CRM write-back capability (native Salesforce/HubSpot objects vs. CSV export), sentiment model accuracy, pricing tier, and implementation time. Each was weighted by its impact on the four core deliverables: cross-network reporting, UTM attribution, competitive benchmarking, and scheduled exports. Higher weight went to mechanisms that separate marketing dashboards from revenue dashboards, such as identity resolution and data freshness.
We deliberately ignored vendor marketing claims, demo performance, and feature-matrix breadth without testing. We also excluded subjective factors like interface aesthetics and brand reputation, which do not predict whether a tool will answer a stakeholder's pipeline question. We focused on verifiable technical capabilities and documented failure modes, such as API policy shifts and metric definition drift, rather than anecdotal reviews or vendor-provided case studies.
Related questions
What is the difference between social analytics and social listening?
Analytics measures performance on your owned profiles—posts, reach, engagement, clicks. Listening monitors mentions across the open web, including forums, news, and review sites. If your question is about content performance, analytics suffices; if you need to track brand mentions off-platform, you need listening. The distinction determines your budget and vendor choice.
How reliable is CRM attribution from social media data?
It is directional, not deterministic. The join happens via UTM-tagged clicks landing on forms or manual association of listening records. Platforms never expose contact identity directly. You can prove that contacts who touched social convert at different rates, but you cannot prove a specific post closed a specific deal. Label the attribution model on every chart.
What historical data backfill can I expect when connecting a new tool?
Backfill windows typically range from 12 to 24 months, depending on tier and platform API limits. Some tools only collect from the connection date forward. Confirm this before purchase—it determines whether year-over-year comparison is available immediately or only after a full year of collection. This is a critical factor for seasonal businesses.
Is it worth exporting social data to Tableau or Power BI?
Yes, when social must sit alongside paid, web, and pipeline data in one executive view. Native dashboards are faster for social-only questions. Enterprise-tier tools offer connectors or API access; entry-tier tools usually offer CSV export only, meaning manual refresh. Weigh the integration effort against the value of a unified view.
What breaks most often after a successful social analytics rollout?
Profile connections authorized under an individual employee's account silently fail when that person leaves. Second most common: inconsistent UTM parameters that fragment attribution. Both are prevented by governance—shared service accounts and a written, enforced UTM taxonomy—not by tool selection. Regular audits of seats and connector health are essential.
How do I choose between Sprout Social and Brandwatch?
Sprout Social leads for mid-market teams needing cross-network reporting and CRM sync with Salesforce or HubSpot. Brandwatch excels at deep open-web listening and advanced NLP. If your primary need is owned-profile analytics and revenue attribution, choose Sprout. If you need to monitor brand mentions across forums and news, choose Brandwatch.
What is the typical implementation timeline for a mid-tier dashboard?
Budget two to four weeks: one week connecting profiles and resolving OAuth permissions, one week defining metric standards and building views, and one to two weeks in parallel-run against existing reporting. Enterprise listening deployments with custom query builds run six to twelve weeks. Expect at least one account where the admin has left the company.
How can I reduce seat costs when buying a social analytics tool?
Distinguish publishers, approvers, and report consumers. Reclassifying half your intended seat count as report consumers—who only need scheduled PDFs or read-only views—can cut the annual figure by 30–40%. Every vendor has a mechanism for this, either a cheaper viewer tier or scheduled distribution to non-users.
FAQ
What actually makes a social media analytics dashboard 'full-stack'?
Full-stack means the tool covers publishing, engagement and inbox moderation, listening across the open web, and reporting in one interface—rather than covering only one layer. The practical test is whether a single seat lets a user schedule a post, respond to a comment, monitor brand mentions off-platform, and produce a shareable report without switching tools. Many products marketed as full-stack are strong on two layers and thin on others.
How much should a mid-market team budget annually for social analytics?
For a team of six to ten with publishing and reporting needs across five or six networks, mid-tier per-seat pricing lands between roughly $10,000 and $30,000 per year, depending on how many need full seats versus read-only access. Add open-web listening and the figure typically doubles or more, because listening is priced on mention volume and language coverage. Model the seat split explicitly before requesting a quote.
Which tools tie social data into Salesforce or HubSpot?
Sprout Social offers native sync with both. HubSpot's own social tools inside Marketing Hub have zero integration friction if you already run HubSpot CRM, since social interactions land directly on contact and deal records. Enterprise listening platforms including Brandwatch and Meltwater offer Salesforce integrations that create listening records against accounts. Salesforce's own Social Studio has been retired.
Are the sentiment scores in these dashboards trustworthy?
Treat them as relative trend signals, not absolute measurements. NLP sentiment models handle clear positive and negative English statements reasonably well but degrade on sarcasm, industry jargon, mixed-sentiment posts, and non-English content. A week-over-week swing in aggregate sentiment is a useful early warning; a claim that brand sentiment is precisely 72% positive is not something to put in front of an executive without caveats.
Does every major tool support TikTok and YouTube analytics?
Coverage varies and changes. The publishing-and-analytics tools built for visual and creator-led brands generally support TikTok well; suite tools bundled into broader marketing platforms have historically lagged on TikTok and YouTube. Because platform API access shifts, verify current coverage during trial against your own connected accounts rather than relying on a feature matrix that may be months out of date.
Can report delivery be fully automated?
Yes, and this is where most of the time savings come from. Scheduled PDF or CSV exports delivered to email or Slack are standard in mid-tier and enterprise tools. The key is configuring the right cadence and audience. For a five-person team, manual reporting consumes six to twelve hours per month; automation collapses that to under two hours of interpretation.
What is the risk of vendor discontinuation in this category?
Salesforce Social Studio is the cautionary example: it was retired, and customers had to migrate. Products get acquired and sunset regularly—Brandwatch is now under Cision. Mitigation: confirm the export path before you sign. Can you get historical data out as CSV or via API, and does that right survive contract termination? Write it into the contract if it is not standard.
How do I handle API policy shifts like X's 2023 pricing changes?
This is systemic risk you cannot avoid, only plan for. X's API pricing restructuring broke or degraded third-party analytics access across the category, and vendors passed the cost through or dropped coverage. Never build a business-critical report that depends on a single network's connector without a manual fallback. Keep at least one native-platform number as a control metric.
What is the most common political failure with social analytics dashboards?
Attribution overclaiming. A dashboard reports 'social-attributed revenue' using a last-touch model, someone puts that number in a board deck, and finance later reconciles it against a different model and finds a large discrepancy. Once that happens, the entire dashboard loses credibility. Mitigation: label the attribution model on every chart, and present social contribution as assisted-conversion influence rather than owned revenue.
How do I prevent listening query pollution?
Brand names that are also common words generate enormous noise. A query for a brand called 'Pulse' without exclusions will pull in cardiology content, music venues, and lighting products. Poorly tuned queries also burn mention quota—enterprise contracts are metered on mentions per month. Always build exclusion terms and test against a sample before enabling alerts.
Sources
- https://sproutsocial.com/
- https://www.brandwatch.com/
- https://www.talkwalker.com/
- https://buffer.com/
- https://www.agorapulse.com/
- https://later.com/
- https://iconosquare.com/
- https://www.meltwater.com/
- https://www.salesforce.com/
- https://www.hubspot.com/
Related on PULSE
- [The Social Media Analytics Stack: Real-Time Sentiment and Trend Detection with Apache Flink and Elasticsearch](/knowledge/tk0430)
- [Tech Stack for a Privacy-Focused Analytics SaaS Platform](/knowledge/tk0464)
- [A Flutter and Firebase Stack for Rapid Prototyping of Social Apps](/knowledge/tk0382)
- [The WebGPU Visualization Stack for Geospatial Analytics in 2027](/knowledge/tk0537)
- [The Product Analytics and Experimentation Stack in 2027](/knowledge/tk0519)
- [Top 10 Video Editing Software for Freelance Social Media Managers in 2027](/knowledge/tk0458)
This page will be disappearing soon. Save it to your device for $1 — or read it free while it is here.
@Kory-White- · if Venmo asks, the last 4 of my number are 2012
 tkWhat should you know before investing in Tech Stacks in 2027?
 pulse-tech-stacksIs Tech Stacks worth it in 2027?
 pulse-tech-stacksHow much does Tech Stacks cost in 2027?
 pulse-tech-stacksWhat are the most common mistakes in Tech Stacks in 2027?
 pulse-tech-stacksTop 10 Tech Stacks strategies for 2027
 pulse-tech-stacksIs the Temporal Cloud worth its premium over self-hosted Cadence for a mid-size logistics tech stack in 2027?
 pulse-tech-stacksThe Social Media Analytics Stack: Real-Time Sentiment and Trend Detection with Apache Flink and Elasticsearch
 pulse-tech-stacksHow do you get started with Tech Stacks in 2027?
 pulse-tech-stacksTop 10 Data Engineering Tools for E-commerce Analytics Teams in 2027
 pulse-tech-stacksThe Open Source Stack for a Small Nonprofit CRM