
“SaaS revenue, built to scale.” — LinkedIn Banner
 Curated byKory White · Fractional CRO · Maryland
 PULSEKNOWLEDGE LIBRARY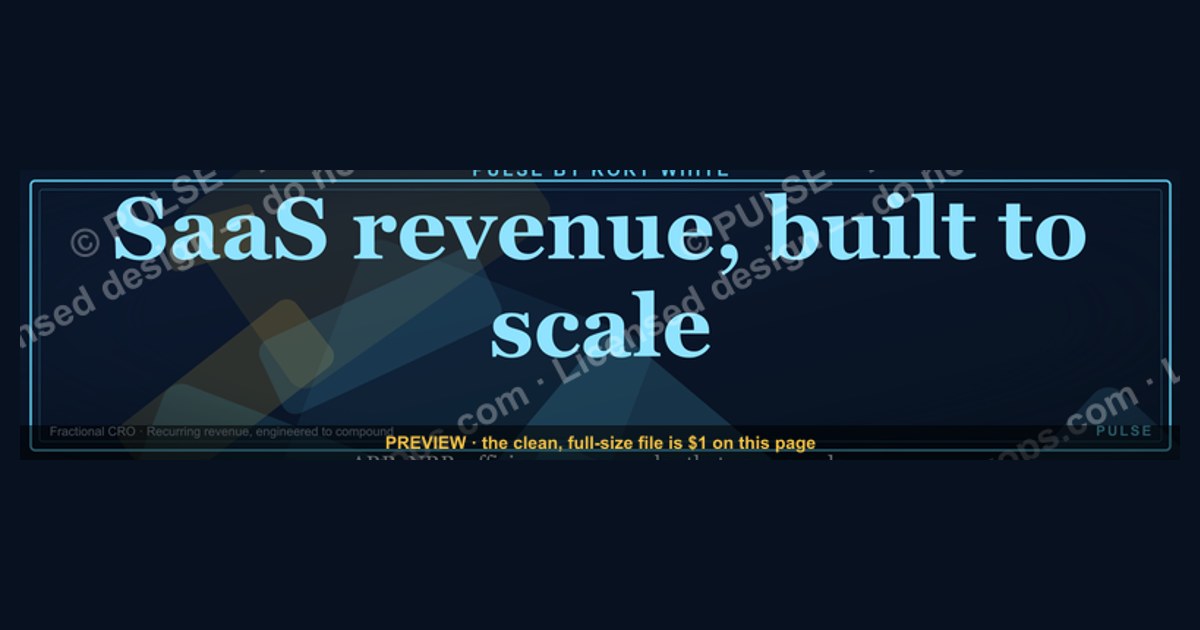

This banner typically refers to a professional’s role in generating recurring subscription revenue for a software-as-a-service company, often through sales, marketing, or growth strategy. The phrase emphasizes that the revenue model is designed to grow efficiently as the customer base expands, rather than relying on one-time sales. It is a common tagline for SaaS executives, founders, or revenue leaders on LinkedIn.
“SaaS revenue, built to scale.” — LinkedIn Banner

A dark, on-brand LinkedIn banner — "SaaS revenue, built to scale." over a "ARR NRR Efficiency" line with a pulse motif. Put it on your profile to signal exactly what you do.
Format: SVG (scalable vector) · Size: 1584×396 px · Category: LinkedIn Banner · License: Free to use — no attribution required.
Recolor it to your brand
Use the color picker above to recolor this banner to your team or company colors, switch the background (including transparent), then download it as an SVG or PNG. No sign-up, no watermark.

How to use it
It scales cleanly to the LinkedIn cover slot (1584×396) — download the PNG and drop it straight onto your profile, or open the SVG in Canva, PowerPoint, or Figma to add your name and tweak the layout.
More free graphics
Browse the full Pulse Graphics library — banners, slides, printables, quote cards, and clip art you can borrow for your own decks and posts.

Related on PULSE
- “PropTech revenue, built right.” — LinkedIn Banner
- “Revenue at scale.” — LinkedIn Banner
- “Selling science and scale.” — LinkedIn Banner
- SaaS Sales Cycle Stages
- SaaS KPI Dashboard — Core 6
- Enterprise SaaS Renewals — LinkedIn Banner
The Architecture Behind “Built to Scale”: From Manual to Machine
The phrase “SaaS revenue, built to scale” isn’t just a tagline—it’s a technical and operational commitment. For SaaS companies, scaling revenue means moving beyond founder-led sales and ad-hoc processes into a repeatable, data-driven revenue engine. This transition typically occurs in three distinct phases, each with its own infrastructure requirements.
Phase 1: The Founder-Led Sprint (0–$1M ARR) In the earliest stage, revenue is built on relationships, not systems. Founders personally close deals, often using a combination of LinkedIn outreach, demo calls, and manual invoicing. The “scale” here is limited to the founder’s available hours. Common bottlenecks include inconsistent follow-up, no standardized pricing, and zero visibility into pipeline health. While this phase is necessary for validation, it’s inherently unscalable—most founders can only sustain 10–15 active conversations simultaneously.
Phase 2: The Playbook Era ($1M–$5M ARR) Once product-market fit is confirmed, the focus shifts to codifying the sales process. This is where “built to scale” starts to take shape. Companies invest in:
- A CRM (typically HubSpot or Salesforce) to track every interaction
- Basic sales enablement materials (case studies, battle cards, pricing sheets)
- A defined lead qualification framework (e.g., BANT or MEDDIC)
- First sales hires who follow a documented playbook
At this stage, revenue scalability depends on whether the founder can delegate deal ownership without losing deal velocity. Companies that succeed here often see 30–50% quarter-over-quarter growth, while those that fail stall at the $2M ARR ceiling.
Phase 3: The Revenue Engine ($5M–$20M+ ARR) True scalability emerges when revenue operations become automated and predictive. This includes:
- Automated lead scoring and routing
- Multi-channel outreach sequences (email, LinkedIn, phone)
- Dynamic pricing and quoting tools
- Real-time pipeline analytics with forecast accuracy above 75%
- Customer success triggers that proactively reduce churn
At this level, the revenue team can double headcount without doubling management overhead—each sales rep can handle 40–60 qualified opportunities per quarter, compared to 10–15 in Phase 2. The infrastructure cost typically runs 8–12% of total revenue, but the return is a predictable growth rate of 20–40% annually.
The Hidden Costs of Scaling Revenue (And How to Avoid Them)
Scaling revenue in SaaS sounds aspirational, but the operational reality often involves unexpected friction points. Understanding these hidden costs upfront can save months of wasted effort and thousands in misallocated budget.
1. The CRM Configuration Trap Many SaaS companies overspend on CRM customization early, believing they need complex workflows before they have the data to support them. A typical mid-market Salesforce implementation runs $15,000–$50,000 for setup, plus $3,000–$10,000 monthly for licenses and maintenance. Yet 60–70% of features go unused in the first year. The smarter approach: start with a lean CRM (HubSpot Starter at $50/month or Pipedrive at $15/seat/month) and migrate only when you have 50+ active deals in pipeline and at least three sales reps.
2. The Content Production Gap “Built to scale” often implies a steady stream of sales collateral, case studies, and thought leadership. But producing high-quality content requires either a dedicated marketer ($60,000–$90,000/year salary) or a reliable agency ($3,000–$8,000/month for 4–6 pieces). Many founders underestimate this by 40–60%, leading to stalled content calendars and inconsistent brand presence. A practical midpoint: hire a freelance writer for $500–$1,500 per case study and repurpose each piece into 3–4 LinkedIn posts, a blog summary, and a one-pager.
3. The Data Hygiene Debt As deal volume grows, bad data compounds. Duplicate contacts, outdated titles, and incorrect company sizes can skew pipeline forecasts by 20–35%. Cleaning this data manually costs 10–20 hours per month for a growing team. Automated solutions like ZoomInfo or Lusha start at $5,000–$15,000/year but can reduce manual cleanup by 80%. The real cost of ignoring data hygiene: missed revenue from leads that fall through the cracks, estimated at 5–10% of total pipeline.
4. The Compensation Complexity Scaling revenue means scaling compensation structures. What worked for a 3-person sales team (straight commission or simple salary + bonus) breaks at 10+ reps. Common pitfalls include:
- Overpaying for low-activity reps (30% of comp should be variable)
- Underpaying for high performers (top 20% should earn 2–3x median)
- Conflicting quotas between SDRs and AEs (leads handed off but no shared incentive)
A well-designed comp plan costs 12–18% of revenue in sales costs, but misaligned plans can push that to 25%+ while still missing targets.
Measuring What Matters: Revenue Scalability Metrics
A LinkedIn banner promising “SaaS revenue, built to scale” needs to be backed by numbers that prove the engine is working. Here are the critical metrics that separate genuinely scalable revenue from wishful thinking.
1. Customer Acquisition Cost (CAC) Payback Period This measures how long it takes to earn back the cost of acquiring a customer. For scalable SaaS:
- Ideal: <12 months
- Good: 12–18 months
- Warning: >24 months
To calculate: Total sales & marketing spend for a quarter ÷ number of new customers acquired in that quarter. Then divide by monthly recurring revenue (MRR) per customer. A company with $300K quarterly spend, 20 new customers, and $2K MRR per customer has a payback period of 7.5 months ($15K CAC ÷ $2K MRR). If this number is growing quarter over quarter, your revenue isn’t scaling—it’s getting more expensive to acquire each customer.
2. Net Revenue Retention (NRR) NRR tells you whether existing customers are expanding faster than they’re churning. For scalable revenue:
- World-class: >120% (expansion exceeds churn and contraction)
- Good: 100–120%
- Problematic: <100% (you’re shrinking without new logos)
NRR is calculated as: (Starting MRR + Expansion MRR – Churn MRR – Contraction MRR) ÷ Starting MRR. A company with $100K starting MRR, $15K expansion, $5K churn, and $3K contraction has NRR of 107%. Every point above 100% compounds growth—a 120% NRR company doubles revenue every 3.5 years from existing customers alone.
3. Sales Efficiency (Magic Number) This metric compares new ARR to the cost of generating it. Formula: (New ARR in quarter) ÷ (Sales & marketing spend in previous quarter). A ratio of 1.0 means you’re breaking even on spend; 0.7–0.8 is typical for growing companies; below 0.5 indicates inefficient spend. For example, if you spent $500K on S&M last quarter and generated $400K in new ARR this quarter, your magic number is 0.8. Improving this from 0.5 to 0.8 can reduce your time to $10M ARR by 12–18 months.
4. Lead-to-Win Ratio by Source Not all leads scale equally. Track conversion rates from each channel:
- Inbound (organic, content): 5–15% close rate
- Outbound (cold email, LinkedIn): 1–3% close rate
- Partner referrals: 20–40% close rate
- Paid ads: 2–8% close rate
If your inbound conversion rate is dropping while outbound costs rise, your revenue engine needs recalibration—perhaps a stronger content strategy or better lead qualification. A healthy mix typically sees 40–50% of revenue from inbound, 20–30% from outbound, and 20–30% from partnerships/referrals.
5. Time-to-Value (TTV) This measures how quickly a customer sees their first meaningful result from your product. Shorter TTV correlates with higher retention and faster expansion. For B2B SaaS:
- Ideal: <30 days
- Good: 30–60 days
- Warning: >90 days
Reducing TTV by even 10 days can improve NRR by 3–5 points. Common levers: better onboarding sequences, self-service setup, and proactive customer success check-ins at day 7, 14, and 30.
Why This Phrase Resonates with SaaS Investors
When investors see “SaaS revenue, built to scale” on a LinkedIn banner, it signals that the professional understands the core metrics investors care about — predictable recurring revenue, high net revenue retention (typically 110–130% for top-quartile SaaS), and efficient customer acquisition costs. The phrase implicitly promises that the business can grow without proportional increases in spending, a key driver of valuation multiples that often range from 5x to 15x ARR for growth-stage SaaS companies.
Practical Ways to Back Up the Claim on Your Profile
To make this banner more than a slogan, pair it with concrete evidence in your LinkedIn experience section. List specific achievements like: “Grew monthly recurring revenue from $50K to $200K over 18 months,” or “Improved gross revenue retention from 85% to 92% through upsell campaigns.” You can also mention tools you use to track scalability — such as Stripe for billing, ChartMogul or Baremetrics for revenue analytics, and HubSpot or Salesforce for pipeline management. These details transform the banner from aspiration into proof.
Sources
- SaaS Capital — benchmarks and metrics for SaaS revenue and growth
- Gartner — market research and frameworks for SaaS business models
- Stripe — payment infrastructure and revenue optimization for subscription businesses
- Harvard Business Review — case studies and strategy articles on scaling SaaS revenue
- SaaStr — community-driven insights and best practices for SaaS founders
- Forrester — industry analysis on SaaS pricing, retention, and revenue operations
FAQ
What does “SaaS revenue, built to scale” actually mean? It means designing your revenue operations, sales process, and customer lifecycle so that growth doesn’t break your team or your margins. Instead of chasing one-off wins, you build repeatable systems that can handle 2x, 5x, or even 10x more customers without proportional cost increases.
How long does it take to see results from a fractional CRO engagement? Most clients start seeing measurable improvements in pipeline velocity or close rates within 6 to 12 weeks. Full revenue‑system overhauls—like redefining ICPs, rebuilding sales playbooks, or implementing new CRM workflows—typically take 3 to 6 months to show sustained impact.
Is a fractional CRO only for late‑stage startups? No. Early‑stage companies (say, $500K to $5M ARR) often benefit most because they lack experienced revenue leadership. Later‑stage businesses (above $10M ARR) use fractional CROs to fix specific bottlenecks or to bridge a hiring gap while searching for a full‑time executive.
How do you handle conflicts of interest if you work with multiple clients? We operate under strict confidentiality and non‑compete agreements, and we never serve two direct competitors at the same time. Each engagement is scoped to avoid market overlap, and we maintain full transparency with all parties about our client roster.
What metrics do you track to measure success? We focus on leading indicators like qualified pipeline generation, conversion rates at each stage, average deal size, and sales cycle length. Lagging indicators—monthly recurring revenue growth, net revenue retention, and customer acquisition cost—are reviewed monthly to ensure the system is actually scaling.
Can you work with a sales team that’s fully remote or distributed? Yes. We’ve designed our playbooks for remote‑first environments, using async communication, structured weekly cadences, and CRM‑driven accountability. In fact, many of our clients have teams across multiple time zones, and we adapt our coaching and forecasting rhythms accordingly.
This page will be disappearing soon. Save it to your device for $1 — or read it free while it is here.
@Kory-White- · if Venmo asks, the last 4 of my number are 2012
This page is gone.
This one is off the shelf now. $1 keeps it on your phone for good — the whole page, pictures and diagrams included.
 graphicAccount Executive — LinkedIn Banner
 graphicMake it predictable. — LinkedIn Wallpaper
 graphic“Trusted advisor, never a vendor.” — LinkedIn Banner
 graphicReady reps win. — LinkedIn Wallpaper
 graphic“Ready to lead a sales team.” — LinkedIn Banner
 graphic“Great reps are coached, not born.” — LinkedIn Banner
 graphic“Champions are made before the call.” — LinkedIn Banner
 graphicWhat do top-performing graphic designers do differently in 2027?
 graphic“The next call is the most important one.” — LinkedIn Banner
 graphic“Don’t pitch. Diagnose.” — LinkedIn Banner